Abstract
Contradictory results on the evolution of lenticular galaxies (S0s) at intermediate redshift have been recently published. A careful analysis of the used methodology shows that in order to gain insights on the evolution of the morphological types it is necessary: (1) to use quantitative morphological types, (2) to propagate morphological errors in the quantity used to measure the evolution of the S0s and (3) to adopt the same morphological classes at high as at low redshift, testing the correspondence with standard types. Some published analysis fail to satisfy at least one of the above three conditions, thus undermining the claim for a young age of S0s of intermediate redshift clusters.
THE AGE OF EARLY–TYPE GALAXIES
IN CLUSTERS
AN OBSERVATIONAL PERSPECTIVE
Osservatorio Astronomico di Capodimonte, Napoli, Italy.
1 Introduction
Two contradictory results on the evolution of lenticular (S0) galaxies are found: either S0s are old () and are evolving passively ([5], [9], [4], [12], [10]) or most of them formed at , as implied by the claimed deficit of S0s in intermediate redshift () clusters ([11], [8]). Furthermore, [13] found that at large clustercentric radii ( Mpc) of the intermediate redshift cluster Cl 1358+62 S0s are heterogeneous in color and have therefore experienced recently star formation.
This situation is quite puzzling: intermediate redshift lenticulars are red and with little scatter in color and are therefore thought to be as old as ellipticals ([9], [4]). Furthermore, data and samples studied by the different teams largely overlap: [4] and [9] studied respectively one and three clusters of the sample of 9 clusters studied by [11] & [8]. Are the differences found by the various teams due to the different analysis of the data or they reflect the possibility that the evolutionary history of galaxies differs from cluster to cluster, as may be suggested by the heterogeneous composition of the three intermediated clusters studied by [7]?
All the quoted works share a common idea: take a sample of galaxies in cluster, possibly at different redshift, split it in (morphological) classes, measure a property of the class (the morphological composition or the scatter in color of each class) and derive from this measure an evolutionary path for the classes. In this paper we focus our attention on the way galaxies are classified and on the effect that classification errors have on the inferred galaxy evolution. A more detailed discussion is given in [2]. [6] focus their review on how a given scatter in color propagates on the formation age.

2 The effect of misclassification errors on the S0 to E ratio
The spiral fraction in clusters increases with redshift, which implies that the E+S0 fraction decreases. The real variation of the E and S0 fractions due to evolution is therefore easily masked by the change of the S fraction. The S0 to E ratio, instead, is less dependent on the change of the S fraction and can be used as an indicator of a differential evolution of Es and S0s.
Figure 1 shows the various determinations of the S0 to E ratio. In the local universe, various determinations of the S0 to E ratio give similar values: [8], [1], the latter being based on only one cluster, whereas the former is the average of the composition of clusters (whose completeness in magnitude is undefined). For one cluster at intermediate () redshift and for another at high redshift (), [4] and [10] found a ratio of and , respectively. Instead [8] found for 9 clusters at intermediate redshift a ratio of .
Reference [8] assumes that classification errors have a negligible impact on the S0 to E ratio. Given the errors, each S0 to E ratio at measured by [8] is incompatible at with the values measured by other teams or by themselves at zero redshift; [8] therefore claim the existence of a deficit of S0s in intermediate redshift from their own measures.
Morphological types, as all physical quantities, are subject to errors. Usually, 20 % of the galaxies have discrepant morphological types when classified by independent morphologists ([3]), and this holds true also for the morphological estimates made by [8] (cfr. [11]).
How large is the impact of morphological errors on the S0 to E ratio?
If the number of misclassified galaxies of a given class, say E, is balanced by the number of the misclassified galaxies of the other classes, say S and S0, morphological errors have negligible effects. However, the amplitude of the error depends on the cluster morphological compositions, since in clusters with different compositions a different number of galaxies enter and exit from each class because the probability of a correct (or uncorrect) classification is independent on the morphological composition of the cluster. For this reason, the impact of morphological errors is not always negligible.
Actually, the impact may be very large, say larger than 100 %, when the S0 to E ratio is small (as in the estimate of [8] at intermediate redshift), or when the morphological errors are systematic, for example if more galaxies of type X are misclassified as of type Y than vice versa. At first sight, the assumption that the errors are largely systematic seems excessive, nevertheless we note that this is what happens in the cluster in common between [4] and [8]: all S0s in [4] are classed E or S by [8] and no-one E or S is misclassified as S0.
Taking into account morphological errors, ([8])’s errorbars grow from to units, making all the estimates of the S0 to E ratio equal within less than (see Figure 1), thus undermining the claimed deficit of S0s at intermediate redshift.
We would like to underline that the claim of a deficit of S0s in intermediate redshift clusters is based on a subjective measure: the estimate of the morphological type by visual inspection of the galaxy images. It is unsatisfactory that the evolution of a class of object is ultimately based on a qualitative measurement (the morphological type). It would be much more reliable if the possible existence of such a deficit could be based on a quantitative estimate of the morphological type. It should be stressed, however, that a small sample have such a quantitative morphological estimate and does not present any evidence for a deficit of S0s ([4]).
3 The heterogeneity of S0s at large clustercentric radii
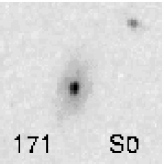
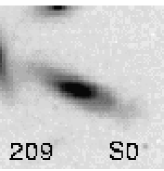
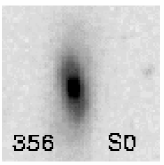
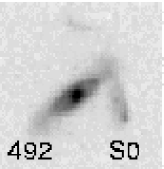
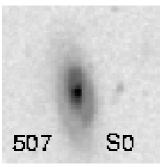
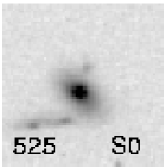
Recently, [13] found that at large clustercentric radii ( Mpc) in the intermediate redshift cluster Cl 1358+62, S0s are heterogeneous in color and therefore experienced star formation until very recently; a conclusions which is opposite to those claimed in previous works focused on the central regions of other intermediate redshift clusters ([9], [4]). They suggest that S0s evolve primarily in the transition region between the cluster and the field, giving support to [8]’s & [11]’s finding that S0s are still forming at intermediate redshift. However, [13] choose to classify as S starforming galaxies only, leaving spirals with faint or smooth spiral structures in the S0 class (see their Section 2.3.1). This is confirmed by the inspection of their black and white prints presented in their Figure 3: at least 25 % of all galaxies that [13] classify as S0s are S. Some notable examples are reproduced here in Figure 2. All these galaxies show smooth spiral arms (or irregular isophotes) and look as Cl 0939+47 or Coma spirals. Therefore, [13] use a classification scheme different from the one of all the other workers. Their conclusion on the evolutive nature of S0s is therefore relative to their S0 class, and not to the Hubble S0 class.
4 Conclusion
The analysis of the work done so far shows that in order to gain insights on the evolution of galaxies at intermediate redshift we need:
– to use quantitative morphological types: the conclusions drawn from splitting galaxies in classes are too important to be based on qualitative measures only;
– to take into account the effect of morphological errors on the quantity used to measure the evolution of the considered class;
– to adopt the same morphological classes at high and at low redshift, testing the ability to reproduce the morphological type assigned by famous and recognized morphologists. Hubble types (E, S0, S) correspond to well defined morphologies and should not be used for other types of objects.
The two works presenting evidences for different evolutionary paths for S0 and E fail to satisfy at least one of these three conditions, thus undermining the claim for a young age of S0s of intermediate redshift clusters.
Acknowledgements. We thank the organizer of the “Xth Rencontres de Blois”, for the financial support given for attending the conference. We thank G. Longo for an attentive lecture of this paper.
References
- [1] Andreon S., 1996, Astr. Astrophys. 314, 763
- [2] Andreon S., 1998, Astrophys. J. 501, 533
- [3] Andreon S., Davoust E., 1997, Astr. Astrophys. 319, 747
- [4] Andreon S., Davoust E., Heim T., 1997, Astr. Astrophys. 323, 337
- [5] Bower R., Lucey J., Ellis R., 1992, MNRAS 254, 601
- [6] Bower R., Terlevich A., Kodama, T., Caldwell N., 1998, in Star Formation in Early–Type Galaxies, ASP Conf. Ser., eds. P. Carral & J. Cepa, 1998 (astro-ph/9808325)
- [7] Couch W., Barger A., Smail I., Ellis R., Sharples R., 1998, Astrophys. J. 497, 188
- [8] Dressler A., Oemler A., Couch W., et al., 1997, Astrophys. J. 490, 577 (MORPHS)
- [9] Ellis R., Smail I., Dressler A. et al., 1997, Astrophys. J. 483, 582
- [10] Lubin L., Postman M., Oke J., Ratnatunga K., Gunn J., Hoessel J., Schneider D., 1998, Astron. J. , in press (astro-ph/9804286)
- [11] Smail I., Dressler A. Couch W. et al., 1997, Astrophys. J. Suppl. Ser. 110, 213
- [12] Stanford S., Eisenhardt P., Dickinson M., 1998, Astrophys. J. 492, 461
- [13] van Dokkum P., Franx M., Kelson D., et al., 1998, Astrophys. J. 500, 714