Evolution of halo-halo clustering and bias in a CDM model
Abstract
ABSTRACT. We study the evolution of the halo-halo correlation function and bias in a ΛCDM model using very high-resolution -body simulations with dynamical range of (force resolution of and particle mass of ). The high force and mass resolution allows dark matter (DM) halos to survive in the tidal fields in high-density regions and thus prevents the ambiguities related with the “overmerging problem.” Numbers of galaxy-size halos in cluster-like objects in our simulation are similar to the numbers of galaxies observed in real clusters. This allows us to estimate for the first time the evolution of the correlation function and bias at small (down to ) scales. We compare particle distribution, dark matter correlation function, density profiles, and halo mass function produced with our -body code and corresponding results of the AP3M simulations.
We find that at all epochs the 2-point correlation function of galaxy-size halos is well approximated by a power-law with slope . The difference between the shape of and the shape of the correlation function of matter results in the scale-dependent bias at scales , which we find to be a generic prediction of the hierarchical models, independent of the epoch and of the model details. We find that our results agree well with existing clustering data at different redshifts, indicating the general success of the picture of structure formation in which galaxies form inside the host DM halos. Particularly, we find an excellent agreement in both slope and the amplitude between in our simulation and the galaxy correlation function measured using the APM galaxy survey. At high redshifts, the observed clustering of the Lyman-break galaxies is also reasonably well reproduced by the models.

1 Introduction
It is widely believed that the distribution of galaxies is different from the overall distribution of dark matter (DM). This difference, the bias, is crucial for comparisons between observations and predictions of cosmological models. Observations provide information about the distribution of objects such as galaxies and galaxy clusters. The models, however, most readily predict the evolution of the dark matter distribution, which cannot be observed directly. The models, therefore, should be able to predict the distribution of objects or, conversely, predict how this distribution is different from that of the dark matter (i.e., the bias). In the seminal paper, Kaiser (1984) introduced the notion of bias to explain the strong clustering of galaxy clusters. During the subsequent years, many analytical and numerical studies have been done on the subject of the cluster and galactic bias (see, e.g., references in Colín et al. 1998). However, only recently the dynamic range of the pure -body simulations has become sufficiently high to allow to study unambigously the small-scale bias of DM halos. In this contribution, we present the results on the small-scale () halo-halo clustering and bias of halos in one of the currently most successful cosmological scenarios: flat CDM model with non-zero cosmological constant (CDM). The parameters of the model are as follows: ; ; ; and age of Gyrs. These results are a part of a larger study of the bias evolution in different cosmological models described in Colín et al. (1998) and we refer the reader to this paper for further details.
2 Numerical Simulation
One of the main goals of our study was to compute the correlation function and the bias accounting for all DM halos, including those inside groups and clusters. To assure that halos do survive in clusters the force resolution should be (Moore et al. 1996; Klypin et al. 1998). Furthermore, if we aim to study galaxy-size halos, the mass resolution should be to resolve galaxy-size halos () with at least particles. The compromise between these considerations and the computational expense determined the force and mass resolution of our simulation carried out with the Adaptive Refinement Tree (ART) -body code (Kravtsov, Klypin & Khokhlov 1997): particle mass of and peak spatial resolution of . The dynamical range of the simulation implied by the force resolution is ( formal). The ART code integrates the equations of motion in comoving coordinates. However, its refinement strategy is designed to effectively preserve the initial physical resolution of the simulation. In order to prevent degradation of force resolution in physical coordinates, the dynamic range between the start and the end () of the simulation should increase by : i.e., for our simulations reach . This is accomplished with the prompt successive refinements in high-density regions during the simulations. The peak resolution is reached by creating a refinement hierarchy with six levels of refinement. The spatial refinement is accompanied by the similar refinement of integration time step.
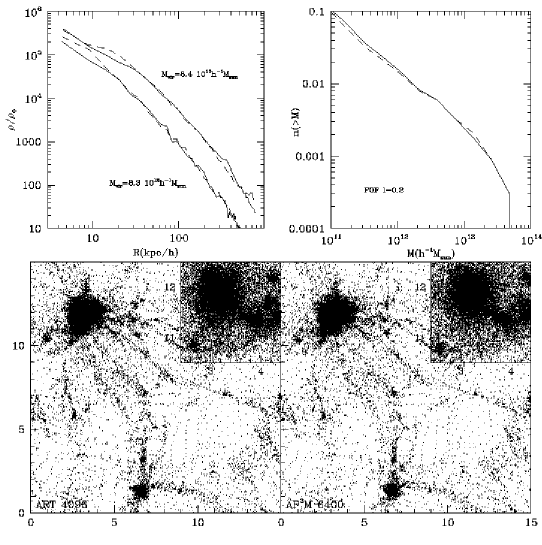
We use Bound Density Maxima (BDM, Klypin et al. 1998) algorithm to identify galaxy-size halos that are isolated or belong to a larger system. The main idea of the BDM algorithm is to find positions of local maxima in the density field smoothed at a certain scale and to apply physically motivated criteria to test whether the identified site corresponds to a gravitationally bound halo. The detailed description of the halo finder and simulation parameters can be found in Colín et al. Here we present results of the tests of code performance based on comparisons with AP3M simulations. In Figure 1 we compare the 2-point correlation function of the dark matter in our simulation with similar estimates made with the PM and AP3M codes (cf. fig. caption). We have made appropriate corrections to the amplitude of the correlation function to account for slightly different normalizations of the simulations. Figure 1 shows that there is a very good agreement between all estimates at scales . The ART and AP3M estimates agree to better than 10% at scales ! On larger scales the ART correlation function has a smaller amplitude than that of the AP3M due to a factor of 2.35 smaller box size of the former. This result is in agreement with previous studies which concluded that the correlation function is underestimated at scales of the simulation box size. Nevertheless, the agreement is striking at smaller scales, given all the differences (including cosmic variance) between the estimates. We conclude, therefore, that the correlation functions discussed in the next section are robust at scales . The second test used smaller simulations of the CDM model to test the distribution and properties of halos produced by the ART and AP3M codes. This test is a part of a comparison study carried out in collaboration with Alexander Knebe and Stefan Gottlöber (AIP, Potsdam). The ART simulations had a (formal) dynamic range of 4096, while the AP3M simulation had a dynamic range of 6400. Figure 2 shows comparison of the particle distributions, density profiles of halos, and halo mass functions in the two simulations. Although the small-scale details of the particle distribution are slightly different (due to different time integration schemes used and somewhat different spatial resolutions) the overall distribution is very similar in the two runs. Almost identical results are also observed for the density profiles and halo mass function.
3 Results
Our analysis shows that at all epochs correlation functions of halos and dark matter are different in both shape and amplitude at scales . The difference in amplitude means that halos are biased with respect to dark matter, while the difference in shape implies that the bias is scale-dependent. Figure 3 shows evolution of the bias with redshift at different scales and for halos with different minimum circular velocities111The circular velocity is a mass indicator: the more massive is a halo, the higher is its circular velocity.. We use a conventional definition of the bias as a square root of the ratio of the halo and dark matter correlation functions. The figure shows that bias undergoes a significant evolution with redshift: it is high, at high redshifts , and then rapidly decreases at lower redshifts to at . The high value of bias at early epochs is in reasonably good agreement with the recent observations of strong galaxy clustering at high redshifts (Steidel et al. 1998). The Fig. 3 also shows that at high redshifts, bias depends on the mass of halos: the massive halos are clustered more strongly than less massive ones. The scale-dependency of the bias is illustrated in the bottom panel of the Fig. 3, in which we show evolution of the bias at three different scales for the halos with the circular velocity . Although qualitatively the evolution is similar, the rate of evolution and the value of bias are clearly dependent on the scale. In this panel we also show analytical prediction of given by Moscardini et al. (1998) for halos of mass . There is a good qualitative agreement between analytical predictions and our numerical results.

We find that at all epochs the correlation function of DM halos is well described by a power law , where and . This is in good agreement with the shape and amplitude of the galaxy correlation function at both low and high redshifts. Figure 4 shows the correlation functions of halos in our simulation and the correlation function of galaxies from the APM galaxy survey. The figure shows that there is an excellent agreement between the two at all scales probed by our simulation. The dotted line in the bottom panel of Fig.4 shows the correlation function of the dark matter. Note the difference in shape between correlation functions of halos and dark matter. This difference implies that the bias is scale-dependent; the bias as a function of scale is shown in the upper panel of Fig.4. Note also that halo correlation function has a lower amplitude than that of dark matter at scales . This means that halos at these scales are anti-biased with respect to the dark matter.

Overall, the comparisons discussed above and more detailed analysis of Colín et al. (1998) indicate that there is good agreement between our results and the clustering data at both low and high redshifts. This implies that hierarchical models in which observed galaxies form in the host DM halos naturally explain the observed galaxy clustering at different epochs, including excellent agreement with the accurately measured correlation function. On the other hand, the generic form of the bias evolution observed in the numerical simulations at high redshifts agrees well with the prediction of the analytical models based on the extended Press-Schechter formalism. This implies that we understand the nature of the bias and the processes that drive its evolution at high . It is also reassuring that our results are in good agreement with results of the studies which have used semi-analytical modelling to follow evolution of galaxies in DM halos (e.g., Kauffmann et al. 1998; Benson et al. 1998), as well as with the results of direct numerical hydro simulations (Jenkins et al. 1998; this meeting). The success of the current theoretical models in interpreting the clustering data forms a solid foundation for further sophistication of the numerical models by including the processes important for galaxy formation (such as dynamics of baryons, cooling, star formation, and stellar feedback). We can expect, therefore, that the problem of galaxy biasing will be tackled in the foreseeable future, which would open for us great possibilities for the analysis of the ever increasing amount of observations of galaxy clustering at low and high redshifts.
References
- [1] Benson, A.J. et al. 1998, astro-ph/9809171
- [2] Colín P., Klypin A.A., Kravtsov A.V., Khokhlov A.M., 1998, ApJ submitted, preprint astro-ph/9707167
- [3] Kaiser N., 1984, ApJ, 284, L9
- [4] Kauffmann, G. et al. 1998, astro-ph/9809168
- [5] Klypin A.A., Gottlöber S., Kravtsov A.V., Khokhlov A.M., 1998, ApJ submitted (astro-ph/9708191)
- [6] Kravtsov A.V., Klypin A.A., Khokhlov A.M., 1997, ApJS, 111, 73
- [7] Moore B., Katz N., & Lake G., 1996, ApJ, 457, 455
- [8] Moscardini, L. et al. 1998, MNRAS, 299, 95
- [9] Steidel, C.C. et al. 1998, ApJ, 492, 428