Measurement of Low-Energy Cosmic-Ray Antiprotons at Solar Minimum
Abstract
The absolute fluxes of the cosmic-ray antiprotons at solar minimum are measured in the energy range 0.18 to 1.4 GeV, based on 43 events unambiguously detected in BESS ’95 data. The resultant energy spectrum appears to be flat below 1 GeV, compatible with a possible admixture of primary antiproton component with a soft energy spectrum, while the possibility of secondary antiprotons alone explaining the data cannot be excluded with the present accuracy. Further improvement of statistical accuracy and extension of the energy range are planned in future BESS flights.
pacs:
PACS numbers: 98.70.Sa, 95.85.RyThe strict upper limit [3] on the cosmic-ray antihelium/helium ratio provides most direct evidence for Galaxy and nearby part of Universe being composed solely of particles. If so, antiproton () in cosmic-ray must have been produced in pairs with protons (’s) by some elementary-particle processes in Galaxy or in Universe. One such process which should certainly exist is the interaction of high energy cosmic rays with interstellar gas. The energy spectrum of ’s from this “secondary” process is expected to show a characteristic peak at GeV and sharp decreases of the flux below and above the peak. One can also conceive more novel or exotic elementary-particle processes such as the annihilation of neutralino dark matter or the evaporation of primordial black hole [4]. The ’s from these “primary” sources are expected to show very soft energy spectra [5], peaking toward the lower energies, and would exhibit large solar modulations [6].
Although general characteristics of cosmic-ray data accumulated over last 20 years seem compatible with the secondary , poor statistics of the data do not allow further investigation. A detector with much larger acceptance is needed both to determine the secondary flux and to perform a sensitive search for low-energy primary component. We report here (for detail see [7]) on such an attempt with the BESS spectrometer, which was designed [8] and constructed for this purpose. By using BESS ’93 data, the first mass-identified detection of cosmic-ray ’s was reported [9, 10] based on four events detected in the low-energy range of 0.3 to 0.5 GeV. This measurement (BESS ’95) extends the range to 1.4 GeV, and was conducted at a period close to solar minimum.
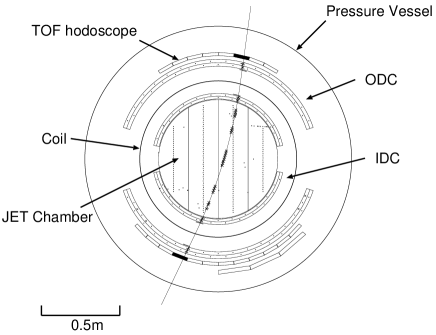
The BESS detector [11] is shown in Fig.1. The thin superconducting coil [12] (4 g/cm2 thick including the cryostat) produces a uniform axial magnetic field of 1 Tesla. The -tracking in the central region is performed by fitting up to 28 hit-points, each with 200 m resolution, in the JET- and IDC-drift chambers, resulting in a magnetic-rigidity [13] resolution of 0.5 % at 1 GV/. Tracking in the -coordinate is done to an accuracy of 300 m by fitting points in IDC measured with vernier pads and points in the JET chamber measured using charge-division. The continuous and redundant 3-dimensional tracking with the drift chambers, all equipped with multi-hit capacity, enables us to recognize multi-track events and tracks having interactions and scatterings, thus minimizing the background. The of the particle in the JET chamber is obtained as a truncated mean of the integrated charges of the hit-pulses which compose the track. The TOF scintillator hodoscopes, newly built for ’95 flight, measure the time-of-flight of particles with a resolution of 110 ps as compared to previous 280 ps.
The first-level trigger is provided by a coincidence between the top and the bottom scintillators, with the threshold set at 1/3 of the pulse height from vertically incident minimum ionizing particles. The second-level trigger, which utilizes the IDC and ODC hit-patterns, first rejects the null- and multi-track events (pattern-selection) and makes a rough rigidity-determination to select negatively-charged particles (rigidity-selection). In addition, one of every 90 first-level triggers is recorded, irrespective of the second-level trigger condition, to build a sample of unbiased triggers from which the efficiencies are determined. The ’95 BESS flight was carried out on July 25, from Lynn Lake, Canada. The scientific data were taken at an altitude of 36 km (a residual atmosphere of 5 g/cm2) with a rigidity cutoff ranging 0.3 to 0.5 GV/. During the live time of sec, 4.6 million events were recorded on magnetic tapes, out of 60 million cosmic rays which passed through the detector.
The following off-line selections are applied equally for positive- and negative-rigidity events. (i) Only one counter is hit in each layer of the TOF hodoscopes; (ii) Only one track, which is fully contained in the fiducial region, should be found in the JET chamber. The following cuts are then applied to ensure the qualities of the track and the timing measurements. (1) The fitted - and -track, respectively, should contain at least 10 and 5 hits in the JET chamber, and at least one hit in each of the upper two and lower two IDC layers; (2) The reduced of both the fitted - and -track have to be less than 5; (3) The extrapolated track should cross the fiducial region of TOF scintillators ( cm); (4) The -position determined by the left-right time difference measured by the PMTs should match the -impact point of the extrapolated track at the TOF counter within 3.8 cm; (5) The ratio of the signal amplitude of the left and right PMTs should be consistent with the -impact point of the extrapolated track. The combined efficiency of these off-line selections is found to be 81 % at 0.7 GV/ and 78 % at 2 GV/ for the protons.

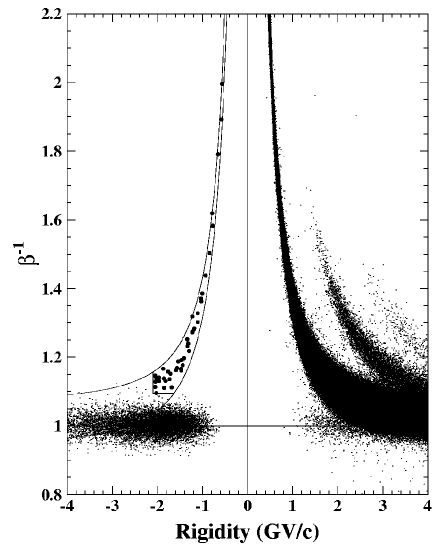
We then require that the ’s and the protons must have proper in the top and bottom scintillators as well as in the JET chamber (shown in Fig.2). These selections reject all of the particles with charge greater than 1 and most of the low-energy , while keeping 90 % efficiency for protons. The vs. rigidity() plot for the remaining events is shown in Fig.3. A clear band of ’s is visible at the position exactly symmetric to the proton band. Each of the candidates was closely investigated on the event display for correctness of the track fitting etc., and no particular problems were found. The probability of positive-rigidity particles or albedo (up-going) particles faking any of the candidates is negligibly small. Also it is apparent from the cleanness of the -band that there is no background, particularly in the high region. We limit further analysis to the region in order to have a negligible contamination (less than 0.5 events) due to the tail of the distribution. The rigidity region is limited to GV/, since the efficiency of the above cut becomes lower than 50 % outside of this -range. As seen in Fig.3, all of the 43 negatively-charged events observed in this – region reside inside the 97 % inclusion band expected for the ’s. Furthermore, the masses determined for these events show the correct central value, and the distribution is similar to the one observed for the protons. All these background-studies and the consistency-checks allow us to conclude that the 43 events are real ’s incident on the BESS spectrometer. To check against the possibility that any of the ’s were re-entrant albedo, we numerically traced back the trajectories of all ’s through the Earth’s geomagnetic field and confirmed that all events came from outside of geomagnetic sphere.
| TOA Kinetic energy | No. of | No. of | TOA flux | TOA ratio | ||||||
|---|---|---|---|---|---|---|---|---|---|---|
| (GeV) | detected | atm. | (m2sr) | (m-2s-1sr-1GeV-1) | ||||||
| 0.175 - 0.3 | 3 | 0.17 | 0.30 | 0.73 | 0.96 | 0.68 | 0.49 | 0.87 | ||
| 0.3 - 0.5 | 7 | 0.78 | 0.31 | 0.73 | 0.92 | 0.74 | 0.62 | 0.88 | ||
| 0.5 - 0.7 | 7 | 1.4 | 0.31 | 0.73 | 0.87 | 0.74 | 0.65 | 0.89 | ||
| 0.7 - 1.0 | 11 | 2.8 | 0.32 | 0.72 | 0.80 | 0.73 | 0.67 | 0.89 | ||
| 1.0 - 1.4 | 15 | 3.5 | 0.32 | 0.72 | 0.72 | 0.56 | 0.68 | 0.90 |
Based on these 43 events, we obtain the energy spectrum at the top of the atmosphere (TOA) in the following way: The TOA energy of each event is calculated by tracing back the particle through the detector material and air by using Bethe-Heitler routine of geant 3.21. The corrections are usually small, 30 3 MeV for a 1 GeV event. For the particular lowest-energy event which has 157 MeV at the center of the detector, the energy correction amounts to 66 MeV with estimated accuracy of 2 MeV. Among the factors necessary to obtain the flux, the geometrical acceptance () can be calculated reliably both analytically and by Monte Carlo methods due to the simple geometry and uniform magnetic field. The efficiencies of the pattern-selection () and of the rigidity-selection () for the second-level trigger as well as the off-line selection efficiency for the protons are directly determined by using the unbiased trigger sample. The selection efficiency for the ’s () is obtained by multiplying the proton selection efficiency by the ratio (ranging from 1.30 at 0.3 GeV to 1.12 at 1.4 GeV) of Monte Carlo simulated selection efficiencies for the ’s to protons. In this way we minimize the effect of inaccuracy of the simulation. The geant/gheisha code is used for the simulation by incorporating the detailed material distribution and realistic detector performance in order to also evaluate the interaction loss in the instrument (). Care is taken [7, 10] to use the correct -nuclei inelastic (including the annihilation) cross sections, since original gheisha uses cross sections much higher than recent measurements, especially below 1 GeV. The survival probability () of the ’s through the air is estimated by the Monte Carlo simulation. We also subtract the expected number of atmospheric ’s, produced by the collisions of cosmic rays in the air. Among recent calculations [14, 15, 16] of the atmospheric ’s, which agree within 20 % relative accuracy, we take the one [14] which utilizes the most detailed nuclear model and the 3-dimensional Monte Carlo simulation.
Table I summarizes all relevant quantities and resultant fluxes in five energy bins. The first and the second errors, respectively, represent the statistical and systematic errors. The statistical errors are calculated properly [17] for the Poisson distributions. The dominant systematic error at low-energy bins is the uncertainty in the interaction losses, to which we attribute 40 % relative error. At high energy bins, the uncertainty in the atmospheric calculations, to which we attribute 30 % relative error, becomes an important systematic error. In all bins, the systematic errors are overwhelmed by the statistical errors. Table I also contains the ratios, obtained by counting the number of protons which survive the same selections as for the ’s. The interaction losses of the protons in the air and in the instrument are corrected by the same Monte Carlo simulations, and the atmospheric protons are subtracted based on Ref.[18].

Our data on the flux are shown in Fig.4 together with previous measurements and various theoretical calculations. Our data are consistent with recent measurements (including BESS ’93 result), all of which have much larger statistical errors. The energy spectrum we have obtained appears to be flat below 1 GeV within present statistical accuracy, and does not exhibit the steep decline which seems generic to calculations [21, 22, 23] for the secondary ’s. This might be due to a statistical fluctuation, might indicate that the propagation models need to be modified, or might perhaps suggest a contribution of primary component with energy spectrum much softer than the secondary . We note [25] that an admixture of ’s [6] from evaporating primordial black holes (PBH) [4], added to a standard leaky box (SLB) calculation [23] of the secondary ’s, could provide a fit (thick dashed curve in Fig.4) to the data. Primary ’s component from the annihilation of neutralino dark matter could also explain [6, 25] the observed spectrum, if we assume an astrophysical enhancement factor of 15 or more, which might be possible [6] due to the clumpiness of the dark matter. However, given the present large statistical errors and the ambiguities in the flux of the secondary ’s, we cannot exclude the possibility of the secondary ’s alone explaining the data, especially if the actual secondary flux is among the largest predicted. To clarify the situation, one needs; a) to improve the statistical accuracy, b) to detect the predicted peak of the secondary ’s by extending the energy range of the identification and to accurately measure its absolute flux, and c) to measure the change of the energy spectrum with solar activity. Concerning the point c), it was shown [6] that a clear signature of a primary component can be obtained by observing an enhancement of low-energy ’s at the solar minimum and a sharp decrease afterward. Independent to the search for the primary component, the precise measurement of the secondary spectrum itself will be of crucial importance to determine the propagation mechanism of cosmic rays in the Galaxy. We intend to accomplish these purposes in future BESS flights.
Sincere thanks are given to NASA and NSBF for balloon launch and various related support. We thank Y. Ajima, M. Fujikawa, Y. Higashi, N. Kimura, T. Maeno, Y. Nishihara, M. Otoba, M. Sasaki and D. Righter for their help. The analysis was performed by using the computing facilities at ICEPP, Univ. of Tokyo. This experiment was supported by NASA in the USA, and by a Grant-in-Aid for Scientific Research from the Ministry of Education and by a Sumitomo Research Grant in Japan.
REFERENCES
- [1] Electronic address: oriton@icepp.s.u-tokyo.ac.jp
- [2] deceased.
- [3] T. Saeki et al., Phys. Lett. B 422, 319 (1998).
- [4] S. W. Hawking, Commun. Math. Phys. 43, 199 (1975).
- [5] K. Maki, T. Mitsui, and S. Orito, Phys. Rev. Lett. 76, 3474 (1996).
- [6] T. Mitsui, K. Maki, and S. Orito, Phys. Lett. B 389, 169 (1996).
- [7] H. Matsunaga, Ph.D. thesis, University of Tokyo, 1997.
- [8] S. Orito, KEK Report 87-19, p.111, 1987, Proceedings of the ASTROMAG Workshop, edited by J. Nishimura, K. Nakamura, and A. Yamamoto.
- [9] K. Yoshimura et al., Phys. Rev. Lett. 75, 3792 (1995).
- [10] A. Moiseev et al., Astrophys. J. 474, 479 (1997).
- [11] A. Yamamoto et al., Adv. Space Res. 14, (2)75 (1994).
- [12] A. Yamamoto et al., IEEE Trans. Magn. 24, 1421 (1988).
- [13] The magnetic-rigidity ( also denoted as rigidity) is defined as , where and are respectively particle’s momentum and charge. is measured from the bending radius in the magnetic field.
- [14] T. Mitsui, Ph.D. thesis, University of Tokyo, 1996.
- [15] Ch. Pfeifer, S. Roesler, and M. Simon, Phys. Rev. C 54, 882 (1996).
- [16] S. A. Stephens, Astropart. Phys. 6, 229 (1996).
- [17] Particle Data Group, Phys. Rev. D 54, 166 (1996).
- [18] P. Papini, C. Grimani, and S. A. Stephens, Nuovo Cimento 19, 367 (1996).
- [19] J. W. Mitchell et al., Phys. Rev. Lett. 76, 3057 (1996).
- [20] M. Boezio et al., Astrophys. J. 487, 415 (1997).
- [21] M. Simon, A. Molnar, and S. Roesler, Astrophys. J. 499, 250 (1998).
- [22] T. K. Gaisser and R. K. Schaefer, Astrophys. J. 394, 174 (1992).
- [23] T. Mitsui, S. Orito, and J. Nishimura, (in preparation).
- [24] U. Heinbach and M. Simon, Astrophys. J. 441, 209 (1995).
- [25] S. Orito, T. Mitsui, and K. Maki, (in preparation).
- [26] L. A. Fisk, J. Geophys. Res. 76, 221 (1971).