05 (08.08.1; 08.05.2 08.12.3 11.19.4.NGC 2006 11.19.4 SL 538 11.13.1)
A. Dieball, adieball@astro.uni-bonn.de 11institutetext: Sternwarte der Universität Bonn, Auf dem Hügel 71, D–53121 Bonn, F.R. Germany, adieball@astro.uni-bonn.de 22institutetext: Astronomisches Institut der Universität Würzburg, Am Hubland, D–97074 Würzburg, F.R. Germany 33institutetext: UCO / Lick Observatory, University of California, Santa Cruz, CA 95064, USA
The cluster pair SL 538/ NGC 2006 (SL 537) ††thanks: Based on observations taken at the European Southern Observatory, La Silla, Chile, during time allocated by the MPIA, Heidelberg.
Abstract
We studied in detail the binary cluster candidates SL 538 and NGC 2006 in the Large Magellanic Cloud (LMC). This cluster pair is located in the northwestern part of the large OB association LH 77 in supergiant shell LMC 4. A third star cluster, KMHK 1019, is located within from the cluster pair. Our study is the first age determination of SL 538 and NGC 2006 that is based on CMDs. We derived an age of Myr for SL 538, Myr for NGC 2006, and Myr for KMHK 1019. Thus the three clusters are (nearly) coeval. We identified Be star candidates and find the same ratio N(Be)/N(B) for the components of the binary cluster (12%) while the amount of Be stars detected in KMHK 1019 (5%) and in the surrounding field (2%) is considerably lower. Since Be stars are usually rapid rotators this may indicate intrinsically higher rotational velocities in the components of the cluster pair. Also the IMF derived from the CMDs shows the same slope for both SL 538 and NGC 2006 and is consistent with a Salpeter aIMF. An estimation of the cluster masses based on the IMF slopes showed that both clusters have similar total masses. These findings support joint, near-simultaneous formation of the cluster pair in the same giant molecular cloud.
keywords:
Hertzsprung-Russel (HR) diagram – stars: emission line, Be – stars: luminosity function, mass function – star clusters: individual: NGC 2006 and SL 538 – Magellanic Clouds1 Introduction
The existence of gravitationally bound pairs of star clusters is important for the understanding of formation and evolution of star clusters. Since the probability of tidal capture of one cluster by another one is very small (Bhatia et al. 1991), we can assume that the components of a true binary star cluster have a common origin. Star clusters form in giant molecular clouds (GMCs) (e.g. Elmegreen & Elmegreen 1983), but the details of cluster formation are not yet well understood. If the components of a cluster pair or multiple cluster formed simultaneously or sequentially in the same fragmenting GMC they should have similar properties like age, metallicity and stellar content.
In the Milky Way only a few binary clusters are known, though Lyngå & Wramdemark (1984) suggest the common origin of a group of six Galactic open clusters. Later Pavloskaya & Filippova (1989), and more recently Subramaniam et al. (1995), propose the existence of more possible Galactic binary clusters and cluster complexes.
The apparent lack of binary clusters in our own Galaxy may be explained in different ways. Subramaniam et al. (1995) argue that since we are looking at the Galaxy from inside, double clusters may be harder to detect than in the distant Magellanic Clouds, where binary clusters can easily be detected due to the closeness of their projected positions on the sky. The distance to the Galactic clusters must also be taken into account, but only approximately 400 of 1400 open clusters have known distances (Lyngå 1987). Subramaniam et al. (1995) found 16 Galactic binary cluster candidates on the base of the Lyngå catalogue, which corresponds to 8 % of the investigated number of clusters. From this they conclude that binary clusters in the Milky Way may not be uncommon.
The evolution of a gravitationally bound pair of star clusters depends on the interaction between the components as well as on the tidal forces of the parent galaxy. If the tidal field is strong, the binary system will not survive for long but soon will get disrupted. From some preliminary considerations Innanen et al. (1972) conclude that due to stronger tidal forces in the Milky Way a binary cluster will execute only a fraction of a single orbit around the barycentre before its components are detached, but it will survive for several orbits in the less dense, less massive Magellanic Clouds. Surdin (1991) came to the same conclusion, especially for massive clusters. The investigation of binary clusters may help to evaluate the tidal field of the parent galaxy.
Fujimoto & Kumai (1997) suggest that globular and populous star clusters form through strong collisions between massive gas clouds in high-velocity random motion. Shear and momentum of oblique cloud-cloud collisions lead to break-up into compressed sub-clouds revolving around each other, which may form binary or multiple clusters. Binary star clusters are expected to form more easily in galaxies like the Magellanic Clouds with high-velocity random gas motions, whereas in the Milky Way such large-scale high-velocity random motions are lacking.
Bhatia & Hatzidimitriou (1988), Hatzidimitriou & Bhatia (1990), and Bhatia et al. (1991), have surveyed the Magellanic Clouds in order to catalogue the binary cluster candidates. The maximum projected centre-to-centre separation of the components of a pair was chosen to be 18 pc, which corresponds to in the LMC. A binary cluster with larger separation may become detached by the external tidal forces while shorter separations may lead to mergers (Sugimoto & Makino 1989, and Bhatia 1990). In these studies 69 pairs in the LMC and 9 pairs in the SMC were identified. Two clusters may appear to be a binary cluster due to chance line-up while in fact being at different distances within the Magellanic Clouds and not gravitationally bound to each other. The number of chance-pairs of objects uniformly distributed in space can be estimated with a formula presented by Page (1975). Taking into account also a non-uniform distribution of star clusters (at least for the LMC), Bhatia & Hatzidimitriou (1988) and Hatzidimitriou & Bhatia (1990) found that statistically 31 pairs in the LMC and 3 pairs in the SMC could be explained due to mere chance line-up. As considerably more pairs have been found, this strongly suggests that at least a certain amount of them must be true binary clusters.
While it is difficult to measure true distances between apparent binary clusters an analysis of their age and stellar content can give clues to a possible common origin.
The star cluster pair NGC 2006 (also known as SL 537) and SL 538 is located in the northwestern part of the OB association LH 77 in supergiant shell LMC 4, and has a projected centre-to-centre separation of corresponding to 13.3 pc. This double cluster has already been the subject of investigations concerning its binarity. Bhatia (1992) and Bica et al. (1996) found from integrated photometry that both clusters have the same age. Kontizas et al. (1993) analyzed the stellar content and the cores of the components using low resolution objective prism spectra and integrated IUE spectra. They suggested this cluster pair constitutes a true binary cluster, which moreover may merge in some years. This raises another question, which has also been discussed in Bhatia & MacGillivray (1988): could mergers of former binary star clusters be responsible for at least some of the blue populous clusters in the LMC?
We investigated the double cluster NGC 2006 and SL 538 in an attempt to find further affirmation – or disaffirmation – of the binarity of the two clusters. We analyze the star density in the clusters and the surrounding field (Section 3). For the first time we derive ages for these clusters from isochrone fits to colour-magnitude diagrams (CMDs) (Section 4), which is a much more reliable age determination than using integrated photometry. In Section 5 we investigate the content of Be stars in the clusters as well as in the surrounding field. In Section 6 we give a summary and conclusions.
2 The data and the data reduction
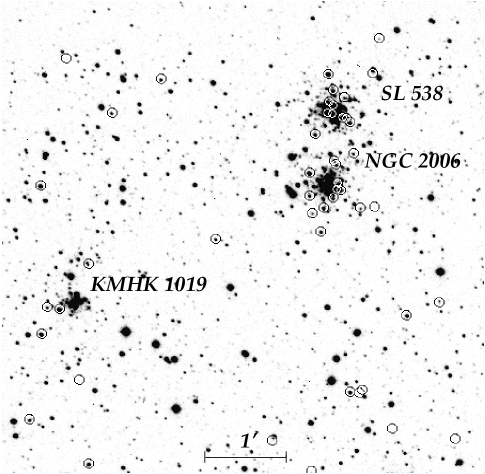
An image of SL 538 and NGC 2006 is shown in Fig. 1. To the south-east of the cluster pair a third star cluster is located: KMHK 1019.
The data have been obtained on 15 December 1992 with EFOSC 2 at the ESO/MPI 2.2 m telescope at La Silla. A coated Thomson THX31156 chip (ESO #19) was used with a pixel scale of resulting in a field of view of . All data were obtained with the standard Bessell , , , Gunn and filters used at the 2.2 m telescope (see Table 1 for an observing log).
After standard image reduction with MIDAS, profile fitting photometry was carried out with DAOPHOT II (Stetson 1991) running under MIDAS.
The photometry was transformed using the Landolt standard fields around PG 0218+029, Rubin 149, and SA 98 (Landolt 1992) observed in the same night.
We applied the following transformation relations:
where is the mean airmass during observation, capital letters represent standard magnitudes and colours, and lower-case letters denote instrumental magnitudes after normalizing to an exposure time of 1 sec. The resulting colour terms , zero points and atmospheric extinction coefficients are:
| Object | Filter | Exp.time | Seeing |
|---|---|---|---|
| [sec] | [\arcsec] | ||
| SL 538/NGC 2006 | 360 | 1.5 | |
| SL 538/NGC 2006 | 90 | 1.5 | |
| SL 538/NGC 2006 | 150 | 1.3 | |
| SL 538/NGC 2006 | 20 | 1.1 | |
| SL 538/NGC 2006 | 150 | 1.3 | |
| SL 538/NGC 2006 | 30 | 1.4 | |
| SL 538/NGC 2006 | Gunn | 180 | 1.3 |
| SL 538/NGC 2006 | Gunn | 20 | 1.3 |
| SL 538/NGC 2006 | 900 | 1.2 |
3 Stellar density in and around the clusters

In order to investigate the stellar surface density distribution in and around the clusters we subdivided the entire area into 52 square cells with 20 pixels (corresponding to ) length each. We counted the number of stars found within each cell. In Fig. 2 (left) one cell corresponds to one pixel of the star density plot. The counting was carried out on the ALLSTAR-output tables, which contain the coordinates of each measured star. We see an enhanced star density between the cluster pair. The apparent stellar bridge between the components contains as many as 25% of the stars counted in each of the clusters. To make density structures and thus the stellar bridge between the two clusters better visible we applied a average filter for image smoothing (see Fig.2, right). Since we expect especially high values in the stellar bridge compared to the surrounding field, a median filter – which does not consider very high or very low pixel values – seems not to be appropriate for our purpose. However, we also tried a median filter and found no differences concerning the features of the resulting images.
No signs of an increased star density reaching from KMHK 1019 towards the binary cluster candidate can be seen.
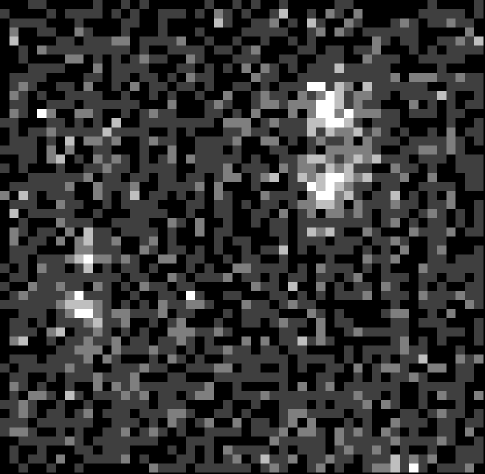
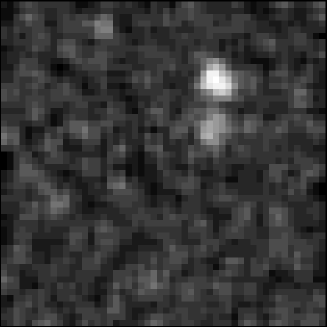
We investigated the statistical probability of seeing such a stellar bridge due to chance density fluctuations. For this purpose we removed all stars outside a 60 pixels radius around the components of the cluster pair and carried out 50 artificial star experiments with ADDSTAR running under DAOPHOT II. Each time we added the same number of stars at random coordinates as had been removed initially. Star density plots were created in the same way as described above. We found 12 plots out of 50 showing larger star density somewhere between – and connecting – the star clusters. In most cases the stellar bridge connecting the components is very thin. Only three plots showed stellar bridges wider than one cell. In Fig. 3 three examples of our artificial star density plots are shown: no bridge, small bridge, and wide bridge. Our artificial star experiments show that in one out of four cases a stellar bridge may occur due to statistical density fluctuations in the field. Thus, the probability of a stellar bridge which is not due to statistical star density fluctuations does not reach a confidence level of 95 %.


4 Deriving ages for the star clusters
We derived ages of the clusters SL 538, NGC 2006, KMHK 1019, and the surrounding field star populations by comparing our CMDs with isochrones. The isochrones we used are based on the stellar models of the Geneva group (Schaerer et al. 1993).
4.1 Age determination


We derived colour-magnitude diagrams (CMDs) of each cluster by cutting out a circular area with a radius of 100 pixels, corresponding to or 8.3 pc, centered on the optical centre of each cluster. To derive the CMDs of KMHK 1019, which is the smallest of the three clusters, we adopted a smaller radius of 80 pixels, corresponding to or 6.6 pc. An estimation by eye based on the star density plot (Fig. 2) suggests that no or almost no cluster stars are outside this area.
All CMDs are plotted in Figs. 5 to 7. Each cluster CMD has a wide blue main sequence and contains very few supergiants. The width of the main sequence is caused in part by photometric errors, crowding (seeing ) and the presence of Be stars (see Sect. 5). The scarcity of supergiants is well within the expected fluctuations for compact clusters with few stars.
Overplotted on the CMDs are the best fitting isochrones. We fitted the isochrones such that the supergiants rather match the blue loops than the quickly traversed subgiant branch. A distance modulus of 18.5 mag (Westerlund 1997) was adopted. The metallicity of the young field population of the LMC was found to be dex by various authors (Russell & Bessell 1989, Luck & Lambert 1992, Russell & Dopita 1992, Thévenin & Jasniewicz 1992). We therefore adopted Geneva isochrones with Z=0.008 which corresponds to dex.
Galactic field stars contaminate our observed area. Ratnatunga & Bahcall (1985) estimate the number of foreground stars towards the LMC, and in Table 2 we present their counts scaled to our total field of view ().
| apparent visual magnitude range | |||||
| colour range | 13-15 | 15-17 | 17-19 | 19-21 | 21-23 |
| 1.3 | 2.9 | 3.1 | 6.4 | 6.0 | |
| 0.5 | 2.6 | 5.4 | 4.3 | 7.4 | |
| 0.1 | 0.6 | 3.7 | 13.1 | 29.3 | |
SL 538: We see two red and one blue supergiant in the , CMD of SL 538. The 16 Myr (solid line) isochrone fits all three supergiants well but also the 20 Myr (dotted line) isochrone fits the red supergiants very well. We adopt an age of Myr. The same age is found from isochrone fits to the , CMD (Fig. 5). All isochrones are based on a reddening of mag.
NGC 2006: Four supergiants are located in this cluster, covering a colour range from to 1.5 mag. Both CMDs (Fig. 5) are fit quite well by isochrones with ages of 20 Myr (solid line) and 25 Myr (dotted line). We adopt an age of 22.5 Myr ( Myr) and a reddening of mag.
KMHK 1019: This cluster by far is the smallest one with the lowest number of stars. Few data points are located in the red clump and the red giant branch (RGB) region, and it is very likely that these stars belong to an intermediate-age field star population, while the supergiants, on which our age determination mainly relies, are located in the cluster centre and thus we assume that they belong to the star cluster. The main sequence is sparse, especially in the upper part brighter than mag. The best fitting isochrones in both CMDs result in an age of 16 Myr (Fig. 7). The reddening of mag is the same for all fits.
The surrounding field: The field population comprises a mixture of ages. Apart from a blue main sequence and blue and red supergiants, which represent the young field populations, the intermediate-age field population of the LMC shows up through red giants and the pronounced red horizontal branch clump. We are not able to distinguish between distinct young populations, but the plotted isochrones represent ages which are supported by corresponding supergiants.
The brightest blue supergiants and some of the brightest red supergiants are represented by the 16 Myr isochrone (solid line). Also the 25 Myr (dotted) and 32 Myr (dashed) isochrones are supported by bright blue, yellow and red supergiants.
Several supergiants are traced by the 80 Myr isochrone. Note that the redder main sequence stars at mag are candidate Be stars (see Sect. 5). One could easily mistake them for more evolved stars marking an additional field population with an age of approximately 100 Myr. The stellar density seems to be lower between 80 Myr and 200 Myr which indicates a possible decrease in the field star formation rate.
Along the 200 Myr isochrone and below, the star density is increased along the subgiant branch, again indicating enhanced star formation.
mag is a lower limit to the reddening of the field star populations and corresponds to the blue envelope of the main sequence(s).
The youngest field population is part of LH 77. Our derived age of approximately 16 Myr is in good agreement with the findings of Braun et al. (1997).
4.2 Comparison to earlier photometry
Our study is the first age determination of SL 538 and NGC 2006 that is based on CMDs. Previous studies derived ages based on surface photometry, using different aperture sizes. Age determinations based on integrated colours are less precise than age determinations based on CMDs: Geisler et al. (1997) investigated the influence of a few bright stars on the integrated light of intermediate age star clusters. They conclude that fluctuations in the number of bright main sequence stars and red giants lead to shifts in the integrated colours, which affect the age determination. In Table 3 we present a comparison to the integrated photometry of Bica et al. (1996), Bhatia (1992) and our results.
Though several authors using surface photometry state that integrated colours and thus the derived ages are largely independent from the aperture radius, Bica et al. (1996) and Bhatia (1992) derived quite different ages for SL 538 and NGC 2006: Bica et al. (1996) used an aperture size of and found NGC 2006 to be the older component of the cluster pair. This is in agreement with our results. In contrast, Bhatia (1992) used an aperture radius of and found SL 538 to be slightly older than NGC 2006. Our CMDs exclude ages as young as suggested by Bhatia’s (1992) aperture photometry. Bica et al.’s (1996) young age of only 0-10 Myr for SL 538 again is clearly excluded by our data, while the wide age range of 10-30 Myr for NGC 2006 includes our result of Myr. Note that Bica et al.’s (1996) apertures are so large that stars belonging to the neighbouring cluster are also included in their measurement.
| reference | aperture size | cluster | age |
|---|---|---|---|
| SL 538 | 0–10 Myr | ||
| Bica et al. (1996) | NGC 2006 | 10–30 Myr | |
| SL 538 | 12.6 Myr | ||
| Bhatia (1992) | NGC 2006 | 7.9 Myr | |
| SL 538 | 18 Myr | ||
| this work | , CMD | NGC 2006 | 22.5 Myr |
5 Be stars in the clusters and the surrounding field

Be stars are non-supergiant B stars with variable Balmer emission and infrared excess originating in circumstellar disks. Rapid rotation and red/infrared excess of Be stars lead to redder colours and widened main sequences (see Grebel et al. 1996). The observed brightness and colour of a rotating (Be) star depend on its rotational velocity and inclination to the line of sight (rotational displacement fan, Collins & Smith 1985).
Using the index to detect stars bright in (R serves as continuum filter) and as a temperature index we can identify Be star candidates (Fig. 8). This method was first described in Grebel et al. (1992, 1993). In Fig. 8 a pronounced clump of data points at mag and mag can be seen. These data points represent blue main sequence stars and blue supergiants without emission. To the red side of this clump, scattered around mag and extended over the whole colour range, stars belonging to the RGB and red supergiants are visible in the two-colour diagram. Red giants and red supergiants can have emission, and indeed some data points are located at higher values (up to mag). Our selection criteria for the candidate Be stars are mag and mag.
The widening of the main sequence of the CMDs due to Be stars can be clearly seen in Figs. 5 to 7, where we marked the Be star candidates with crosses. The effect is most pronounced in since the filter has the highest sensitivity to the infrared excess of Be stars.
In Fig. 1 we marked these stars with circles. Our Be star candidates are concentrated at the location of the components of the cluster pair whereas at the location of KMHK 1019 only two such stars are present.
The impression that the Be star candidates are dominantly present in SL 538 and NGC 2006 is confirmed when considering the ratio of Be stars to B stars. Since we do not have spectral classifications we simply considered the ratio of all B to Be stars within a magnitude interval of to 19.1 mag. These magnitudes correspond to the mean visual magnitudes, at LMC distance, of B 0 III to B 9 V main sequence stars (Zorec & Briot 1991, Table 3). We find the following values:
| SL 538: | |
|---|---|
| NGC 2006: | |
| KMHK 1019: | |
| field: |
The errors are corresponding to Gaussian errors and are calculated using the confidence limits for small number statistics from Gehrels (1986). The components of the double cluster show the same fraction of Be stars, and the sixfold amount found in the surrounding field. The difference between the ratios of SL 538 and the field is which is more than a -effect. The difference between SL 538 and KMHK 1019 is which is less than a -effect according to the upper confidence limit for KMHK 1019. Thus, the Be star content of KMHK 1019 may be comparable to the cluster pair.
6 Summary and Conclusion
Investigating the stellar density around the clusters (see Fig. 2, right) we see no signs of increased star density reaching from KMHK 1019 towards the cluster pair, but we see an enhanced star density between SL 538 and NGC 2006. This may indicate a stellar bridge and thus gravitational interaction between SL 538 and NGC 2006. The stars in the bridge are main sequence stars and thus they may either belong to the cluster “system” or to the young field star populations. However, artificial star experiments showed that a stellar bridge may also be explained (24% probability for a “small” but only 6% probability for a more pronounced bridge) by statistical fluctuations in the field star density.
Fitting Geneva isochrones (Schaerer et al. 1993) to the CMDs we find the following ages: SL 538: Myr, NGC 2006: Myr, KMHK 1019: 16 Myr, youngest field: 16 Myr. The three clusters might have formed sequentially as part of the same GMC that formed LH 77.
Be stars are concentrated in SL 538 and NGC 2006, and both clusters show the same ratio of . This is in agreement with Kontizas et al. (1993) who investigated integrated IUE spectra and the distribution of spectral types of stars and found that both clusters have similar stellar content. Since Be stars are usually rapid rotators this may indicate intrinsically higher rotational velocities in the components of the cluster pair. The amount of Be stars detected in the surrounding field is considerably lower.
An investigation of the IMF of the binary cluster candidate showed that the IMF slopes agree with each other within the errors and are compatible with the Salpeter value (, Salpeter 1955). Our results for the IMF slopes are for SL 538 and for NGC 2006. With these values we estimate the upper limits for the total cluster masses to be (SL 538) and (NGC 2006). The similarity of the cluster masses is in agreement with the findings from Kontizas et al. (1993). Let us assume that the cluster pair indeed is a binary system: Following Kepler’s third law and assuming for the total mass of the binary system and 13.3 pc for the distance between the clusters we get an orbit period of Myr. This would mean that the clusters so far have moved less than half of an orbit since their formation.
The similarity of properties (ages, Be star content, slope of the IMF and masses) indicates possible joint formation and suggests small spatial separation. Our results suggest that SL 538 and NGC 2006 are a true binary cluster, but a final proof is still missing. Radial velocity measurements would help to understand the kinematics of the clusters and may prove or disprove its possible binary nature, but such data are not yet available. If the stellar bridge is real this may imply that the merger process has begun. However, our artificial star experiments showed that we cannot state whether this bridge is real or not.
Acknowledgements.
We would like to thank Prof. H. Elsässer for allocating time at the MPIA 2.2m-telescope at La Silla during which our data were obtained, Antonella Vallenari for introducing AD to the methods of completeness correction, and Klaas S. de Boer and Jörg Sanner for a critical reading of the manuscript. This work was supported by a graduate fellowship of the German Research Foundation (Deutsche Forschungsgemeinschaft – DFG) for AD through the Graduiertenkolleg ‘The Magellanic System and Other Dwarf Galaxies’ (GRK 118/2-96). EKG acknowledges support by H.W. Yorke through grant 05 OR 9103 0 of the German Space Agency (DARA), travel support through GRK 118/2-96, and support by Dennis Zaritsky through NASA LTSA grant NAG-5-3501. This research has made use of NASA’s Astrophysics Data System Abstract Service and of the SIMBAD database operated at CDS, Strasbourg, France.References
- [] Bhatia R. K., 1990, PASJ 42, 757
- [] Bhatia R. K., 1992, Mem. Soc. Astron. Ital. 63, 141
- [] Bhatia R. K., MacGillivray H. T., 1988, A&A 203, L5
- [] Bhatia R. K., Hatzidimitriou D., 1988, MNRAS 230, 215
- [] Bhatia R. K., Read M. A., Hatzidimitriou D., Tritton S., 1991, A&AS 87, 335
- [] Bica E., Claria J. J., Dottori H., Santos J. F. C. Jr., Piatti A. E., 1996, ApJS 102, 57
- [] Braun J. M., Bomans D. J., Will J.-M., de Boer K. S., 1997, A&A 328, 167
- [] Collins G. W., Smith R. C., 1985, MNRAS 213, 519
- [] Elmegreen B., Elmegreen D., 1983, MNRAS 203,31
- [] Fujimoto M., Kumai Y., 1997, AJ 113, 249
- [] Geisler D., Bica E., Dottori H., Claria J. J., Piatti A. E., Santos J. F. C. Jr., 1997, AJ 114, 1920
- [] Gehrels N., 1986, ApJ 303, 336
- [] Grebel E. K., Richtler T., de Boer K. S., 1992, A&A 254, L5
- [] Grebel E. K., Roberts W. J., Will J. M., de Boer K. S., 1993, Space Sci. Rev. 66, 65
- [] Grebel E. K., Roberts W. J., Brandner W., 1996, A&A 311, 470
- [] Hatzidimitriou D., Bhatia R. K., 1990, A&A 230, 11
- [] Innanen K. A., Wright A. E., House F. C., Keenan D., 1972, MNRAS 160, 249
- [] Kontizas E., Kontizas M., Michalitsanos A., 1993, A&A 267, 59
- [] Landolt A. U., 1992, AJ, 104, 340
- [] Luck R. E., Lambert D. L., 1992, ApJS 79, 303
- [] Lyngå G., 1987, Catalogue of open star cluster data
- [] Lyngå G., Wramdemark S., 1984, A&A 132, 58
- [] Page T., 1975, in Stars & Stellar Systems, Vol. 9, p. 541, University of Chicago Press, Chicago
- [] Pavloskaya E. D., Filippova A. A., 1989, SvA 33, 602
- [] Ratnatunga K., Bahcall J., 1985, ApJS 59, 63
- [] Russell S. C., Bessell M. S., 1989, ApJS 70, 865
- [] Russell S. C., Dopita M. A., 1992, ApJ 384, 508
- [] Salpeter E. E., 1955, ApJ 121, 161
- [] Schaerer D., Meynet G., Maeder A., Schaller G., 1993, A&AS 98, 523
- [] Stetson P. B., 1991, 3rd ESO/ST-ECF Garching - Data Analysis Workshop, Grosbøl P. J., Warmels R. H. (eds.), p. 187
- [] Subramaniam, A., Gorti, U., Sagar, R., Bhatt, H. C., 1995, A&A 302, 86
- [] Sugimoto D., Makino D., 1989, PASJ 41, 991
- [] Surdin V. G., 1991, Ap&SS 183, 129
- [] Thévenin F. ,Jasniewicz G., 1992, A&A 266, 85
- [] Westerlund B.E., 1997, ‘The Magellanic Clouds’, Cambridge University Press, Cambridge, UK
- [] Zorec J., Briot D., 1991, A&A 245, 150