Detection of Surface Brightness Fluctuations in NGC 4373 Using the Hubble Space Telescope1
Abstract
Surface brightness fluctuations (SBF) have been detected for three elliptical galaxies—NGC 3379 in the Leo group, NGC 4406 in the Virgo cluster, and NGC 4373 in the Hydra–Centaurus supercluster—using marginally–sampled, deep images taken with the Planetary Camera of the WFPC–2 instrument on the Hubble Space Telescope (HST). The power spectrum of the fluctuations image is well–fit by an empirical model of the point–spread function (PSF) constructed using point sources identified in the field. The previous ground–based SBF measurements for NGC 3379 and NGC 4406 are recovered, thereby demonstrating the capability of the Planetary Camera of WFPC–2 to measure distances using the SBF technique despite the marginal sampling of the images. The residual variance due to unresolved sources in all three galaxies is only 2–5% of the detected fluctuations signal, which confirms the advantage of HST imaging in minimizing the uncertainty of this SBF correction. Extensive consistency checks, including an independent SBF analysis using an alternate software package, suggest that our internal uncertainties are mag. The fluctuations magnitude for NGC 4373 is mag, corresponding to a distance modulus of . This implies a peculiar velocity for this galaxy of km s-1, which is smaller than derived from the – relation. These results demonstrate the power of the post–repair HST to measure distances to elliptical galaxies at significant redshifts using the SBF technique.
1 Introduction
The measurement of surface brightness fluctuations (SBF) in early–type galaxies (Tonry & Schneider (1988); Jacoby et al. (1992)) is an important development in the investigation of the extragalactic distance scale. The rms scatter in galaxy distance measurements is mag, according to a recent, large survey (Tonry et al. (1997)), demonstrating that this technique is an accurate secondary distance estimator. A variety of investigations have followed in the optical (Tonry, Ajhar, & Luppino (1989); Tonry, Ajhar, & Luppino (1990); Tonry & Schechter (1990); Tonry (1991); Simard & Pritchet (1994); Sodemann & Thomsen (1995); Tonry et al. (1997)), near-infrared (Luppino & Tonry (1993); Pahre & Mould (1994); Jensen, Luppino, & Tonry (1996)), and using HST/WFPC–2 (Ajhar et al. (1997); Lauer et al. (1997)).
The velocity field in the Local Supercluster has been mapped for the first time with significant signal–to–noise (S/N) by Tonry (1995) using ground–based SBF. Similar ground-based optical observations at distances greater than or km s-1, however, are limited by the ability to identify the globular cluster system (see Tonry et al. 1990). This is a result of the residual variance contributed by unidentified globular clusters swamping the SBF signal. For this reason, observations at larger distances have utilized the inversion of the method, i.e. removing the stellar SBF signal (due to the galaxy light) in order to study the globular cluster systems from the remaining SBF signal (e.g. Blakeslee & Tonry (1995); Blakeslee (1997)). In order to measure distances of galaxies at km s-1 using the SBF method requires either deep exposures on a very large telescope or substantially–improved resolution (or both) in order to characterize the globular cluster system accurately for each galaxy.
Exploring the local velocity field outside the Local Supercluster will benefit significantly from the improved angular resolution available from the Hubble Space Telescope (HST). To understand the opportunity provided by Wide–Field/Planetary Camera–2 (WFPC–2) for this purpose, the Investigation Definition Team (IDT) has carried out some pilot observations in NGC 4373, an elliptical galaxy in the Hydra–Centaurus supercluster. This galaxy was selected as a good candidate for SBF observations due to its distance, which at km s-1 puts it at or beyond the limit of ground-based optical SBF measurements. Its location in the Centaurus region on the front-side of the “Great Attractor” (e.g. in the models of Lynden-Bell et al. (1988)) makes this galaxy additionally interesting.
It was unknown if the Planetary Camera of WFPC–2 could measure SBF accurately, as the pixel size only marginally–samples the PSF in the relevant filter F814W (roughly corresponding to the –band). In this paper, we will demonstrate the feasibility of measuring SBF using HST by analyzing images of two relatively nearby elliptical galaxies—NGC 3379 in the Leo group and NGC 4406 in the Virgo cluster—and comparing the results with ground–based SBF measurements. Then the SBF analysis will be applied to NGC 4373 to measure its distance, thereby showing the power of HST to extend this secondary distance indicator to larger distances.
2 Data Reductions
Images of galaxy NGC 4373 were obtained through the F814W filter using the WFPC–2 on the HST as part of a GTO program. There were five different exposures taken: s, s, and s. Additional images of galaxies NGC 3379 in the Leo group and NGC 4406 in the Virgo cluster, also taken through the F814W filter, were obtained from the HST archive. All of the data were obtained using the inverse gain of e- DN-1 electronics. The NGC 3379 and NGC 4406 exposures utilized the pipeline processing from the HST archive, while the NGC 4373 were separately processed in a similar way—including ADC correction, bias subtraction, dark subtraction (using super and delta dark frames), and flattening. The frames were then shifted by integer pixel values (to prevent correlating the noise in adjacent pixels) and combined using various cosmic–ray rejection algorithms. There were two separate pointings observed for NGC 4373 that were intentionally offset by an integer number of pixels in order that the images could be reregistered without resampling. The chosen algorithm for combining the images was the STSDAS/CRREJ task, although there was very little difference between the result of this and the IRAF/IMCOMBINE task. The FWHM of the PSF in the final images ranged from pixel for NGC 4373 to pixel for the other two galaxies.
The zero-point used for the subsequent analysis of NGC 4373 was obtained from Holtzman et al. (1995b) for transforming the F814W onto using the color (to be consistent with Ajhar et al. (1997)) produces a calibration of:
| (1) |
where is the integration time. Note that we have not included an additional mag into this calibration (as was done by Ajhar et al. (1997)) since we will normalize the PSF flux to an aperture of arcsec (see § 3.5 below), although this will not affect the final result. Despite the second–order color term that enters into this equation, the resultant zero–point only varies by mag across the relevant range of observed color mag.
The 100m cirrus emission in the region towards and around the three galaxies was obtained for grids centered on the galaxies with arcmin spacing using the IRAS m.eps. Obvious point sources were visually excluded. The conversion to extinction is then
| (2) |
(Laureijs, Helou, & Clark (1994)). The relative extinction was assumed to be (Holtzman et al. 1995b ) and (Cardelli, Blayton, & Mathis (1989)). The extinction derived for NGC 4373 is mag larger than was assumed by Faber et al. (1989).
3 Surface Brightness Fluctuations Analysis
3.1 Fitting a Model to the Galaxies
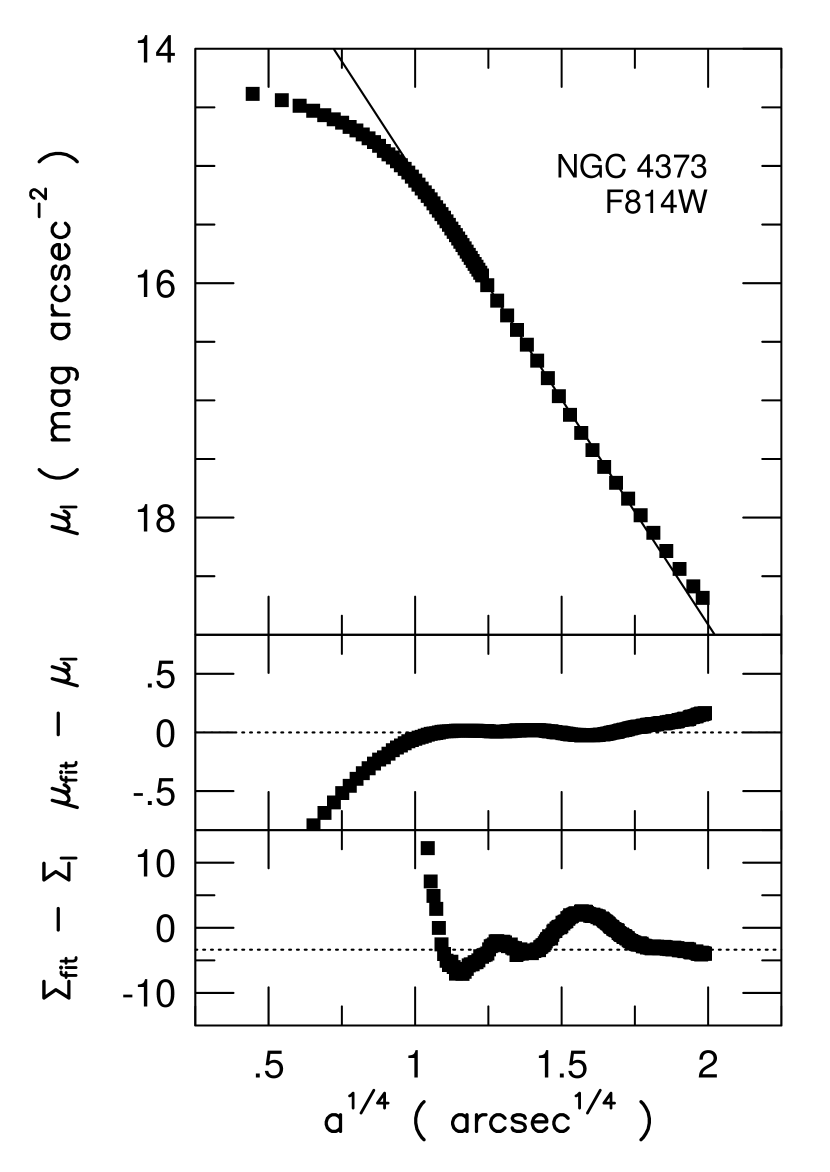
A first estimate of the mean galaxy profile was constructed using the ELLIPSE task in the ISOPHOTE package of STSDAS. For NGC 4373 only, this profile was rebinned at large semimajor axes ( pix) in order to improve the S/N, following the procedure of Djorgovski (1985). The profile was fit to an de Vaucouleurs form at small semimajor axes values ( arcsec) where the estimated ratio of sky to galaxy is % ; this fit was extrapolated to large semimajor axes values to determine the deviation of the profile due to the sky brightness. The surface brightness profile, and the residuals from the model fit, are shown in Figure 2.
The median predicted offset due to the sky brightness was then estimated for the extrapolated region to be e- for the 6500 s exposure, where the uncertainty is the quartile-estimated scatter of the residuals under the assumption that they are normally-distributed. Since it is apparent from Figure 2 that the sky value is clearly a systematic error instead of a random one, comparisons of that sky value with other estimates can offer a more reasonable estimate of the sky subtraction uncertainty. We examined the WF3 stacked image and estimated a sky value of 98 e- in the PC1 image. An estimate of the sky brightness from PC1 images taken with F814W on blank portions of sky (i.e. several high-redshift clusters and deep field galaxy surveys) puts a typical sky brightness at 135–180 e- in 6500 s. Finally, we used a separate data reduction package (see § 3.5 below) to measure the sky value using an extrapolated de Vaucouleurs profile, resulting in a sky value of 198 e-. The first estimate of 153 e- was therefore judged to be reasonable, and this was subtracted from the image itself. A new estimate of the mean galaxy profile was then constructed as before. The other two galaxies, NGC 3379 and NGC 4406, had a ratio of sky to galaxy of 3–5% at (13.7 arcsec). Accurate sky subtraction is relatively unimportant for these galaxies, as the uncertainty of the sky subtraction will enter the fluctuations image as the square–root of the fractional sky contribution to the signal.
A model image was then constructed from this profile using the first through fourth Fourier coefficients of the fit. The model was subtracted from the image to construct the residual image, with semimajor axes between pixels used; the inner limit was chosen to remove nuclear areas that are poorly fit by the elliptical model, while the outer limit was required by the limit of the profile-fitting procedure (the nucleus for NGC 4373 is off–center on the PC1 FOV). There is some large-scale structure remaining in the image, as is typical, since elliptical models are not perfect representations of elliptical galaxy light distributions.
Point-sources were then masked-out in the residual image, which was smoothed on a scale of ten times the PSF (Tonry & Schneider (1988)); this smoothed residual image was then subtracted from the residual image to remove the large-scale structures. As a result of this step in the procedure, the low wavenumbers in the power spectrum are compromised, and will have to be excluded from the fit to the fluctuations variance. Since the PSF size is pixel FWHM, corresponding to a Gaussian width of pixel, this results in a smoothing kernel of pixel for a 512 pixel Fourier Transform (FT). The variance of this smoothing kernel in the power spectra will fall off rapidly becoming negligible at , or in the FT, and hence wavenumbers below this value will be excluded from the fit to the residual variance (see § 3.3).
3.2 Identifying Point Sources
The residual image was then searched for sources using DAOPHOT (Stetson (1987)). The region within pixels presents difficulty for the detection scheme in DAOPHOT, as there is still some residual large-scale structure remaining after the galaxy subtraction. Hence only the region at pix was searched for sources, and will be used in the fluctuations analysis. The threshold was set for , which corresponds roughly to mag for NGC 4373 and mag in the other two galaxies. Experiments were performed with different values of , which demonstrate that the final distance measurement for NGC 4373 is altered by mag in all cases, and mag in most cases. A total of 52, 14, and 8 sources were identified within this annulus for NGC 4373, NGC 4406, and NGC 3379, respectively. The PSF was constructed using the brightest sources detected in this annulus, and was determined to be fit best by an analytical expression of the “lorentz” form. The PSF fit for NGC 4373 is dominated by the brightest source near the top of the frame, which is presumably a foreground galactic star.
The completeness of the detection algorithm was estimated by adding sources back into the residual image using ADDSTAR, and then determining what fraction at a given magnitude are recovered. This procedure was done in detail for NGC 4373, and its results were rescaled for use on the other two galaxies. As will be seen below, the residual variance due to unidentified sources in these residual images is small compared with the variance of the fluctuations in all three galaxies. These simulations suggested that % of sources are recovered in the NGC 4373 image at mag, % at mag, and % at mag. The recovery rate is worse than is expected from the random noise due to the sky brightness, due to the added noise of the galaxy signal and weak, large–scale structures in the residual image.
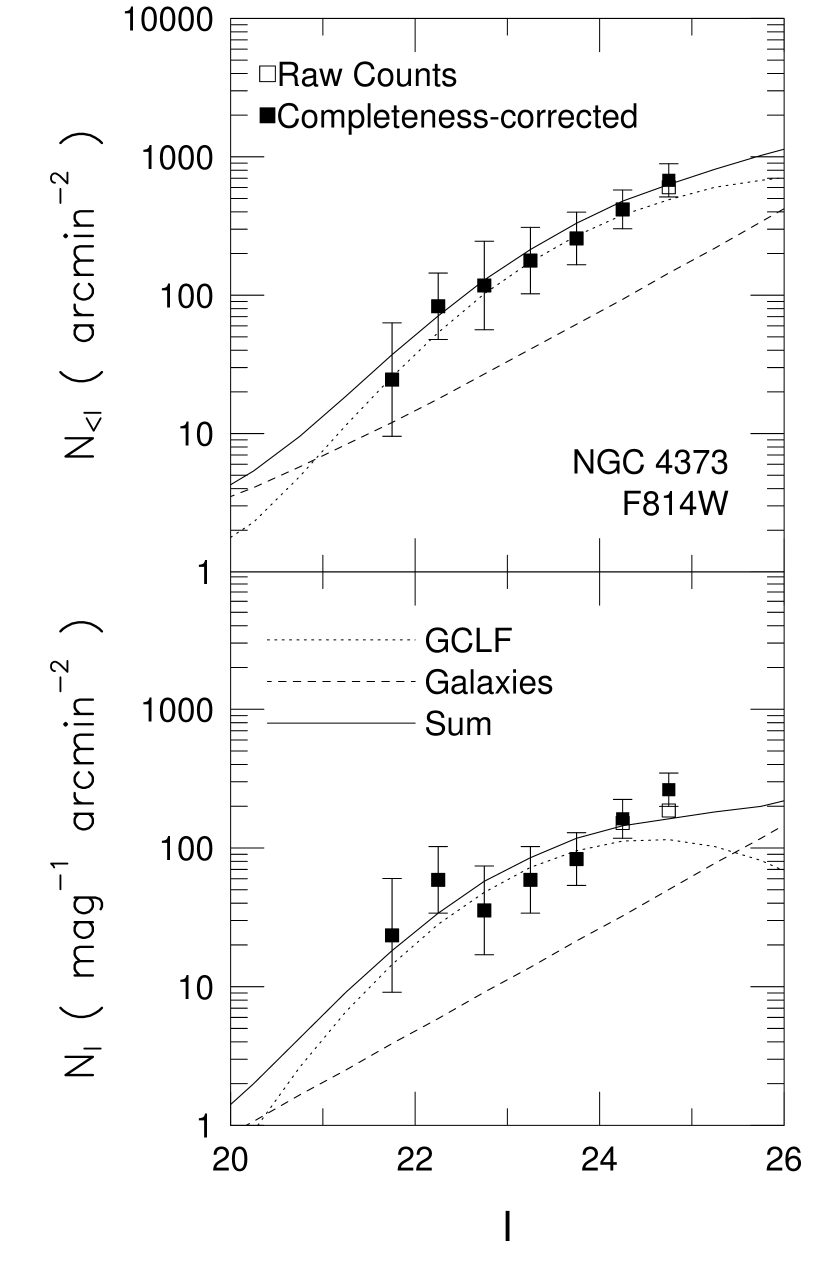
A globular cluster luminosity function (GCLF) was fit to the detected sources simultaneously with the expected number counts of background galaxies. The latter was estimated from WFPC–2 number counts (Cowie, Hu, & Songaila (1995)):
| (3) |
which fits both the ground-based and WFPC2 number counts up to mag. The GCLF was assumed to have a gaussian shape (i.e. ; Harris (1988)) with the center magnitude fixed. The assumed parameters were mag, mag, and for the GCLF.
A relative distance of 2.3 greater than the Virgo cluster was assumed for NGC 4373, while distance moduli of and were assumed for the Virgo cluster and Leo group, respectively. This value for the center magnitude of the GCLF is usually determined by iteration once a first measurement of the distance to the galaxy is complete. As the residual variance due to unidentified sources is quite small (see below), there is little need to iterate to improve these first guesses for the distances. The fit for the GCLF was done using non-linear iteration of the Levenberg-Marquardt Method, as implemented by Press et al. (1986). Convergence was reached rapidly, producing the fitted value for the amplitude of the gaussian. The cutoff for the detected sources was taken as mag for NGC 4373, and mag for the other two galaxies. Uncertainties were included in the fit according to Poisson number statistics, with detected sources ranging between 1 and 12 per mag bin. The detected point sources from DAOPHOT and the fitted GCLF are shown in Figure 3 for NGC 4373.
3.3 Calculating the Fluctuation Signal
The next step in the SBF analysis is to create a mask for the image. All detected sources are masked up to a chosen limiting magnitude mag. Various annuli are also chosen, which here we shall take only pixel, pixel, and pixel, where the semimajor axis is chosen rather than radius in order to construct an annulus of uniform noise. The residual image, with the large-scale structures removed as described above, is then divided by the square-root of the mean galaxy image to normalize the fluctuations in each pixel. This is now the masked fluctuations image.
A bright version of the PSF was constructed from DAOPHOT as described above; it was placed into a copy of each of the masked fluctuations images, in order that the window function used for the fluctuations and the PSF are identical. We compared the results of the above method to an alternate approach (Tonry & Schneider (1988)) of calculating the FT of the window function and introducing this FT separately into the power spectrum of the fluctuations. The differences between these two approaches were found to be negligible.
We note that it is certainly possible to construct a PSF for WFPC–2 images using the “Tiny Tim” package, but we strongly prefer the use of an empirical PSF from the same image as the galaxy as any subtle telescope jitters or defocussing will be accounted for properly. A region of pixels was then extracted from each fluctuations image and PSF image, and the power spectrum is calculated. Circularly–symmetric, azimuthally–averaged radial profiles about wavenumber were then extracted from the power spectra of the fluctuations and the PSF.
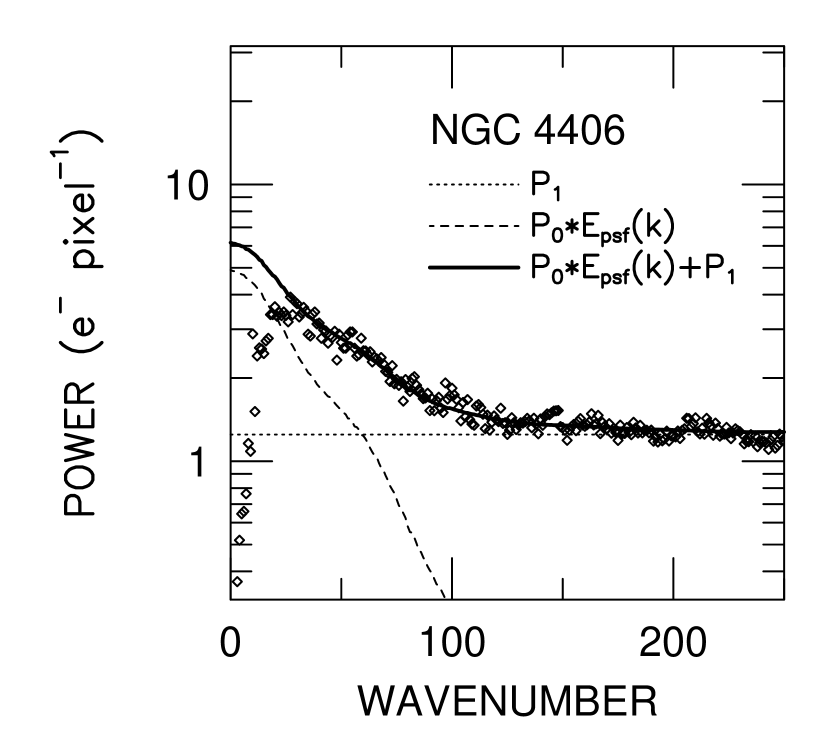
The azimuthally-averaged power spectra for the luminosity fluctuations are weighted by the inverse of the fraction of each image that is nonzero in the mask. The azimuthally-averaged power spectra for the PSF are normalized so that each represents exactly e- within an aperture of pixel arcsec. This is a crucial step, as the calibration of Holtzman et al. (1995b) is normalized for the PSF in a circular aperture of precisely this radius. Thus we can use the zero–point from Holtzman et al. directly via Eq. 1. Each fluctuations power spectrum is represented by:
| (4) |
where represents the multiplicative factor for the PSF that is the distance-dependent fluctuations magnitude, and is the flat power spectrum of the Gaussian “white” noise. A linear least-squares fit is performed to the data for wavenumbers , since a step in the reduction process (noted above) compromises the wavenumbers .
3.4 Removal of Variance Due to Unidentified Sources
The variance expected from point-sources not detected in the residual image must be subtracted individually from each measurement of . By integrating the variance due to undetected sources both brighter than (due to incompleteness) and fainter than using the GCLF measured in § 3.2, the result is the residual variance for each annulus.111While the detection algorithm of DAOPHOT may not be 100% complete in detecting objects in the residual image (Sodemann & Thomsen (1995)), it is 100% complete at detecting peaks in the image and hence the latter are used for the correction of the residual variance. Since the WFPC-2 data are very deep in their removal of point sources, reaching mag at the CL, any incompleteness in detecting these peaks is irrelevant to the calculation of the residual variance. Ground-based imaging, on the other hand, will generally not reach these faint flux limits in the detection of point sources, so the effects of incompleteness in detecting these peaks on the residual variance become relevant at significant cosmological distances (and faint flux limits) and must be estimated carefully. Because the correction for the residual variance due to unidentified sources is small compared to the fluctuation signal, we did not attempt to fit the data in any other method that would not require binning the detected sources. Residual variance due to undetected sources was estimated by following the GCLF and extragalactic number counts to large magnitudes, and the result was found to converge very quickly at mag.
Since there is a limited number of sources detected throughout the entire annulus of pix, it would be very challenging to estimate the GCLF for smaller annuli (i.e. separately for , , etc.). The GCLF is expected to vary with projected radius from the galaxy nucleus, so it is clearly not constant across the entire area. Inspection of the radial dependence of the GCLF in well–studied galaxies (such as Cohen (1988) for NGC 4406) suggests that this effect is virtually negligible for the small range in radii we have studied here. The corrected SBF power is then simply .
3.5 Consistency Checks
A number of consistency checks were investigated for the NGC 4373 data. First, the first wavenumber in the fit was varied between and , since the lowest wavenumbers contribute the largest effect to the minimization routine. Second, was fit for the largest wavenumbers () and fixed to this value; the implied measurement of was then calculated for each individual data–point in the range . Both of these tests suggest that there are no significant individual outliers in the power spectra data, nor are there systematic errors arising from a particular range of wavenumbers. Furthermore, these tests demonstrate that we have identified the appropriate minimum wavenumber for the fits, as lower wavenumbers (at ) show clear systematic differences from the remainder of the power spectra.
The effects of the estimate of the sky value were investigated for NGC 4373, the galaxy for which the uncertainty will be greatest, by using the different estimates described above in § 3.1 above. The extreme estimates of the sky value result in a change of mag in the distance estimate, such that the lower sky value produces the further distance estimate.
The entire fluctuations analysis was repeated using an independent software package, written by J. Tonry and provided to A. Dressler. This package can be considered the “standard” for the field (see Tonry et al. (1997), and references therein), and was used for the ground–based –band distance measurements of galaxies in the Hydra–Centaurus supercluster by Dressler (1993). There are a number of significant differences between the Tonry package and the one we have utilized above. One, the Tonry package finds sources using a modified DOPHOT package (Mateo & Schechter (1989); Schechter, Mateo, & Saha (1993)) that includes the surface brightness fluctuations in the noise model for detecting sources. Two, the completeness at 5 is taken in the Tonry package to be 100%, which was verified in simulations (J. Tonry, private communication); we have explicitly measured the completeness via simulations and account for any incompleteness near in the variance due to unidentified sources (which follows closely the method of Sodemann & Thomsen (1995)). Both of these points, however, are relatively unimportant, as the correction itself for the residual variance is small even for NGC 4373. Three, the Tonry package uses an analytical model fit for the power spectrum of the PSF instead of the power spectrum itself (i.e. a fully empirical PSF) that we have used above. Four, the image regions used for the Tonry package are somewhat different from those used above. Comparisons were therefore made for the identical subregions of the image, namely circular annuli of 32:64 pixels, 64:128 pixels, and 128:256 pixels. Fifth, the Tonry package in this version normalizes the PSF flux to effectively infinite aperture, while our analysis above normalized the PSF flux to unity within a arcsec aperture. Using the encircled energy curves for the F814W filter from Holtzman et al. (1995a), the difference is % in intensity, which we have applied to the Tonry package for the purposes of this comparison.222Ajhar et al. (1997) added a mag term for this same reason in calibrating their SBF analysis using the Tonry package (i.e. their Equation 2). Given the subtle but significant differences between these two analyses of the same image, the differences in are only % for NGC 4373. This is an acceptable systematic error which is substantially smaller than the overall random uncertainties for the SBF method (Tonry et al. (1997)).
3.6 Converting Into Distances
Ajhar et al. (1997) report a calibration of based on detailed comparisons with the large, ground–based study of –band SBF of Tonry et al. (1997). As was shown by Tonry (1991), there exists a dependence of on intrinsic color , which was modelled using simple stellar populations by Worthey (1994). The subsequent primary calibration of the SBF distance scale was determined by Ajhar et al. (1997) to be
| (5) |
The reddening estimates listed in Table 1 are used to convert into for the three galaxies.
There is an additional cosmological correction ought to be applied. The –correction for fluctuations observed in the ground–based –band filter is (Tonry et al. (1997)), which act to brighten the observed magnitudes. We note that SBF magnitudes act as luminosities, not surface brightnesses, hence there is no need for additional SB dimming cosmological corrections. Furthermore, the broadband color needs to be made bluer by . Since these two effects nearly cancel each other in Equation 5, the possible systematic error on the distance modulus for NGC 4373 implied by not making these corrections is only mag, which is comparable to the uncertainties of the –corrections themselves (and their applicability to the F814W filter). For this reason, –corrections were not applied in the photometric calibration.
4 Results
4.1 NGC 3379 in the Leo Group
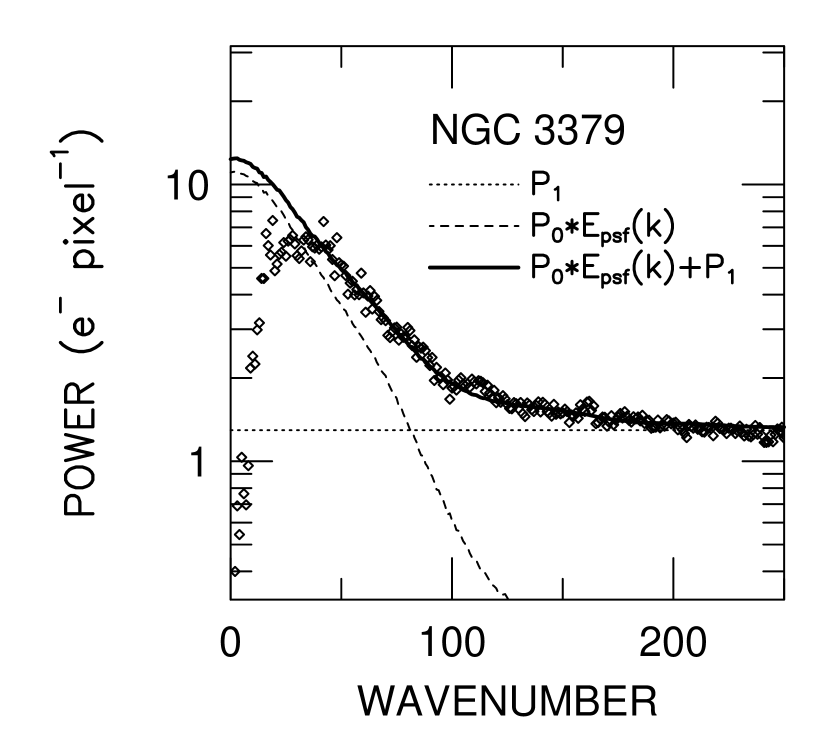
The fit for the intermediate annulus ( pixel) in NGC 3379 is displayed in Figure 4, and the fits for , , and are listed in Table 2. For the three annuli, the mean value after correction for the residual variance due to unmasked sources is e- in the 1340 s exposure, where the uncertainty reflects the scatter among the three measurements divided by . An estimate of the signal–to–noise of a fluctuations measurement is provided by the ratio , which we measure to range between and for these annuli.
While the results listed in Table 2 suggest that there might be evidence for radial gradients for our measurements, we caution against this interpretation without a more thorough investigation of the HST images of this galaxy for all possible radii obtainable with the PC array. We have merely chosen to analyze NGC 3379 for only those three annuli identical to those used for NGC 4373 below, as a comparison sample. The scatter among the three individual measurements listed in Table 2 is mag, which is comparable to the scatter in among the entire SBF survey of Tonry et al. (1997) of mag. Thus, if a gradient exists it would only be significant at the CL. An opposite gradient in was detected by Sodemann & Thomsen (1995) for NGC 3379, although for annuli at much larger radii ( to arcsec) than we have studied here. An extrapolation of their results implies that we should detect a brightening in of only mag between the innermost and outermost annuli in the PC image. A color gradient in but not was detected by Peletier, Valentijn, & Jameson (1990), so it is unclear if a gradient in should be expected on the basis of color gradients in NGC 3379. Errors in sky subtraction are not nearly large enough to cause the observed effect (see § 3.1). Finally, we note that the outermost annulus had a disproportionate number of identified points sources compared to the other annuli, which could cause a subtle measurement bias. More detailed study is required if a fluctuations gradient is to be inferred from the data.
The mean measurement for the fluctuations magnitude for NGC 3379 is mag (after correcting for Galactic extinction) which results in a distance modulus of mag through application of Equation 5. The uncertainty estimate in only represents three uncertainties: the scatter between the measurements for the different regions of the image ( mag), the stability of the WFPC–2 zero–point for F814W of mag (Ajhar et al. (1997)), and the 14% uncertainty in the conversion between IRAS 100m flux and extinction. The uncertainty estimate for includes the uncertainty of mag for , the uncertainty of mag for the fit between and , and mag to allow for cosmic scatter (Tonry et al. (1997)). Our measurement of agrees with the value of from the Tonry et al. (1997) ground–based SBF survey, as quoted by Ajhar et al. (1997). It is somewhat nearer, however, than the value derived independently from the WFPC–2 data by Ajhar et al. (significant at the CL after correction for the different assumptions of Galactic extinction).
4.2 NGC 4406 in the Virgo Cluster
The fit for the intermediate annulus ( pixel) in NGC 4406 is displayed in Figure 5, and the fits for , , and are listed in Table 2. The scatter among the different annuli is remarkably small, with no evidence for a radial dependence for . As this exposure time was similar to that of NGC 3379, but this galaxy is in the more distant Virgo cluster, the S/N is poorer, ranging between and . Nonetheless, the small scatter among the annuli suggests that there are no systematic biases entering into these data as a function of .
The mean measurement for the fluctuations magnitude for NGC 4406 is mag (corrected for Galactic extinction) which results in a distance modulus of . The uncertainties were estimated in the same manner as for NGC 3379 in § 4.1 above. This distance modulus agrees with the value mag with the Tonry et al. (1997) ground–based SBF measurement as quoted by Ajhar et al. (1997).
4.3 NGC 4373 in the Hydra–Centaurus Supercluster
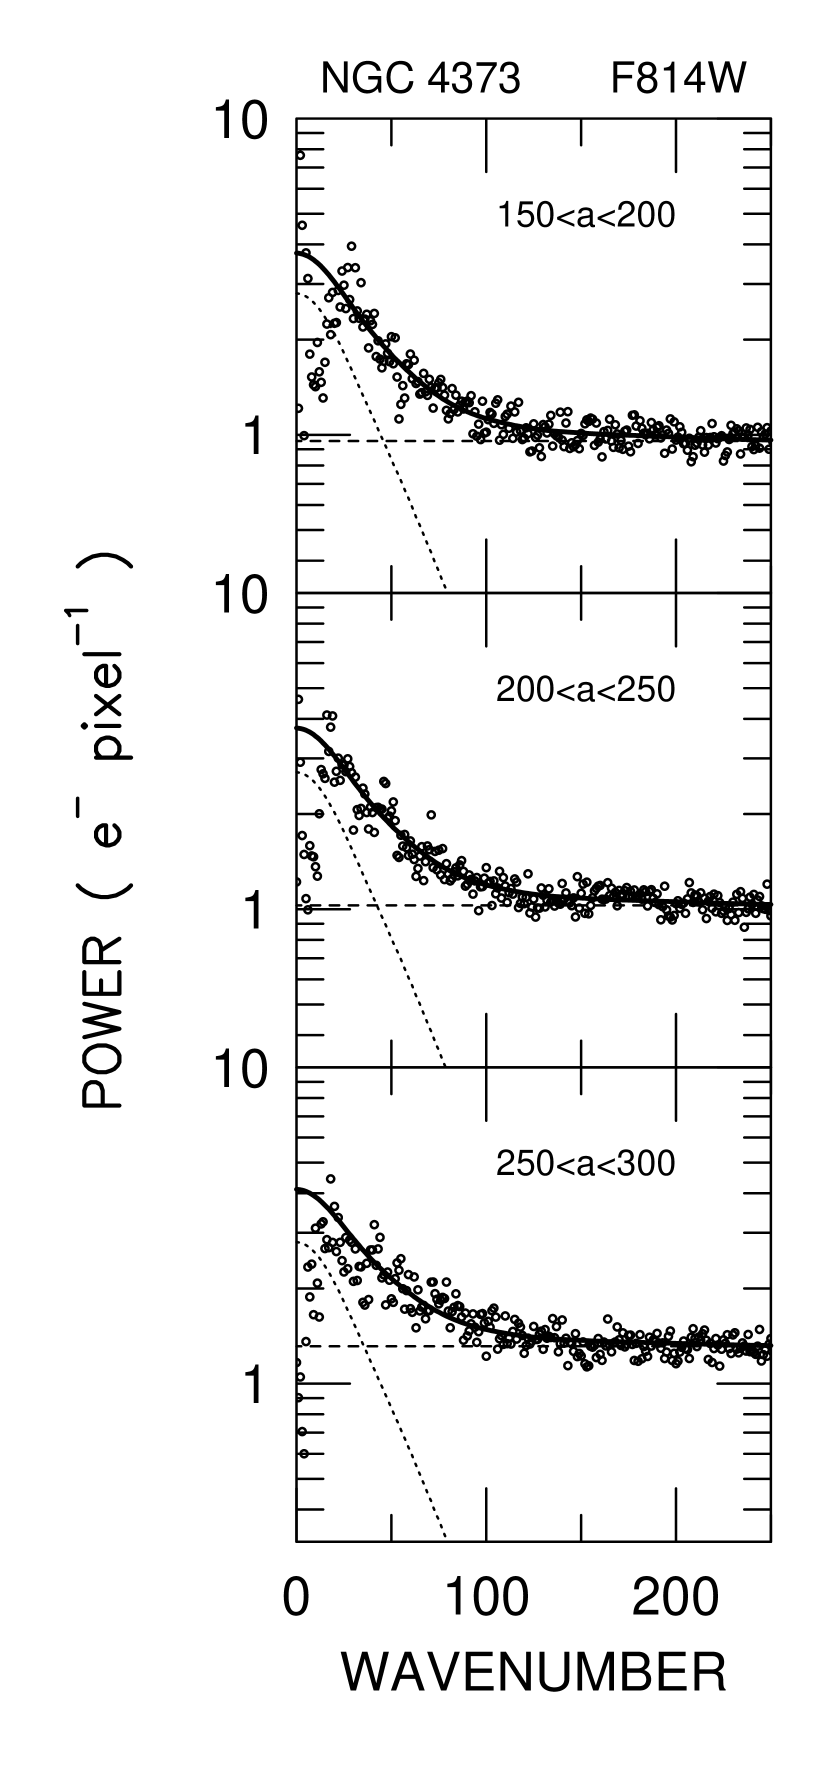
The fits to each of the three annuli are displayed in Figure 6, and the results are listed in Table 2. The results from the three annuli that are mutually consistent at the mag level. This exposure was longer (6500 s) than either of the other two galaxies, but is further in distance, hence the S/N is comparable to the best of NGC 4406, i.e. to .
The mean measurement for the fluctuations magnitude for NGC 4373 is mag (corrected for Galactic extinction) which results in a distance modulus of . Once again, the uncertainties are estimated as described in § 4.1, with an additional mag added due to sky–subtraction uncertainties that are not relevant for the other two galaxies.
Dressler et al. (1997, in preparation) have made new measurements of the distances to Hydra–Centaurus galaxies using ground–based SBF data obtained under excellent seeing conditions. Preliminary results described by Dressler (1993) for NGC 4373 were obtained with relatively poor seeing ( arcsec FWHM) compared to the newer data ( arcsec FWHM), hence these new measurements supersede the older ones. Using the calibration of Tonry et al. (1997) for these new ground–based data and the same extinction as listed in Table 1, the preliminary distance modulus is , in excellent agreement with the value derived from the WFPC–2 observations.
Peculiar velocities should be calculated relative to the baseline expansion rate of km s-1 Mpc-1 derived by Tonry et al. (1997) from their SBF database, since their study was used in the present paper for the calibration of .333The Ajhar et al. (1997) SBF calibration for HST filter F814W was done directly onto the Tonry et al. (1997) system by assuming the distance moduli for each galaxy from the latter study. Hence the two are equivalent for our purpose. Taking the velocity of the NGC 4373 group with respect to the CMB as km s-1 (Faber et al. (1989)), then the distance modulus of suggests that NGC 4373 possesses a peculiar velocity of km s-1 with respect to the CMB. Alternatively, the ratio of distances between NGC 4373 and NGC 4406 can be compared to the ratio of the CMB relative velocities of the NGC 4373 group and the Virgo cluster (included in Table 1) to calculate a peculiar velocity for NGC 4373. This separate calculation yields a peculiar velocity of km s-1. The cause of the difference between these two estimates of is the somewhat high value of the cosmological redshift in the CMB frame for the Virgo cluster ( km s-1, from Faber et al. (1989)); taking the SBF value of this quantity ( km s-1, from Tonry (1995)) results in km s-1. We adopt the value of km s-1, as it does not require the assumption of the CMB velocity of the Virgo cluster from the – relation.
5 Discussion
5.1 Feasibility of SBF With HST
This paper represents the detection of surface brightness fluctuations in images taken with the WFPC–2 instrument on HST. The images are marginally sampled, or slightly under–sampled, even using the Planetary Camera. Nonetheless, we have demonstrated that the fluctuations signal is strong with only a modest exposure time at a distance of the NGC 4373 group in the Hydra–Centaurus supercluster.
The measurements of in NGC 3379 and NGC 4406 agree well with ground–based measurements, suggesting that there are no substantial systematic offsets between the marginally–sampled HST SBF data and the oversampled ground–based work at uncertainties of less than 10% in distance. The Planetary Camera of HST is thus a potentially powerful tool for measuring distances using the SBF method.
The removal of point sources (foreground stars and globular clusters) and background galaxies is straightforward. The estimation of the residual variance due to other undetected globular clusters and galaxies is robust, and the correction implied is quite small, typically 2–4%. This is due to the combination of the depth afforded by the high–resolution imaging power of HST, and by the small projected areas that have been studied here. Ground–based imaging typically utilizes a much larger FOV for the calculation of , resulting in a larger number of undetected objects that must be removed from the SBF signal.
Estimating foreground Galactic extinction is an important element of SBF work with HST, as the slope of the dependence of on is 6.5. This causes errors in the distance modulus to be , which might seem surprising since the SBF observations are made at nm. The minimal effect of –corrections on , however, does provide a reduction in additional sources of uncertainty.
5.2 The Distance to NGC 4373
Our distance measurement to NGC 4373 ought to be more accurate than ground–based work due to the greater confidence at which we can estimate . Experiments with varying values of and the S/N for detecting such sources suggests that the possible variations in are % of . Comparison of two different SBF analysis packages suggests that the systematic errors due to methodology are % in distance, possibly much less if we account for differences in the normalization of the PSF and sky subtraction.
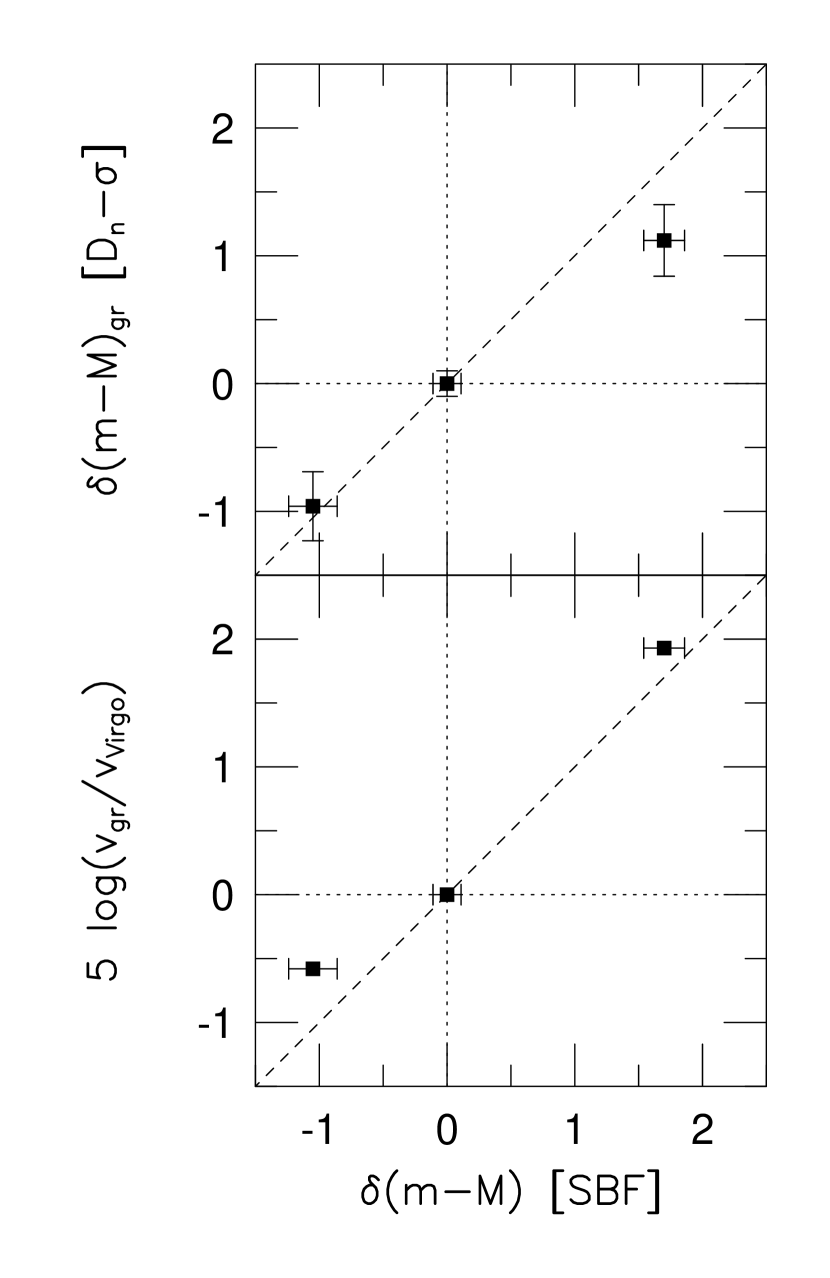
The distance we estimate for NGC 4373 implies a smaller peculiar velocity than has been measured previously. A comparison of the SBF distance estimates with those of the – relation (Faber et al. (1989)) and the group velocities (with respect to the CMB) are shown in Figure 7, where the distances and velocities have been calculated relative to the Virgo cluster. The source of the large peculiar velocity of the Hydra–Centaurus supercluster is shown by POTENT m.eps as a mass concentration at a redshift of 4500 km/sec (Dekel (1995)). The model for the velocity flows in this direction based on – observations (Lynden-Bell et al. (1988)) predicts a peculiar velocity of 838 km s-1 for NGC 4373. Based on Tully–Fisher distance measurements of clusters in the Hydra–Centaurus region, however, Aaronson et al. (1989) and Mould et al. (1991) measured the median value of the peculiar velocity flow to be 489 and 610 km s-1, respectively. Our measured peculiar velocity of km s-1 for NGC 4373 is therefore in better agreement with the values derived from the Tully–Fisher method, although the measurement is only in marginal conflict with the model based on the – data. We note that the peculiar velocity to the NGC 4373 group might be somewhat larger if IC 3370 and NGC 4373A are closer than NGC 4373, as implied by the ground–based SBF results of Dressler (1993), although this result ought to be reinvestigated using observations obtained in better seeing conditions.
It is clear from this simple analysis that more SBF measurements of distances, both ground–based and HST, should be attempted to understand better the velocity flows in the Hydra–Centaurus region.
| Galaxy | t | |||||||||
|---|---|---|---|---|---|---|---|---|---|---|
| (km s-1) | (MJy sr-1) | (mag) | (mag) | (mag) | (mag) | (mag) | (s) | (mag) | (mag) | |
| (1) | (2) | (3) | (4) | (5) | (6) | (7) | (8) | (9) | (10) | (11) |
| NGC 3379 | 1142 | 2.3 | 0.164 | 0.049 | 0.079 | 1.261 | 1.212 | 1340 | 28.81 | 30.14 |
| NGC 4406 | 1493 | 2.4 | 0.171 | 0.051 | 0.082 | 1.257 | 1.206 | 1500 | 29.83 | 31.20 |
| NGC 4373 | 3625 | 6.7 | 0.479 | 0.144 | 0.229 | 1.302 | 1.158 | 6500 | 31.31 | 32.99 |
Note. — Column (2) is from Faber et al. (1989). The colors for NGC 3379 and NGC 4406 are taken from Ajhar et al. (1997) and corrected to match the extinction in column (5), while for NGC 4373 is taken from Dressler et al. (in preparation). Measurements of in column (11) are taken from Table 2 along with the correction for Galactic extinction from column (6).
| Galaxy | Annulus | ||||||
|---|---|---|---|---|---|---|---|
| (pixel) | (e- pix-1) | (e- pix-1) | (e- pix-1) | (e- pix-1) | (mag) | (mag) | |
| NGC 3379 | 150:200 | 11.81 | 1.56 | 0.04 | 11.77 | 28.80 | 0.02 |
| 200:250 | 11.16 | 1.30 | 0.05 | 11.11 | 28.86 | 0.04 | |
| 250:300 | 9.68 | 2.64 | 0.05 | 9.63 | 29.02 | 0.04 | |
| mean | 10.83 | 28.89 | 0.11 | ||||
| NGC 4406 | 150:200 | 4.68 | 1.22 | 0.04 | 4.64 | 29.93 | 0.05 |
| 200:250 | 4.88 | 1.25 | 0.05 | 4.83 | 29.89 | 0.02 | |
| 250:300 | 4.78 | 4.40 | 0.06 | 4.72 | 29.91 | 0.05 | |
| mean | 4.73 | 29.91 | 0.02 | ||||
| NGC 4373 | 150:200 | 4.61 | 0.96 | 0.05 | 4.56 | 31.54 | 0.02 |
| 200:250 | 4.57 | 1.03 | 0.06 | 4.51 | 31.56 | 0.05 | |
| 250:300 | 4.75 | 1.31 | 0.08 | 4.67 | 31.52 | 0.04 | |
| mean | 4.58 | 31.54 | 0.02 |
References
- Aaronson et al. (1989) Aaronson, M., et al. 1989, ApJ, 338, 654
- Ajhar et al. (1997) Ajhar, E. A., Lauer, T. R., Tonry, J. L., Blakeslee, J. P., Dressler, A., Holtzman, J. A., & Postman, M. 1997, AJ, 114, 626
- Blakeslee & Tonry (1995) Blakeslee, J. P., & Tonry, J. L. 1995, ApJ, 442, 579
- Blakeslee (1997) Blakeslee, J. P. 1997, ApJ, 481, L59
- Cardelli, Blayton, & Mathis (1989) Cardelli, J. A., Clayton, G. C., & Mathis, J. S. 1989, ApJ, 345, 245
- Cohen (1988) Cohen, J. G. 1988, AJ, 95, 682
- Cowie, Hu, & Songaila (1995) Cowie, L. L., Hu, E. M., & Songaila, A. 1995, AJ, 110, 1576
-
Dekel (1995)
Dekel, A. 1995, Proceedings of the Heron Island Workshop
on Peculiar Velocities in the Universe,
http://qso.lanl.gov/~heron/ - Djorgovski (1985) Djorgovski, S. 1985, Ph.D. Thesis, UC Berkeley
- Dressler (1993) Dressler, A. 1993, in Cosmic Velocity Fields, Proceedings of the 9th IAP Astrophysics Meeting, eds. F. R. Bochet & M. Lachièze–Rey (Gif–sur–Yvette: Editions Frontieres), 9
- Faber et al. (1989) Faber, S. M., Wegner, G., Burstein, D., Davies, R. L., Dressler, A., Lynden–Bell, D., & Terlevich, R. J. 1989, ApJS, 69, 763
- Harris (1988) Harris, W. E. 1988, in The Extragalactic Distance Scale, ed. S. v. d. Bergh & C. J. Pritchet, 231
- (13) Holtzman, J., et al. 1995a, PASP, 107, 156
- (14) Holtzman, J. A., Burrows, C. J., Casertano, S., Hester, J. J., Trauger, J. T., Watson, A. M., & Worthey, G. 1995b, PASP, 107, 1065
- Jacoby et al. (1992) Jacoby, G. H., et al. 1992, PASP, 104, 599
- Jensen, Luppino, & Tonry (1996) Jensen, J. B., Luppino, G. A., & Tonry, J. L. 1996, ApJ, 468, 519
- Lauer et al. (1997) Lauer, T. R., Tonry, J. L., Postman, M., Ajhar, E. A., & Holtzman, J. A. 1997, ApJ, in press
- Laureijs, Helou, & Clark (1994) Laureijs, R. J., Helou, G., & Clark, F. O. 1994, in Proceedings of The First Symposium on the Infrared Cirrus and Diffuse Interstellar Clouds, ASP Conf. Ser. Vol. 58, eds. R. M. Cutri & W. B. Latter (San Francisco, ASP), 133
- Luppino & Tonry (1993) Luppino, G. A., & Tonry, J. L. 1993, ApJ, 410, 81
- Lynden-Bell et al. (1988) Lynden–Bell, D., Faber, S. M., Burstein, D., Davies, R. L., Dressler, A., Terlevich, R. J., & Wegner, G. 1988, ApJ, 326, 19
- Mateo & Schechter (1989) Mateo, M., & Schechter, P. L. 1989, in First ESO/ST–ECF Data Analysis Workshop, eds. P. J. Grosbøl, F. Murtagh, & R. H. Warmels (Garching: ESO), 69
- Mould et al. (1991) Mould, J. R., Han, M., Roth, J., Staveley–Smith, L., Schommer, R. A., Bothun, G. D., Hall, P. J., Huchra, J. P., Walsh, W., & Wright, A. E. 1991, ApJ, 383, 467
- Pahre & Mould (1994) Pahre, M. A., & Mould, J. R. 1994, ApJ, 433, 567
- Peletier et al. (1990) Peletier, R. F., Valentijn, E. A., & Jameson, R. F. 1990, A&A, 233, 62
- Press et al. (1986) Press, W. H., Flannery, B. P., Teukolsky, S. A., & Vetterlin, W. T. 1986, Numerical Recipes (Cambridge: Cambridge Univ. Press)
- Schechter, Mateo, & Saha (1993) Schechter, P. L., Mateo, M., & Saha, A. 1993, PASP, 105, 1342
- Simard & Pritchet (1994) Simard, L., & Pritchet, C. J. 1994, AJ, 107, 503
- Sodemann & Thomsen (1995) Sodemann, M., & Thomsen, B. 1995, AJ, 110, 179
- Stetson (1987) Stetson, P. B. 1987, PASP, 99, 191
- Tonry & Schneider (1988) Tonry, J., & Schneider, D. P. 1988, AJ, 96, 807
- Tonry, Ajhar, & Luppino (1989) Tonry, J. L., Ajhar, E. A., & Luppino, G. A. 1989, ApJ, 346, L57
- Tonry, Ajhar, & Luppino (1990) Tonry, J. L., Ajhar, E. A., & Luppino, G. A. 1990, AJ, 100, 1416
- Tonry & Schechter (1990) Tonry, J. L., & Schechter, P. L. 1990, AJ, 100, 1794
- Tonry (1991) Tonry, J. L. 1991, ApJ, 373, L1
-
Tonry (1995)
Tonry, J. L. 1995, Proceedings of the Heron Island Workshop
on Peculiar Velocities in the Universe,
http://qso.lanl.gov/~heron/ - Tonry et al. (1997) Tonry, J. L., Blakeslee, J. P., Ajhar, E. A., & Dressler, A. 1997, ApJ, in press
- Worthey (1994) Worthey, W. 1994, ApJS, 95, 107