Abstract
We have constructed a full-sky map of the far-infrared suitable for measuring Galactic reddening and extinction ([9]: SFD). The SFD map is based upon extensive re-analysis of data from the COBE/DIRBE and IRAS satellite missions. We demonstrate that the maps can correct for extinction problems in the APM galaxy survey. We also determine the most dust-free regions for conducting cosmic microwave background or soft X-ray experiments of extragalactic objects.
Application of SFD Dust Maps to Galaxy Counts and CMB Experiments
1Princeton University, Dept. of Astrophysical Sciences,
Princeton, NJ 08544 USA
2University of Durham, Dept. of Physics, South Road, Durham DH1 3LE UK
3University of California, Dept. of Astronomy, Berkeley, CA 94720 USA
1 Introduction
Dust in the Milky Way is a pernicious contaminant to many extra-galactic observations. These dust grains absorb and scatter UV and optical light, both extincting and reddening extragalactic objects. At microwave frequencies, the dust emits radiation that contaminates studies of the cosmic microwave background (CMB).
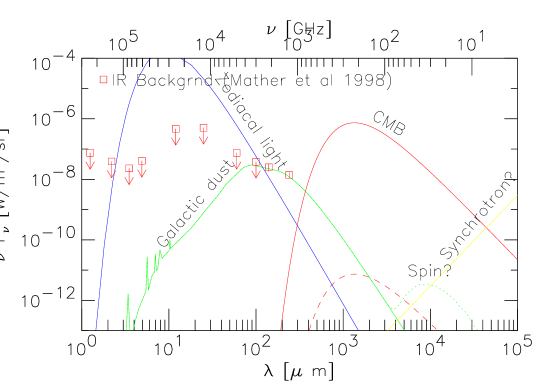
The different components of radiation in the night sky from near-infrared through microwaves are shown in Figure 1. The Galactic dust spectrum is significantly non-thermal at wavelengths due to stochastic heating of very small grains (VGSs) [4]. At wavelengths , the dust spectrum is well-fit by a thermal spectrum. The typical color temperature of this dust is for an emissivity law.
We have fit the Galactic dust temperature and column depth using the emission at and as measured by DIRBE. The dust emission marginally exceeds all other sources of emission at these wavelengths.
2 Generating the Dust Map
Our Galactic dust map is based upon extensive re-analysis of data from the COBE/DIRBE [1] and IRAS [7] satellite missions. Accurately determining the column of the diffuse Galactic dust emission would not have been possible before the COBE satellite flew in 1989. The COBE/DIRBE instrument mapped the entire sky from to with excellent controls of artifacts, zero-points, and calibrations. The older IRAS data does have the one benefit of superior angular resolution ( as compared to ) for of the sky at . We combine the DIRBE and IRAS maps in such a manner as to achieve a resolution of while maintaining the DIRBE zero-point and calibration.
The major difficulty is decoupling the dust emission from zodiacal light
and the cosmic IR background (see Figure 1).
Details of our methods can be found in Schlegel, Finkbeiner & Davis
([9]: SFD).
The maps and associated software have been made freely available at
http://astro.berkeley.edu/davis/dust/index.html
http://astro.princeton.edu/schlegel/dust/index.html
3 Measuring Reddening
3.1 Calibrating the Map
We have computed the column density of dust as the amount of emission expected if all the dust were at the same reference temperature (). We then normalize the amplitude of reddening per unit of flux. Our reddening estimates can be written as
| (1) |
where is the point source-subtracted IRAS-resolution map, is the temperature-correction map, and we seek the calibration coefficient . The reddening of external galaxies allows the most straightforward calibration of . For a sample of 389 galaxies provided by Dave Burstein, we have measured .
3.2 Correcting APM Magnitudes
The APM galaxy survey [6] has measured photometric properties for 3 million galaxies. The original survey region (, ) was chosen to be in a very clean part of the sky. We have shown previously ([8]; [5]) that the scientific conclusions from this region, such as the galaxy-galaxy correlation function, are not affected by Galactic extinction. However, the full survey includes 84 plates at lower latitudes () that are subject to extinction problems.
Figure 2 plots the APM galaxy counts (dotted line) versus the reddening as predicted by SFD in a magnitude slice . The galaxy counts drop off with reddening as one would predict (solid line). Given the positions and magnitudes for each of the 3 million galaxies, we have attempted to correct the measured magnitudes individually for each galaxy. If we then re-select galaxies in the same magnitude slice, the correlation with reddening has been almost entirely removed (dashed line). Attempting such photometric corrections with the BH maps does not remove the correlation (dot-dash line).

4 Dust-Free Regions?
We find most of the sky to have a measurable column density of dust. At high Galactic latitudes (), we find far-IR emission corresponding to a median reddening of or an extinction of . This disagrees with the claim by Burstein & Heiles [3] that these high-latitude zones have zero reddening.
We do find regions in the Southern hemisphere that have dust columns four times lower than the high-latitude average and two times lower than the Lockman hole. These regions, near , (see Table 1) should be prized zones for CMB or soft X-ray measurements. Note that 21-cm data does not exist to confirm that these zones are also H I minima.
The north celestial pole is a particularly poor region for conducting CMB experiments. Across this pole extends the Polaris Flare, which is both dusty and colder than the surrounding medium. Because it is colder, we expect its mm-wave emission to be larger than one would estimate from its flux.
| H I | Comments | |||||
| (hr) | (deg) | (deg) | (deg) | () | () | |
| 0 28 | -42 44 | 318.4 | -73.7 | 0.35 | … | |
| 0 51 | -27 08 | 0.0 | -90.0 | 0.79 | 15.5 | SG pole |
| 3 57 | -48 50 | 257.1 | -48.4 | 0.33 | … | |
| 3 59 | -42 47 | 248.0 | -49.2 | 0.30 | … | |
| 4 01 | -34 25 | 235.2 | -49.1 | 0.20 | … | |
| 4 03 | -37 37 | 240.0 | -48.6 | 0.17 | … | |
| 4 05 | -35 50 | 237.4 | -48.2 | 0.20 | … | |
| 4 44 | -53 20 | 261.3 | -40.2 | 0.23 | … | |
| 10 36 | +56 38 | 152.7 | 52.0 | 0.29 | 4.4 | |
| 10 48 | +57 02 | 150.5 | 53.0 | 0.44 | 5.8 | Lockman hole |
| 12 51 | +27 08 | 0.0 | 90.0 | 0.66 | 10.1 | NG pole |
| 13 35 | +39 09 | 88.4 | 74.9 | 0.27 | 8.6 | |
| 13 42 | +40 30 | 88.0 | 73.0 | 0.27 | 8.5 | |
| 13 44 | +57 04 | 109.2 | 58.6 | 0.28 | 10.3 | |
| 13 54 | +41 33 | 85.2 | 70.6 | 0.29 | 9.1 | |
| 14 10 | +39 33 | 75.3 | 69.5 | 0.29 | 7.2 | |
| 22 43 | -46 49 | 346.3 | -58.1 | 0.41 | … | |
| 23 22 | -46 22 | 339.4 | -64.0 | 0.38 | … |
References
- [1] Boggess, N. W. et al. 1992, ApJ , 397, 420
- [2] Burstein, D., & Heiles, C. 1978, ApJ , 225, 40 [BH]
- [3] Burstein, D., & Heiles, C. 1982, AJ , 87, 1165
- [4] Draine, B. T., & Anderson, N. 1985, ApJ 292, 494 ApJ , 500, 525
- [5] Finkbeiner, D. P., Schlegel, D., & Davis, M. 1997, IAU Colloquium 166 The Local Bubble and Beyond, Garching, April 1997
- [6] Maddox, S.J., Sutherland, W.J., Efstathiou, G., & Loveday, J. 1990b, MNRAS , 243, 692
- [7] Neugebauer, G. et al. 1984, ApJ 278, L1
- [8] Schlegel, D. J. 1995, Ph.D. thesis, University of California at Berkeley
- [9] Schlegel, D. J., Finkbeiner, D. P., & Davis, M. 1998, ApJ , 500, 525 [SFD]