Structure and kinematics of the peculiar galaxy NGC 128. ††thanks: Based on observations taken at ESO La Silla and at the Special Astrophysical Observatory (SAO) of the Russian Academy of Sciences (RAS).
Abstract
This is a multiband photometric and spectroscopic study of the peculiar S0 galaxy NGC~128. We present results from broad ( and ) and narrow (H) band optical CCD photometry, near (NIR) and far (FIR) infrared observations, long slit spectroscopy, and Fabry-Perot interferometry (CIGALE).
The peculiar peanut shape morphology of the galaxy is observed both at optical and near-infrared wavelengths. The stellar disk is thick and distorted (arc-bended), with a color asymmetry along the major axis due to the presence of a large amount of dust, estimated through NIR and FIR data of , in the region of interaction with the companion galaxy NGC~127.
The color maps are nearly uniform over the whole galaxy, but for the major axis asymmetry, and a small gradient toward the center indicating the presence of a redder disk-like component. The H image indeed reveals the existence of a tilted gaseous “disk” around the center, oriented with the major axis toward the companion galaxy NGC 127.
Long slit and CIGALE data confirm the presence of gas in a disk-like component counter-rotating and inclined approximately of to the line of sight. The mass of the gas disk in the inner region is .
The stellar velocity field is cylindrical up to the last measured points of the derived rotation curves, while the velocity dispersion profiles are typical for an S0 galaxy, but for an extended constant behaviour along the minor axis.
Key Words.:
Galaxies: individual: NGC 128 – Galaxies: elliptical and lenticular, cD – Galaxies: photometry – Galaxies: kinematics and dynamics – Galaxies: structure – Galaxies: general1 Introduction
The connection between the boxy/peanut morphology of galactic bulges and the presence of a bar is difficult to prove observationally. The main difficulty comes from the fact that the peculiar morphology can be seen only in almost edge-on systems.
Photometric evidences of a bar in boxy/peanut galaxies have been found only in a few cases, e.g. the barred galaxy NGC~4442 at intermediate inclination (Bettoni & Galletta bet:gal (1994)), the edge-on S0 galaxy NGC~1381 (de Carvalho & da Costa decarv (1987)), NGC~5170 (Dettmar & Barteldrees dett:bart (1988)), NGC~2654, and NGC~4469 (Jarvis jarv1 (1986)).
The kinematic observations offer further evidences of this connection. Kuijken & Merrifield (kuij:merr (1995)) obtained a characteristic “figure-of-eight” rotation curve, which is likely the strong signature for the presence of a bar, for two peanut shape objects: NGC~5746 and NGC~5965. Other known cases of galaxies with these peculiar rotation curves are IC~5096 (Bureau & Freeman bur:free (1997)), NGC~2683 (Merrifield merrif (1996)), NGC~5907 (Miller & Rubin mill:rub (1995), and UGC~10205 (Vega et al. vega (1997)).
Of course, given the small number of cases, new accurate photometric and spectroscopic observations are necessary for solving the peanut/bar connection.
Here we present a large data-set for the most representative object of this class: NGC 128, the standard peanut-shaped galaxy (Sandage sandage (1961)).
In the following sections we describe the peculiar morphology of NGC 128 and its group, present a 2D approximated model of the surface brightness of the galaxy (Sec. 2), give the results of long slit and CIGALE data (Sec. 3), show the surface brightness and color profiles of the galaxy at optical and near infrared wavelengths (Sec. 4), present the results of H and NIR observations (Sec. 5 and Sec. 6), analyze the far infrared IRAS data (Sec. 7), and briefly summarize the whole datasets (Sec. 8). The technical solutions adopted for the data reduction are given in the Appendix.
2 Morphology
The peculiar edge-on S0 galaxy NGC 128 is the dominant member of a group which includes NGC~126 (E/SB0), NGC 127 (Sa), NGC~130 (E5), a faint anonymous Sa galaxy North and preceding NGC 128, and possibly NGC 125 (S0 pec) (Zwicky et al. zwick (1965)). The membership of NGC~125 is controversial since its recession velocity is higher than average by km s-1.
Burbidge & Burbidge (burb:burb (1959)), Hodge & Merchant (hodge (1966)), and Bertola & Capaccioli (bert:cap (1977), BC77) provided the first data for NGC 128 and its group. The galaxies of this group are late Ellipticals and early Spirals, and the recession velocities are in the range 4200–4600 km s-1. NGC 128 is connected by a bridge to NGC 127, and according to BC77 a set of filaments protrudes southwards to NGC 126. The galaxy NGC 125 is surrounded by a large ring (BC77 estimated a diameter of kpc) which is asymmetrically placed with respect to the center of the galaxy.
NGC 128 is classified as BS-I in the list of de Souza & dos Anjos (desouza (1987)). The peculiar peanut shape of the bulge is clearly visible even in the innermost isophotes: the bulge appears squared by four symmetric bumps, forming an X-structure with arms at from the major axis of the galaxy and extended, in projection, for (5.4 kpc)111We assume throughout the paper a distance of 56 Mpc for the galaxy and km s.. The peculiar morphology is not due to extinction effects (see next sections).
As suggested by Pfenniger & Friedli (pfen:fri (1991)) the X-structure is likely an optical illusion. We clearly see this effect in the original frame by changing the cuts: a thin disk and a small, and approximately round, bulge are seen in the center at the higher counts, while an increase of the thickness of the disk is apparent at lower counts. Such “flaring” seems to originate the X-structure. The impression one has is that of looking to a “papillon”. The stars seem pulled out of the disk, the maximum effect taking place at arcsec, corresponding to kpc.
The galaxy is seen approximately edge-on. We derived a ratio of 0.76, a value which is in relative good agreement with that found by Guthrie (1992) in his sample of edge-on galaxies for the S0 class. The observed major axis diameter is kpc (at mag arcsec-2), and the thickness along the minor axis kpc.
The disk appears bended toward West on both sides, either in the visual and in the NIR images, in particular toward the South-West direction, where the bending starts at (10 kpc) from the center. The peaks of the light distribution along cuts perpendicular to the disk major axis have a maximum shift of (1.9 kpc).
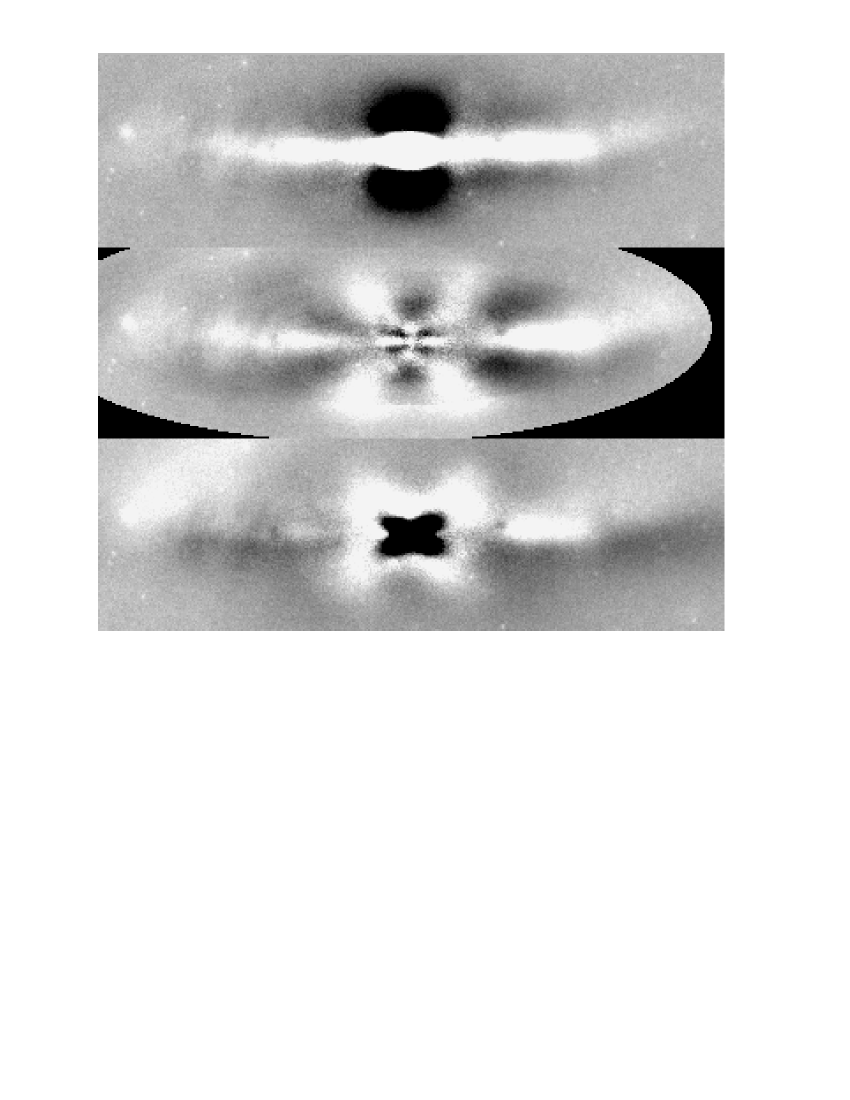
We tempted to highlight the peculiar morphology of NGC 128 in different ways using the images with the best seeing and higher S/N ratio (the -band frames). First we subtracted a model of the bulge component of the galaxy (Fig. 1, middle panel) obtained by fitting with ellipses the inner isophotal contours of the galaxy. In the residual map we identify the X-structure (in white color) and the disk component, which appears thicker in the outer region. The X-structure contributes approximately only to of the total luminosity of the galaxy. This means that it is a projection effect rather than a physical new component.
While the X-structure and the bending of the disk are clearly visible in the original CCD frames, the increasing thickness of the disk in the outer region is possibly the result of the bulge subtraction (we verified this fact by simulating an edge-on S0 galaxy and subtracting the bulge component). Using the unsharp masking technique (Fig. 1, upper panel) we were able to confirm the bending of the disk on both sides, but not the flaring of the outer disk. The X-structure is obviously not visible in such image.
Notice that in Fig. 1 (middle and lower panels) the disk is fainter along the North direction. Here there is a strong absorption in correspondence of the encounter of the disk of NGC 128 with the arm of NGC 127.
Since the X-structure is the result of the subtraction of a model built with elliptical isophotes on a galaxy with a pronounced boxy shape, we realized a new 2D model of the galaxy taking into account the boxiness of the bulge. The 2D surface brightness distribution of the entire galaxy (within mag arcsec-2, masking the center, the region of the disk affected by the interaction with NGC 127, and the distorted outer disk) is given by the formulae:
| (1) | |||||
| (2) |
where and are respectively the distance of the pixel from the galaxy center. The exponent used for the bulge component realizes the boxy isophotes. The light profile of the bulge follows a law (Caon et al. caon2 (1993)), while the disk has an exponential distribution.
The model has the following best fitting structural parameters: mag arcsec-2, , mag arcsec-2, , , , , and . This is, of course, only an approximated model for such peculiar galaxy having a strongly disturbed morphology. The fit appears infact too bright in the center, even after the convolution with the PSF of the image (Fig. 2) and, in the South direction, the true light distribution along the major axis is progressively fainter for , while along the minor axes the model is slightly brighter than the galaxy. Given the large uncertainty, we performed a second fit by eye, giving more weight to the less disturbed Southern region of the galaxy. This provided a smaller value for the scalelength of .
Even with the use of a more complex model, the residuals present an X-structure (Fig. 1, lower panel), a disk obscured in the North side, and a peculiar distorsion in the South-West direction. The X-component now contributes only to of the galaxy luminosity. This proves that the X-structure is an optical illusion.

In Figs. 3 and 4 we compare the structural parameters of NGC 128 with those extracted from a volume limited sample of elliptical, S0, and spiral galaxies of the Virgo and Fornax clusters (Caon et al. caon1 (1990), caon3 (1994) (C2D), D’Onofrio donof1 (1991)). In terms of luminosity the galaxy belong to the ‘bright’ family of early-type objects defined by Capaccioli et al. (cap:etal (1992)). The major and minor axes, measured by the parameters and , are in good agreement with the corresponding data of the C2D sample for a galaxy of that luminosity (Fig. 3). The effective surface brightness (and the effective radius) of the whole galaxy and of its bulge component is relatively high: note in fact the peculiar position in the diagram (Fig.4 lower panel, cf. Capaccioli et al. cap:etal (1992)) which would assign the object to the ‘ordinary’ family of early-type objects.

For what concern the disk component, we measured the central surface brightness and the scale length of the disk and plotted them in the diagram (Fig.4 upper panel) comparing NGC 128 with a sample of 35 spiral galaxies of various morphological types (D’Onofrio donof1 (1991)). The scale length of the disk appears very large while the corrected central surface brightness is normal for a galaxy of that luminosity.

The basic data for NGC 128 either derived in this work and extracted from the literature have been listed in Table 1. In the table and are the radii of the circles which enclose half the total luminosity of the galaxy. The first was calculated by excluding the contribution of the two nearby companion galaxies of NGC 128. The HI mass has been calculated by us following Jura (jura (1986)).
| Parameter | Value | Source | |
| Coordinates (2000.0) | R.A. | 00h 29m 15s.0 | de Vaucouleurs et al. (rc3 (1991)) |
| Dec. | 02° 51′ 55′′ | ” | |
| Morphological type | T | Sandage (sandage (1961)) | |
| Heliocentric recession velocity | czhel | 4180 50 km s-1 | this paper |
| Distance | 56 Mpc | ” | |
| Total mag. | BT | mag | ” |
| Total mag. | RT | mag | ” |
| mag. () | J() | mag | ” |
| mag. () | H() | mag | ” |
| mag. () | K() | mag | ” |
| color | mag | de Vaucouleurs et al. (rc3 (1991)) | |
| Average within | mag | this paper | |
| Average | mag | ” | |
| Average | mag | ” | |
| Average | mag | ” | |
| Galactic extintion | 0.06 mag | de Vaucouleurs et al. (rc3 (1991)) | |
| Effective radius | this paper | ||
| ” | |||
| Effective surf. brightness | mag arcsec-2 | ” | |
| mag arcsec-2 | ” | ||
| Radius at mag arcsec-2 | r25 North | ” | |
| r25 South | ” | ||
| r25 East | ” | ||
| r25 West | ” | ||
| Major axis position angle () | P.A. | ” | |
| Central velocity dispersion | () km s-1 | ” | |
| ratio | ” | ||
| IRAS 12 mFlux | upper limit | IPCS and FSC | |
| IRAS 25 mFlux | upper limit | IPCS and FSC | |
| IRAS 60 mFlux | FSC | ||
| IRAS 100 mFlux | IPCS | ||
| H [NII] luminosity | erg sec-1 | this paper | |
| H [NII] mass | M(H) | ” | |
| FIR luminosity | ” | ||
| Integ. CO intensity | I(CO) | K km s-1 | Taniguchi et al. (tan:etal (1994)) |
| HI flux | HI | Jy km s-1 | Chamaraux et al. (cham:etal (1986)) |
| HI Mass | M(HI) | M☉ | ” |
| HI Mass | M(HI) | M☉ | this paper |
| X-ray luminosity | erg sec-1 | Fabbiano et al. (fab:etal (1992)) | |
| Radio flux density | mJy/beam | Collison et al. (coll:etal (1994)) |
3 Spectroscopic data
3.1 Stellar kinematics
Details of the available spectra and of the data reduction are given in A. Here we discuss the rotation curves (RCs) of the star component extracted from the absorption features of the spectra. The radial velocity measurements of the spectra along the major axis were combined and folded about the center of the galaxy and shown in Fig. 5 (bottom panel), choosing the radial offset and the systemic velocity which minimize the dispersion of points in the folded curves ( along the South direction corresponding to pc). Our heliocentric systemic velocity is km s-1, lower by 30 km s-1 than in Dressler & Sandage (dres:sand (1983)). The error takes into account the zero point uncertainty of the RC derived from the three standards stars used.
Note that the folded curves match very well in the inner , while the curve along the North side suffer from the presence of the interaction with NGC 127. The South side has a short extension because the RC is extracted from the off-centered spectrum of the first night. The spectrum of the second night (much more noisy) does not extend far out Southwards.
The RC is very steep in the central region: at a distance of from the center along the major axis the rotation velocity is already 100 km s-1. In BC77 the RC grows more slowly in the range , while in our measurements the velocity increases outside up to a value of 350 km s-1 in the North direction.
In NGC 128 we do not see in the RC the characteristic “figure-of-eight” feature, neither for the stellar or the gaseous component. Here the gas is counter-rotating and we have an X-shaped RC (see 3.2). According to Friedli & Udry (fri:udr (1993)) and Emsellem & Arsenault (ems:ars (1997)) the counter-rotating gas is tracing the anomaouls orbits existent in a tumbling triaxial potential.

The folded RC along the minor axis of the galaxy is shown in the bottom panel of Fig. 6. The curve along the minor axis is less extended since beyond the spectra reach the level of the sky surface brightness and the errors become larger. There is a hint of a non-zero velocity pattern along the minor axis suggested by the occurrence of a maximum and of a minimum velocity at symmetric places along the two sides opposite to the center. If this behaviour will be confirmed by future data, the presence of a small ring of stars (remnants of a polar ring?) can be suspected.

A number of off-centered spectra of NGC 128, along directions parallel and orthogonal to the main axes, have been obtained by B. Jarvis (private communication). We list the Jarvis’ logbook in Table 2 and we plot the corresponding RCs in Fig. 7. The agreement with our data is quite good. The comparison of the measured velocities at a given distance along the RC is shown in Table 3.
| Telescope | Instr. | Disp. | PA | Exp.T. | Notes |
|---|---|---|---|---|---|
| Ang/pxl | [deg] | [hour] | |||
| CTIO 4m | SIT | 0.94 | 90 | 1.5 | S |
| CTIO 4m | 2DF | 0.55 | 90 | 2.7 | S |
| CTIO 4m | 2DF | 0.55 | 0 | 3.3 | E |
| AAT 3.9m | IPCS | 0.49 | 0 | 1.6 | E |
Such spectra show that the cylindrical rotation is observed up to ( kpc). The major axis off-set RCs are also quite similar to our curve, differing for a smaller gradient only.
| (km s-1) | (km s-1) | |
|---|---|---|
| 138 | 120 | |
| 142 | 140 |

The upper panel of Fig. 6 shows the folded minor axis velocity dispersion (VD) profile. The central value is around 220–240 km s-1. Note the increase of km s-1 in the inner and the wave-shape which keeps the velocity dispersion to an high level out to the last measurable point.
The folded VD profile along the major axis is shown in Fig. 5 (upper panel). The shape is that characteristic of the early-type galaxies, with a bulge dominated region where the velocity dispersion decreases, and a disk dominated part, where the velocity remains appromimately constant. It is interesting to note the asymmetry in the VD profile at in correspondence of the arm of NGC 127.
3.2 Gas kinematics
Here we discuss the RCs of the gas component detected in our spectra and the results of CIGALE observations (see A and B for details of the data acquisition and reduction).
In Fig. 8 together with the unfolded RC obtained from the absorption lines, we plotted the behaviour of the gas component resulting from the emission lines. We took the peak of a gaussian curve, fitted to the emission lines in each row of the spectra, as a measure of the rotational velocity of the gas. It appears a clear counter-rotating gas component which extends up to (2.2 kpc) around the nucleus. The gas seems to have the same gradient of the stellar component. In the first around the nucleus the rotation velocity increases up to km s-1. This behaviour is in agreement with the velocity field derived by Emsellem & Arsenault (ems:ars (1997)) with TIGER. They found that the gas and the stellar velocity at along the major axis is km s-1.

Unfortunately the S/N ratio is not high enough to follow the gas emission at larger distances. We also do not observe the “figure-of-eight” in the rotation curve which is a strong signature of a barred potential (Kuijken & Merrifield kuij:merr (1995)).
The velocity dispersion of the gas is more difficult to evaluate. We derived an approximate value by correcting the sigma of the gaussian, used to fit the emission lines, for the instrumental dispersion through the relation: . The velocity dispersion is nearly constant at km s-1 within the central . This is only km s-1 lower than the central stellar velocity dispersion. A possible explanation for this high value is that the gas is not in equilibrium yet.
The velocity field of NGC 128 derived by the CIGALE data is plotted in Fig.9. It is well consistent with a disk-like gas component. The rotational velocity is positive along the SE direction and negative in the NW. The major axis of the H disk is observed to extend up to and is approximately oriented at a position angle PA . The PA decreases from the center (PA ) to the outer parts (PA ).
CIGALE is in poor agreement with the long slit spectroscopic data (Fig.8). The gradient of the RC, the maximum rotational velocity, and the systemic velocity of the galaxy (greater by km s-1) do not match the EFOSC data. The discrepancy is probably due to the loss of resolution caused by the binning of the CIGALE data. On the other hand the agreement is fair with the photometric observations, despite the lower resolution and the bad seeing condition. The extension and the PA of the gas disk component are similar.

4 Optical photometry
Now we present the results of our and bands CCD photometry. Details of the available data and the reduction procedures are given in C.
Our CCD photometry is slightly fainter ( mag) than that of BC77 who claimed a corrected -magnitude inside a circular aperture of 12.61 mag, while it is 0.02 brighter than the value of 13.01 mag reported by de Vaucouleurs & de Vaucouleurs (rc2 (1972)). By excluding the contribution of the two nearby galaxies NGC 126 and NGC 127 and integrating the total luminosity up to we get mag (in good agreement with the value of of de Vaucouleurs et al. rc3 (1991)) and mag. We obtained (with our choice of ) an absolute magnitude . Most of the results of our photometric analysis, together with a number of literature data, are summarized in Table 1.
The isophotes of the galaxy are nearly round in the center and become progressively influenced by the presence of the disk after few arcsec. The simmetry of the figure is good and there are no indications of subcomponents and/or substructures. A first set of profiles was extracted (in each photometric band) along the major, minor and intermediate axes of NGC 128. We averaged 10 profiles taken in a cone of 1 degree aperture.
The -band folded light profiles of NGC 128 are plotted in Fig.10. The asymmetry along the major axis starts approximately at and it is clearly seen between and . On the other hand, along the minor and intermediate axes the light profiles are more symmetric and become progressively asymmetric because of the presence of the nearby galaxies NGC 126 and NGC 127.

The profiles given by BC77 are shown in the figure with the dashed lines. A small systematic offset seems to exist between the two data sets, but on average the agreement is very good, taking into account that they used photographic data.
A second set of profiles were extracted (for the -band image) along cuts perpendicular and parallel to the major axis in the East and South directions respectively. Note the shift of the peak of surface brightness toward West (Fig. 11 upper panel). From the bottom panel of that figure we have a marginal indication for the presence of a bar. Following Wakamatsu & Hamabe (waka:ham (1984)) (who presented the evidence for the presence of a bar in the edge-on galaxy NGC~4762) we tentatively recognized in the light profiles (along the South direction which is less affected by dust) the typical bump usually attributed to the existence of a bar. This is indicated by the fact that the bump becomes more and more insignificant at larger . Differently from NGC 4762 this behaviour is not followed by a plateau and a cut-off characteristics of the presence of a lens. So, our suspect for the presence of a bar rests only on the marginal evidence given in Fig. 11.

The folded color profiles of the major axis are shown in Fig. 12 (together with the , , and colors). They have been preferred on a 2D color map in order to increase the S/N ratio.
We notice a clear reddening toward the center ( mag) starting approximately at and we estimate an average color . Such reddening is not symmetric along the various direction of profile extraction, a fact that further support the existence of a disk-like structure around the center.

The color profiles become bluer where the arm of NGC 127 encounters the disk of NGC 128, the maximum shift between the two sides reaching 0.06 mag. The color increases of mag in the inner 15 Kpc. Along the minor and intermediate axes the color gradient is even larger, reaching 0.3 mag in the direction of the X-structure.
5 Narrow band photometry
As before the details of the data reduction are given in D.
NGC 128 is already known to possess a counter-rotating gas component (Pagan pagan (1994), Emsellem & Arsenault ems:ars (1997)). In Fig. 8 together with the unfolded rotation curve of the galaxy we plotted the behaviour of the gas component resulting from the long slit data. It appears a clear counter-rotating gas component which extends up to (2.2 kpc) around the nucleus.
The contours of the H and [NII] emission lines of NGC 128 and NGC 127 are shown as solid lines in Fig. 13. In the same figure we overlaid the contours of the -band image of the galaxy (dashed lines) and a grid to help the evaluation of the size of the emission region.
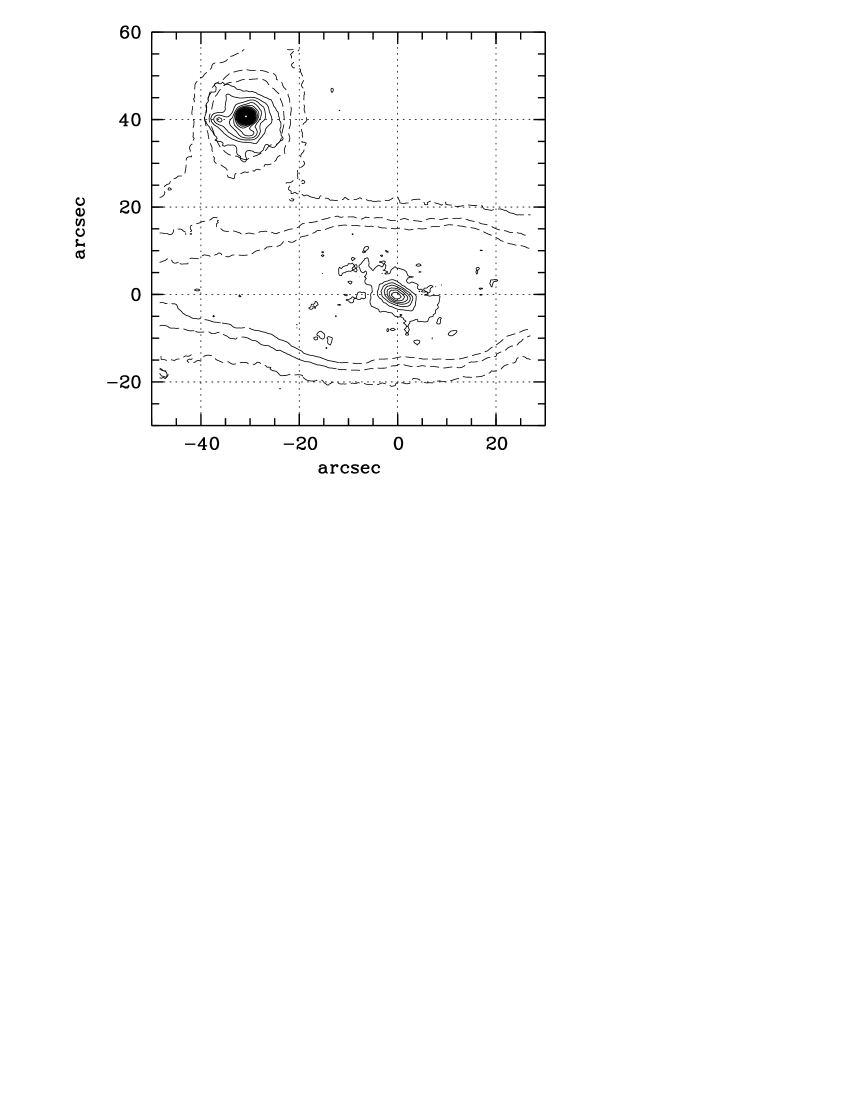
Notice the presence of an inner disk-like component with the major axis tilted toward NGC 127. The disk is approximately at 40° from the equatorial plane of NGC 128 and it is extended to from the center in both directions. The position angle of the gas component decreases toward the galactic plane to 25° (in good agreement with the value quoted by Emsellem & Arsenault ems:ars (1997)).
The total H flux (computed in Appendix) was used to calculate the total mass of the gas disk. Following Osterbrock (osterb (1974)), Kim (kim (1989)) derived the mass from the relation:
| (3) |
where is expressed in solar masses, is the distance of the galaxy in Mpc, and is the electron number density in cm-3, and F(H) is given in erg sec-1 cm2. Our final value is , which rests on our value of , an uncertainty of 0.4 Mpc for the distance of the galaxy, on the measured flux error, and an assumed electronic density of . This density was estimated following Kim (kim (1989)) from the ratio of the two lines 6717/6731 ( 0.75 a value which is compatible with such electronic density) between the [SII] emission lines detected in the spectra.
We also computed the gas mass using CIGALE observations. By integrating the total flux within and assuming we get . Although the flux is integrated here on a larger area, we believe it is likely an overestimated value, due to the poor photometric calibration of the CIGALE data.
6 Results from NIR data
As for the optical images, the NIR frames also show that the inner region have the characteristic X-structure and that the disk is arc-bended toward West. Details of the data reduction are given in the E.
We have extracted the light profiles along the same directions of the optical images and built the , , and color profiles. This was realized by degrading the -band image to the same seeing of the NIR images. They are shown in Figs. 12. The , , and colors ( non plotted here) are constant, within the present uncertainty, up to the last measured point (, , ).
A few comments are in order:
1) along the major axis the folded profiles do not match: the difference
reaching up to mag in , , and at
from the center;
2) in the inner the , , and color profiles
along the major and intermediate axes have a small decrease ( mag),
which is less evident along the minor axis. This reveals the presence of an
elongated red component. In the same region the color increases;
3) apart from the color, the other colors are approximately constant
with the distance from the center.
From the color indices we derived information about the dust distribution. By comparing the North and South semiaxes, we found that the color indexes () are systematically higher in the North direction, between and , than in the South. We interpret the asymmetry as due to an enhancement of the average dust content in the region where the arm of the companion galaxy NGC 127 intercepts the major axis of NGC 128.
We computed the color excess by subtracting the corresponding color index of the two semiaxes, and, following the procedure described in F, we derived a dust mass excess of M☉ associated to the North semiaxis. The IRAS data confirm that the dust is manly concentrated toward the region of interaction of the two galaxies (see Sect. 7) and, therefore, we may consider the derived dust mass as a measure of the dust content of NGC 128. Of course, adopting different models lower dust masses (up to one order of magnitude) can be obtained.
Taking into account the uncertainty in the color excess, the evaluation of the dust mass from the optical and NIR data is characterized by an error of , a factor of two larger than those characterizing the FIR measurements.
7 The FIR emission
NGC 128 is associated in both the IRAS Point Source Catalogue (IPSC) and Faint Source Catalogue (FSC) to the IRAS source 00266+0235. At 12 and 25 m the IRAS catalog gives only upper limits, while high quality fluxes are available at 60 and 100 m respectively in the FSC and IPSC (see Table 1). The total FIR luminosity, following Helou et al. (helou (1985)) and adopting our heliocentric recession velocity and Hubble constant, turns out of .
Knapp et al. (knapp:etal (1989)) derived the fluxes at 60 and 100 m for NGC 128 by averaging the IRAS data at the galaxy position. Using a similar technique, Bally & Thronson (bal:thr (1989)) obtained flux values which are slightly different. Their results are in agreement, within the errors, with the PSC values reported in Table 1.
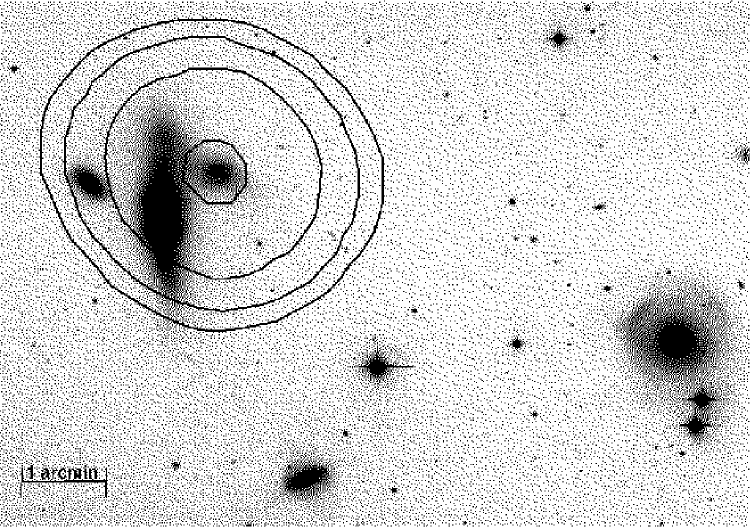
The 60 and 100 m IRAS data were processed using the method described by Assendorp et al. (ass:etal (1995)). After the standard co-addition of the images, we used the Maximum Entropy (ME) method described by Bontekoe et al. (bont:etal (1994)). The resulting 60 and 100 m high-resolution (about ) infrared maps are overlaid onto a deep band image of NGC 128, taken with CAFOS at the 2.2m telescope of Calar Alto (Figs.14 and 15).
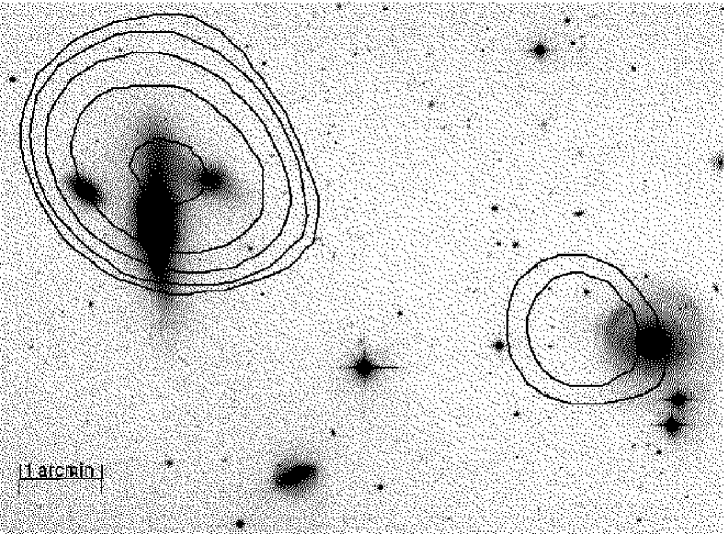
The peak of the FIR radiation is situated in the area where the galaxy undergoes interaction with NGC 127. The shift between the 60 and 100 m peak intensity position is in the IRAS cross scan (SW) direction and therefore not significant compared to the resolution achieved with the ME method. Taking into account this uncertainty, we cannot associate the FIR emission to NGC 128 instead of NGC 127. Both these galaxies may contribute to the FIR emission.
On the other hand, the shift in the NW scan direction is much smaller () implying that the FIR radiation has its peak in the North semiaxes, so that it is probably connected to the interaction of the two galaxies.
We note in passing that the companion galaxy NGC 125 is not seen at 100 m, and that the ring-like structure visible at 60 m is approximately in the same position of the optical ring detected by BC77. The presence of such peculiar feature leads to suspect that NGC 128 and NGC 125 possibly underwent an interaction in the past.
The FIR thermal emission can be used to measure the dust mass. The resulting dust mass depends on the physical-chemical properties of the grains (i.e. grain radius, density and emissivity) and on the adopted dust temperature.
In principle we can derive the dust temperature () by fitting the FIR data with a grey-body characterized by a spectral trend . Since only the 60 and 100 m fluxes are available, we used the relation obtained by Henning et al. (henn:etal (1990)) to compute three dust color temperatures, obtaining respectively ( black-body), ( grey-body), ( grey-body). The values chosen for are suggested by the current dust models (Mathis & Whiffen math:whi (1989); Wright wright (1989); Désert et al. desert (1990); Draine & Malhotra drai:mal (1993)).
Following Hildebrand (hild (1983)) we computed the dust mass adopting a spectral index (except with the formula of Thuan & Sauvage thua:sau (1992) where we used ). The derived masses are listed in Table 4. Notice that, considering the flux uncertainty of the IRAS data (), our values are in good agreement with those available in literature. The differences with Bally & Thronson (bal:thr (1989)) and Roberts et al. (rob:etal (1991)) are due both to differences in the adopted fluxes and in the dust temperature evaluations.
| Dust mass | Method | Reference |
|---|---|---|
| () | ||
| Greenhause et al. gree:etal (1989) | Bally Th. 1989 | |
| Young et al. young (1989) | Roberts et al. rob:etal (1991) | |
| Thronson Telesco thr:tel (1986) | this paper | |
| Greenhause et al. gree:etal (1989) | ||
| Young et al. young (1989) | ||
| Roberts et al. rob:etal (1991) | this paper | |
| Thuan Sauvage thua:sau (1992) | this paper |
The dust masses in Table 4 are derived using a single temperature model. This is a rough approximation for the condition found in the galactic environment. The dust is in fact heated by the radiation field, which in turn depends on the sources of luminosity and their spatial distribution in the galaxy. The total FIR emission is likely due to the contribution of dust at different temperatures. Moreover, the IRAS FIR measurements are not adequate to detect the emission coming from cold dust ( ) which peaks at a wavelength between 200 and 300 m.
We thus estimate the total dust mass by introducing a dust temperature distribution depending on two free parameters which affect the shape of the function (see Kwan & Xie kwan:xie (1992) and Merluzzi merluz (1998) for details).
We choose a range of temperatures that contribute to the IRAS emission between 7 and 60 and we select the proper values of the free parameters which reproduce the ratio of the flux densities at 60 and 100 m and takes into account the value of the FIR color temperature. The computed dust masses for a family of temperature distributions which satisfy the previous constraints are comparable within the flux and dust parameters uncertainties.
With and the fluxes given in Table 1, we estimate the dust mass associated to the galaxies NCG 128 and NGC 127, to be in the range . This value is larger than those obtained by the single temperature models, because the temperature distribution accounts for the contribution of the colder dust.
It has to be noticed that, since our constraint on the peak temperature is derived from the 60-100 m data, the computed mass may be biased by the presence of the warm dust even if the temperature distribution estimates the different contributions. In particular, this happens if a significant fraction of cold dust is present in the source. In this case, we can consider our dust mass evaluation a lower limit for the dust content of NGC 128 and NGC 127. On the other hand, the NIR dust mass belongs entirely to NGC 128, and must be considered an upper limit, since it was derived using the galactic value, i.e. the absorption of a spiral galaxy for the early-type NGC 128.
Taking into account the high uncertainty of the NIR dust mass (), we thus suggest to adopt the dust mass of M☉ for the pair of galaxies NGC 128 and NGC 127, and a dust mass lower limit of M☉ for NGC 128.
8 Conclusions
The large number of observational data presented in this work
can be summarized as follow:
1) the peanut shape of the galaxy is clearly visible at optical and NIR
wavelengths;
2) the color of the inner regions is rather uniform and similar to that of
the disk component. A small color gradient toward the center is observed;
3) the stellar disk is thick and distorted, in particular toward the NW side;
4) the galaxy host a counter-rotating gas component which
is tilted in the direction of the companion galaxy NGC 127. The mass of such
component is approximately ;
5) the gas has not the same distribution of the dust component which is
largely confined in the region of interaction between NGC 128 and NGC 127.
The mass of the dust component is estimated of ;
6) the gas does not seem to fuel a nuclear activity or a starburst of star
formation;
7) the velocity field of the stellar component is approximately cylindrical.
The velocity dispersion along the minor axis is rather constant and high.
The RC of the gas component has the same slope of the stellar component.
8) the “figure-of-eight” of the RC, signature characteristic for the
presence of a bar, is not observed, either in the stellar and gaseous component.
The whole data-set presented in this paper does not clearly reveal or dismiss the presence of a bar in NGC 128 and seem to support the theoretical mixed scenario proposed by Mihos et al. (mihos:etal (1995)). Interactions and soft merging events probably triggered a disk instability which originate a strong buckling phenomenon. We can suspect that the interaction between NGC 128 and NGC 125 or the accretion of a small gas-rich satellite was responsible of such instability. The interaction with the spiral companion NGC 127 seems very recent since dust and gas have not the same spatial distribution in the galaxy.
Acknowledgements.
We thank P. Rafanelli for the large field image of NGC 128 taken at Calar Alto, R. Assendorp for the valuable help in the IRAS data reductions, and B. Jarvis for the long slit RCs of NGC 128 perpendicular and parallel to the major axis. We are also very grateful to the observers of the Spectial Astrophysical Observarory, S.N. Dodonov, S.V. Drabek and V.V. Vlasiuk assisting us at the 6m telescope, as well to J.L. Gach of Marseille Observatory for his help during observations and data reduction.Appendix A Long slit spectroscopy
NGC 128 and the template stars HR~459 (K2III), HR~6884 (K0III), and HR~8610 (K2II), have been observed with the 3.6m ESO telescope equipped with EFOSC in three different nights of June 1990.
The detector was a RCA CCD pixels, used in binned mode. The pixel size of 30 m maps on the sky. The grism gives a dispersion of Ang/pxl in the wavelength range 5000–7000. The spectrograph slit was aligned with the major and minor axes of the galaxy.
In the first night we got an exposures of 1 hour along the major axis in the South direction, placing the center of the galaxy at one end of the slit in order to cover as much as possible the whole galaxy. In the second night we put the slit in the North direction, but unfortunately the weather was cloudy and with bad seeing (). The third night we got a single centred spectrum of the minor axis.
After the standard procedures of bias and dark subtraction and flat-fielding of the raw data, we corrected the distortion pattern by deriving a line-by-line wavelength calibration from the comparison spectra.
The science spectra have been conservatively adaptive-filtered following the procedures described by Richter et al. (rich:etal (1992)). This technique allows to obtain reliable rotation curves (RCs) and velocity dispersion (VD) profiles extended up to mag fainter in surface brightness.
In the spectra are clearly visible the absorption features of the MgI triplet () and the Na D-band around . The analysis of the spectra is based on the Fourier Correlation Quotient method (FCQ), as developed by Bender (bender (1990)). We essentially used the same procedures described with more details in D’Onofrio et al. (donof2 (1995)).
Unfortunately the low S/N ratio and the unfavourable spectral resolution hampered the acquisition of an accurate broadening function and we were not able to check the kinematical signatures of eventual subcomponents. We could only verify that the change of the template stars introduces no differences in the final RCs and VD profiles.
In our long slit spectra of NGC 128 we recognized five emission lines, [NII] (6548), H (6563), [NII] (6583), [SII] (6717) and [SII] (6731). The most intense one is [NII] (6583), while H is attenuated by the neighbouring absorption lines.
Appendix B CIGALE
CIGALE data have been acquired at the 6m telescope of SAO (Special Astrophysical Observatory, Russia) on October 27, 1995. The scanning Perot-Fabry interferometer, installed inside the pupil plane of a focal reducer which was attached to the F/4 prime focus of the telescope, gives a spectral resolution of 9000.
The detector was an intensified photon counting system (IPCS) with a pixel scale of . The free spectral range was 606 km s-1. The IPCS enables a rapid scan of the interferometer (each of the 32 channels were scanned typically in 18 s). The blocking interference filter was of 12 Ang, centered on the mean recession velocity of the galaxy. The total exposure was 16000 s, during poor weather transparency conditions.
Reduction of observational data (correction for phase shifting, night sky emission substraction, velocity and monochromatic maps) were done using standard methods through the ADHOC software (see Plana & Boulesteix plana:boul (1996) for details). The final data were beamed pixels because of the poor observational conditions.
Appendix C CCD broad band photometry
CCD images of NGC 128 and of a set of standard stars were taken in two nights in September 1994 through the and filters at the 1.5m ESO Danish telescope. The frame dimensions are of pixels, with a scale length of per pixel on the sky. The exposure times were respectively of 40 and 20 minutes. The seeing was approximately FWHM.
After the standard make-up procedures the images have been calibrated using both a set of standard stars observed the same night and the photoelectric aperture photometry taken from the Longo & de Vaucouleurs (longo1 (1983), longo2 (1988)) catalogs. The standard stars were chosen from the set of Landolt (landolt (1992)).
The calibration through the standard stars uses the following equations:
| (4) | |||||
| (5) |
where and are the fluxes in adimensional units of the stars obtained after the normalization of the images to the standard exposure of 1 sec and the correction for the extinction of the atmosphere, and are respectively the color term and the zero point of the CCD for each night in both filters. They give the transformation from our photometry to the Johnson and Kron-Cousin systems.
We also built the growth curves by integrating the flux through circular apertures in order to compute the total luminosity of the galaxy. By indicating with
| (6) |
the growth curve of the galaxy, where is the area of the circles of radius centered on the galaxy nucleus, we converted in magnitudes the growth curves through the set of equations:
| (7) | |||||
| (8) |
adopting the zero point and color terms derived from the standard stars.
Following de Vaucouleurs et al. (rc3 (1991)) we considered the galactic extinction toward NGC 128 very small and applied no correction. The magnitude was corrected to the Johnson system using the transformation given by Longo & de Vaucouleurs (longo2 (1988)).
The sky surface brightness was estimated using the standard stars and the photoelectric aperture photometry of the galaxy for both nights with an internal accuracy of 0.05 mag arcsec-2. We got , (first night) and , (second night). The sky counts were measured at the corners of the frames.
Appendix D CCD narrow band photometry
Images of NGC 128 through the interference filters H and the nearby continuum have been obtained at the 1.5m Danish telescope during the same ESO run of the optical observations. The adopted filter has a width of 50 Ang and takes into account the redshift of the galaxy. The width is large enough to include the contribution of H and [NII] lines.
After the procedures of bias, dark, flat-field correction, cosmic rays cleaning, sky subtraction, normalization at 1 sec exposure, reduction to a standard airmass, and alignment of the images, we faced with the probelm of isolating the H contribution with respect to the continuum. The problem is to find the constant factor which equates the level of the continuum of the two images (H and nearby continuum):
| (9) |
where and give respectively the fluxes measured through the lines and the continuum.
In order to derive it is convenient to establish the region of the frame where one can exclude the contribution of the emission lines. This is the region far from the center of the galaxy. The coefficient could be obtained from the growth curves of the two images because the gradient of these curves scale with the same factor:
| (10) |
By increasing the radius of integration the contribution of the emission is rapidly vanishing. It is therefore sufficient to calculate for large values of by excluding the central region.
In order to calibrate the H flux we used the standard star L870-2 of the Oke (oke (1974)) catalog that was observed the same night. The flux of this star at 6654.29, corresponding to our recession velocity of 4180 km s-1, is erg sec-1 cm-2 Ang-1. By adopting the previous procedure of analysis to the standard star, one obtains the ratio between the standard and measured flux erg cm-2 ADU-1, which express the sensitivity of our system. Then, by building the growth curve of the “pure” H image of the galaxy we get a total flux erg sec-1 cm-2, from which the resulting H [NII] luminosity turns out of erg sec-1, a value comparable to that of other S0 galaxies of the same luminosity (Buson et al. bus:etal (1993))222The error on the total luminosity does not take into account the error on the adopted distance of the galaxy..
Appendix E NIR photometry
Near infrared images of NGC 128 and of a set of standard stars were secured at the Tirgo telescope with the Arnica NICMOS3 camera in October 1995. The scale-length on the detector is per pixel for a total field of view of . The seeing was about FWHM and the quality of the sky was photometric.
A sequence of on-off exposures have been taken for each filter on the sources and the nearby sky with exposures ranging from 5 to 12 sec. The telescope was dithered each time in different position so that the stellar images do not appear in the same place. The standard stars have been taken from Hunt et al. (hunt2 (1996)).
The images have been reduced following the Arnica package provided by Hunt et al. (hunt1 (1994)) for the IRAF system. Bad pixels have been corrected, after flat-fielding, by linear interpolation using a reference mask. The cosmic rays and the residual bad pixels have been eliminated using IRAF.
The Arnica zero point of the night for each filter was derived through the aperture photometry of the standard stars observed before and after the target galaxy. We used the average atmospheric extinction coefficients given by Hunt et al. (hunt2 (1996)). The mean level of the sky background was , , and mag arcsec-2. The sky counts level was measured at the corner of the frames.
Appendix F Dust mass from NIR data
In order to evaluate the dust content from the NIR data, we use the color excess . Since the color excess is related to absorption, we estimated the dust grain column density and the optical depth using the model of Cardelli et al. (card:etal (1989), hereafter CCM) which uses the mean extinction curve
| (11) |
where is the only free parameter. The coefficients and were derived as in CCM. Taking into account the relation between the color excess and the absorption we can write
| (12) |
being the right hand term of eq.11. Assuming and the derived value of , we got . We estimated a visual absorption mag. Since is proportional to the optical depth, a dust grain model has to be introduced to derive both the dust column density and the dust mass:
| (13) |
a value which depends on the dust grains radius , on the grain density , on the extinction efficiency , on the absorption and on the area of the galactic region interested by the absorption features .
Using the composite dust grain model of Mathis & Whiffen (math:whi (1989)) the dust mass turns out to be M☉. It is the dust mass excess associated to the North semiaxis.
References
- (1) Assendorp R., Bontekoe T.R., de Jouge A.R.W., Kester D.J.M., Roelfesma P.R., Wesselius P.R. 1995, A&AS, 110, 395
- (2) Bally J., Thronson H.A. Jr., 1989, AJ, 97, 69
- (3) Bender R., 1990, A&A, 229, 441
- (4) Bertola F., Capaccioli M., 1977, ApJ, 211, 697 (BC77)
- (5) Bettoni D., Galletta G., 1994, A&A, 281, 1
- (6) Bontekoe T.R., Koper E., Kester D.J.M., 1994, A&A, 284, 1037
- (7) Burbidge E.M., Burbidge G.R., 1959, ApJ, 130, 20
- (8) Bureau M., Freeman K., 1997, In: Arnaboldi M., Da Costa G.S., Saha P. (eds.), The Second Stromlo Symposium: The Nature of Elliptical Galaxies, A.S.P. Conf. Ser. 116, p. 93
- (9) Buson L.M., Sadler E.M., Zeilinger W.W., Bertin G., Bertola F., Danziger J., Dejonghe H., Saglia R.P., de Zeew P.T., 1993, A&A, 280, 409
- (10) Caon N., Capaccioli M., Rampazzo R., 1990, A&AS, 86, 429
- (11) Caon N., Capaccioli M., D’Onofrio M., 1993, MNRAS, 265, 1013
- (12) Caon N., Capaccioli M., D’Onofrio M., 1994, A&AS, 106, 199
- (13) Capaccioli M., Caon N., D’Onofrio M., 1992, MNRAS, 259, 323
- (14) Cardelli J.A., Clayton G.C., Mathis J.S., 1989, AJ, 345, 245
- (15) Chamaraux P., Balkowski C., Fontanelli P., 1986, A&A, 165, 15
- (16) Collison P.M., Saikia D.J., Pedlar A., Axon D.J., Unger S.W., 1994, MNRAS, 268, 203
- (17) de Carvalho R.R., Da Costa N.L., 1987, A&A, 171, 66
- (18) Désert F.-X., Boulanger F., Puget J.L., 1990, A&A, 237, 215
- (19) de Souza R.E., dos Anjos S., 1987, A&AS, 171, 66
- (20) Dettmar R.J., Barteldrees A., 1988, 173° AAS Meeting, 20, N. 4, 1085
- (21) de Vaucouleurs G., de Vaucouleurs A., 1972, MNRAS, 77, 1
- (22) de Vaucouleurs G. et al., 1991, Third Reference Catalogue of Bright Galaxies (RC3), New York, Springer-Verlag
- (23) Draine B.T., Malhotra S., 1993, ApJ, 414, 632
- (24) Dressler A., Sandage A., 1983, ApJ, 265, 664
- (25) D’Onofrio M. 1991, PhD Thesis, International School for Advanced Study, Trieste
- (26) D’Onofrio M., Zaggia S., Capaccioli M., Caon N., Longo G., 1995, A&A, 296, 319
- (27) Emsellem E., Arsenault R., 1997, A&A, 318, 39
- (28) Fabbiano G., Kim D.W., Trinchieri G., 1992, ApJS, 80, 531
- (29) Friedli, D., Udry, S. 1993, in Galactic Bulges, IAU Symp. 153, H. Dejonghe, H. Habing eds., p. 273
- (30) Greenhouse M.A., Hayward T.L., Thronson H.A., 1989, IAU Symp. N. 131, “Planetary Nebulae”, p. 172
- (31) Helou G., Soifer B.T., Rowan-Robinson M., 1985, ApJ, 298, L7
- (32) Henning Th., Pfau W., Altenhoff W.J., 1990, A&A, 227, 542
- (33) Hildebrand R.H., 1983, QJRAS, 24, 267
- (34) Hodge P.W., Merchant A.E., 1966, ApJ, 144, 875
- (35) Hunt L.K., Testi L., Borelli S., Maiolino R., Moriondo G., 1994, Arcetri Technical Report, N. 4
- (36) Hunt L.K., Migliorini S., Testi L., Stanga R.M., Casali M.M., Aspin C., Hawarden T.G., Baffa C., Lisi F., 1996, Arcetri Technical Report
- (37) Jarvis B.J., 1986, AJ, 91, 65
- (38) Jura M., 1986, ApJ, 306, 483
- (39) Kim D.W., 1989, ApJ, 346, 653
- (40) Knapp G.R., Guhathakurta P., Kim D.-W., Jura M., 1989, ApJS, 70, 329
- (41) Kuijken K., Merrifield M.R., 1995, ApJ, L13
- (42) Kwan J., Xie S., 1992, ApJ, 398, 105
- (43) Landolt A.U., 1992, AJ, 104, 340
- (44) Longo G., de Vaucouleurs G., 1983, A general catalogue of photoelectric magnitudes and colors in the UBV system, The University of Texas, Austin
- (45) Longo G., de Vaucouleurs G., 1988, Catalogue of visual and infrared photometry of galaxies from 0.5 m to 10 m, The University of Texas, Austin
- (46) Mathis J.S., Whiffen G., 1989, ApJ, 341, 808
- (47) Merluzzi P., 1998, A&A, submitted
- (48) Merrifield M.R., 1996, In: Buta R., Crocker D.A., Elmegreen B.G. (eds.), Barred Galaxies, A.S.P. Conf. Ser. 91, p. 179
- (49) Mihos J.C., Walker I.R., Hernquist L., Mendes de Oliveira C., Bolte M., 1995, ApJ, 447, L87
- (50) Miller B.W., Rubin V.C., 1995, AJ, 110, 2692
- (51) Oke J.B., 1974, ApJS, 27, 23
- (52) Osterbrock D.E., 1974, Astrophysics of Gaseous Nebulae, W.A. Freeman ed., San Francisco
- (53) Pagan A., 1994, Laurea thesis, University of Padova.
- (54) Pfenniger D., Friedli D., 1991, A&A, 252, 75
- (55) Plana H., Boulesteix J., 1996, A&A, 307, 391
- (56) Richter G., Longo G., Lorenz G., Zaggia S., 1992, The Messenger, 68, 48
- (57) Roberts M.S., Hogg D.E., Bregman J.N., Forman W.R., Jones C., 1991, ApJS, 75, 751
- (58) Sandage A., 1961, The Hubble Atlas of Galaxies (Washington: Carnegie Institut of Washington)
- (59) Taniguchi Y., Murayama T., Nakay N., Suzuki M., Kameya O., 1994, AJ, 108, 468
- (60) Thronson H.A. Jr., Telesco C.M., 1986, ApJ, 311, 98
- (61) Thuan T.X., Sauvage M., 1992, A&AS, 92, 749
- (62) Vega J.C., Corsini E.M., Pizzella A., Bertola F., 1997, A&A, 324, 485
- (63) Wakamatsu K., Hamabe M., 1984, ApJS, 56, 283
- (64) Wright E.L., 1989, ApJ, 346, L89
- (65) Young J.S., Xie S., Kenney J.D., Rice W.L., 1989, ApJS, 70, 699
- (66) Zwicky F., Karpowicz M., Kowal C.T., 1965, Catalogue of Galaxies and Clusters of Galaxies, vol. 5 (Pasadena: California Institute of Technology)