Infrared spectroscopy of NGC 4151:
Probing the obscured ionizing AGN continuum
Abstract
The ISO-SWS111Based on observations made with ISO, an ESA project with instruments funded by ESA member states (especially the PI countries: France, Germany, The Netherlands and the United Kingdom) and with the participation of ISAS and NASA. The SWS is a joint project of SRON and MPE. infrared spectroscopic observations of the nucleus of Seyfert galaxy NGC 4151, which are described in a companion paper, are used together with a compilation of UV to IR narrow emission line data to determine the spectral shape of the obscured extreme-UV continuum that photoionizes the narrow line emitting gas in the active galactic nucleus. We present a new method to determine the best fitting photoionizing continuum and emission line cloud model from a heterogeneous set of emission line data.
For NGC 4151, we find a best-fit model that reproduces the observed line fluxes to within a factor of 2 on average, and which is consistent with the observed geometry of the optical Narrow Line Region (NLR). Our model consists of a clumpy, optically thick (ionization bounded) gas distribution, with a hydrogen gas density of cm-3 and a volume filling factor of .
Our best fitting spectral energy distribution (SED) falls sharply beyond the Lyman limit and then rises sharply again towards 100 eV. In particular, it does not display a ‘Big Blue Bump’ signature of a hot accretion disk. We find that this SED, which best reproduces the NLR line emission on the 100–500 pc scale, does not have enough UV photons to produce the observed BLR recombination emission from the inner 1 pc. This suggests that the BLR is photoionized by the intrinsic continuum source, which does have a strong UV component (perhaps a Big Blue Bump), but that this UV component is absorbed by material located between the NLR and BLR. Our analysis suggests that the absorber consists of cm-2 of neutral hydrogen. Such an absorber was independently detected by UV absorption lines (Kriss et al. Kriss (1992, 1995)).
Using our new method, we confirm our previous conclusion that a Big Blue Bump is present in the SED of the Seyfert 2 galaxy Circinus.
1 Introduction
The intrinsic spectral energy distribution (SED) of active galactic nuclei (AGNs), which extends from the radio up to -rays, cannot be observed from the Lyman limit and up to several hundred eV due to Galactic and intrinsic absorption. It is widely assumed that the intrinsic SED in this range is a superposition of a bump and one or more power-law components (Figure 1). The hypothetical bump is known as the ‘Big Blue Bump’. The deviation from the hypothetical power-law at the high energy wing of the bump is known as the ‘soft excess’. This latter feature receives special attention because it may be within the observable soft X-ray range.
There are theoretical and observational motivations for the bump plus power-law hypothesis. Generically, thermal radiation from accretion on a black hole has a typical effective temperature that is related to the typical size of the emitting region and to the accretion luminosity by . Order of magnitude estimates, as well as more detailed accretion disk models, suggest that typical AGN accretion temperatures should be of order K, corresponding to a Wien bump peaking at eV (see e.g. Blandford BNW (1990) for a review). However, thermal bumps may be absent if the accretion is advection-dominated (Narayan & Yi NY (1995); Narayan, Kato & Fumio NKH (1997)).
The power-law components are suggested by the observed shape of the SED at the optical-UV and soft to hard X-ray continua, which in many cases have different spectral indices. The power-law continua are thought to be produced by inverse Compton scattering of accretion disk emission. Observationally, there are indications that the mean optical–UV slope tends to be flatter than the mean soft X-ray slope (e.g. Puchnarewicz et al. Puchnarewicz (1996)). This suggests a break somewhere in between these two spectral ranges, on top of which a bump may be superimposed.
Two major issues motivate the efforts to uncover the ionizing SEDs of AGNs. The AGN paradigm postulates that AGNs are powered by an accreting super-massive black hole. Major advances have been made in recent years in establishing the existence of super-massive black holes in the nuclei of normal and active galaxies (Kormendy & Richstone KR (1995); Miyoshi et al Miyoshi (1995); Eckart & Genzel EG (1996)). On the other hand, there is little direct evidence to support the accretion hypothesis. A detection of a signature of the accretion mechanism in the SED will have important implications both for validating the AGN paradigm as well as for discriminating between various accretion models. The ionizing SED is also important for modeling the effects of the AGN on its environment, since the SED is a critical input for photoionization models. Such modeling is a major tool in the study of AGN emission lines and in attempts to disentangle the contribution of the nuclear emission from that of starbursting regions in ultra-luminous IR galaxies (Lutz et al. 1996a ; Genzel et al. Genzel (1998)).
The spectral range of the SED that is accessible to direct observations can be maximized in the soft X-ray regime by observing nearby Seyfert galaxies, and in the UV by observing high redshift AGNs (e.g. Zheng et al. Zheng (1997)), although this is limited by inter-galactic absorption. Even so, a large gap remains. Almost all the current information on the SED in this gap comes from combining UV and X-ray data, following two basic approaches. The first is to interpolate, assuming some model, between the UV and X-rays. The second is to look for correlations between the continuum slopes at the optical-UV and X-rays.
A survey of results from recent X-ray studies (Walter & Fink WF (1993); Laor et al. LFEWM1 (1994); Walter et al. WOCFMOW (1994); Puchnarewicz et al. Puchnarewicz (1996); Laor et al. LFEWM2 (1997); Brunner et al. Brunner (1997)) reveals a confusing picture. Answers to the key observational questions: Is there a bump? Is there a soft excess? What is the object-to-object scatter in bump temperature? Is intrinsic absorption significant?, vary greatly. As a consequence, answers to key theoretical questions, such as the consistency of the SEDs with accretion models and the origin of the object-to-object scatter, also remain inconclusive. There are several possible reasons for this. One is the strong and rapid variability of AGNs in the X-rays. To date, very few AGNs have been observed simultaneously in the the UV and X-rays (NGC 4151 is one of them). Another problem is the very low spectral resolution of current X-ray spectroscopy, which requires a-priori models of the SED and of the galactic absorption to reconstruct the spectrum. As a result, the conclusions are strongly model dependent and many different models fit the data equally well (see e.g. Walter et al. WOCFMOW (1994)). Because of this ambiguity, the interpolation approach has been primarily applied to samples of AGNs rather than to individual objects. The correlation approach is, by definition, statistical and applicable only to AGN samples. Therefore, both approaches are vulnerable to the statistical pitfalls of sample analysis, such as selection effects and small sample fluctuations. It is widely suspected that selection effects play an important role in biasing the results of X-ray sample studies (e.g. Puchnarewicz et al. Puchnarewicz (1996)). If this is true, then there must be a large variety of AGN SEDs. This raises doubts whether the sample mean is a useful quantity for describing such a heterogeneous population. In this situation, a method that can be applied to an individual object rather than to AGN samples can be extremely useful. It is in this that IR spectroscopy can play a role.
Following the first detection of in NGC 4151 (Oke & Sargent OS (1968)), it became apparent that AGNs emit optical lines from highly ionized species (‘coronal lines’). More recently, IR coronal lines have been detected with ground based telescopes (Oliva & Moorwood OM (1990), Oliva et al. Oliva (1994), Reconditi & Oliva RO (1993)), and photoionization models predicted that many additional lines were likely to be observed in the spectral range covered by ISO (e.g. Spinoglio & Malkan SM (1992), Greenhouse et al. Greenhouse (1993), Voit Voit (1992)). The observed line ratios point to photoionization rather than collisional ionization as the dominant ionization mechanism (Oliva et al. Oliva (1994)). In this case, each of these lines probes the SED at energies , where we designate by the ionization energy required to produce the emitting ion from the preceding ionization stage. Figure 2 demonstrates that the gap in the SED of NGC 4151 is well covered by the observed optical and IR lines. Therefore, by fitting a photoionization model to the observed lines, it should be possible to constrain the SED.
With this in mind, our ISO-SWS program on bright galactic nuclei included detailed spectroscopic observations of several AGNs. The results from a pilot study of the nearby Seyfert 2 Circinus Galaxy (Moorwood et al. Moorwood (1996)) demonstrated the potential of this approach to the reconstruction of the ionizing SED. Here we extend this method to NGC 4151, one of the brightest, closest and most extensively studied Seyfert galaxies. The ISO-SWS observations of NGC 4151 are presented in a companion paper (Sturm et al. Sturm (1998), Paper I), which compares the IR emission line profiles to optical line profiles and derives constraints on models of profile asymmetry. In this work, we add observed UV, optical, near-IR and far-IR lines from the literature to the mid-IR SWS lines, and perform an extensive search in parameter space to find the best fitting SED.
The rest of this paper is organized as follows. The observed properties of Seyfert galaxy NGC 4151 and the inferences about its physical conditions are discussed in Sect. 2. The observed emission line fluxes compilation and the criteria for selecting the lines to use in the modeling are described in Sect. 3. The photoionization models and the way they are compared to the data are described in Sect. 4. The results are presented in Sect. 5, discussed in Sect. 6 and summarized in Sect. 7.
2 The physical properties of NGC 4151
Although NGC 4151 is often called the ‘classical’ Seyfert galaxy, it displays a variety of properties typical of different AGN classes. It may therefore be in fact more complex than average. We present here a brief overview of its properties that are relevant to this work.
NGC 4151 is a barred spiral galaxy, which is seen almost face on (Pedlar et al. Pedlar92 (1992)) at redshift (distance Mpc) and magnitude (Brinkmann et al. Brinkmann (1995)). Its spectrum is dominated by the non-stellar component (Kaspi et al. Kaspi (1996)). NGC 4151 is highly variable in both the continuum and the broad emission lines. Originally classified as an intermediate, Seyfert 1.5 galaxy (Osterbrock & Koski OK (1976)), it went through an extreme low state in 1984, where it took on the characteristics of a Seyfert 2 galaxy (Penston & Pérez PP (1984)). Currently, NGC 4151 is usually grouped in the Seyfert 1 class.
2.1 The ionizing continuum
The December 1993 multi-wavelength campaign to monitor this variability (Crenshaw et al. Crenshaw (1996); Kaspi et al. Kaspi (1996); Warwick et al. Warwick (1996); Edelson et al. Edelson (1996)) yielded a simultaneous SED extending from the optical to -rays. NGC 4151 was observed in the optical from Wise Observatory and Lowell Observatory, in the UV by IUE, in X-rays by ROSAT and ASCA and in -rays by CGRO. Warwick et al. (Warwick (1996)) deconvolved the X-rays to -rays spectrum by assuming an powerlaw and a thermal bremsstrahlung component with a temperature of 0.5 keV, absorbed by a two component intrinsic absorber (‘partial covering model’) and by galactic neutral hydrogen.
In order to extend the spectral coverage up to the Lyman limit, we used the 1995 HUT best-fit power-law continuum (Kriss et al. KDZKE (1995)), which we added to the 1993 SED after normalizing them to the IUE flux at the line-free wavelength of 1806Å . A large uncertainty is associated with this flux value due to variability and reddening. The 1995 UV continuum was times more luminous and much bluer than it was in 1990 (Kriss et al. Kriss (1992)). By fitting a power-law continuum to the HUT data, Kriss et al. (Kriss (1992)) derive , which they use to deredden the SED. This amounts to a factor of 1.3 increase in the flux at 1806Å . However, estimates of the reddening vary greatly (Sect. 2.3). In view of these problems, we treat the flux at 1 Ryd as another source of uncertainty in the model, which is investigated by the model fitting procedure described in Sect. 4.2.
Figure 1 shows the composite SED, where for compatibility with Edelson et al. (Edelson (1996)), we plot the SED as , where is the observed flux density in erg s-1 cm-2 Hz-1 and Mpc. The SED displays the typical strong optical-UV emission lines of a Seyfert galaxy and significant intrinsic absorption below 4 keV. Above 4 keV, a hard power-law extends up to a cutoff at keV. Also visible are X-rays emission lines at keV. Figure 1 also shows a schematic sketch of a superimposed Big Blue Bump and a powerlaw spectrum, constructed by superimposing a power law spectrum, and 5 blackbody spectra normalized to have equal total luminosities, , with K. Note that the shape of the excess emission above the power-law depends in part on the way the SED is presented. A bump in may appear only as a ‘shoulder’ or a flattening in . Here, we use the term ‘bump’ irrespective of the presentation of the SED.
2.2 The galactic nucleus
The line spectrum of NGC 4151 points to the existence of the three kinematically distinct nuclear emission regions that are observed in many Seyfert galaxies: an unresolved Broad Line Region (BLR) with typical line widths of km s-1, densities above cm-3 and an ionization parameter (see below) –, a Narrow Line Region (NLR) with typical line widths of km s-1, densities in the range to cm-3 and –, and an Extended Emission Line Region (EELR) with typical line widths of km s-1, densities below cm-3 and (Schulz & Komossa SK (1993)). The line widths of the SWS forbidden IR lines point to an origin in the NLR. This is supported by estimates of the gas density from the line ratios (Sect. 2.3) and is consistent with the small critical densities ( cm-3) of the mid-IR fine-structure line transitions, which are incompatible with the BLR. However, the very large aperture of the SWS includes also the EELR, and some contribution from the EELR cannot be ruled out, especially for the lower ionization lines.
Narrow band images in the [O ii], [O iii] and Balmer lines (Heckman & Balick HB (1983); Pérez et al. Perez (1989); Unger et al. Unger (1989); Pérez-Fournon & Wilson PW (1990); Yoshida & Ohtani YO (1996); Hutchings et al. Hutchings (1998)) show that NGC 4151 has an elongated, knotty EELR which extends along PA up to to the SW of the nucleus, but only up to to the NE. The NLR symmetry axis coincides with the radio jet at PA (Pedlar el al. Pedlar93 (1993)), but is misaligned with the EELR. This misalignment is consistent with a very wide ionization cone with an opening angle , intercepting the galactic disk at grazing incidence (Pedlar et al. Pedlar92 (1992), Pedlar93 (1993)). Images show that the opening angle of the line emitting conical section of the galactic plane is (Hutchings et al. Hutchings (1998)). The profile, which traces the velocity field (Schulz Schulz90 (1990)) and the line ratio, which traces (Robinson et al. Robinson (1994)), both indicate a NLR size of . An map of the inner nucleus reveals NLR emission from of the nucleus up to (Hutchings et al. Hutchings (1998)). These size estimates are unlikely to be affected significantly by projection, since the inclination angle of the galactic disk at the inner few arcsec is estimated at , and the NLR symmetry axis is within a few degrees of the line of nodes (Boksenberg et al. Boksenberg (1995)).
The volume filling factor of the NLR gas, , which is defined as the fraction of the volume actually filled with gas222By definition, , the ratio of the volume averaged rms electron density to that of the local one. is estimated from emission line ratios, while is estimated from the observed flux of a recombination line, , and the angular size of the line emitting region,, from . This introduces an dependence to the estimate of the filling factor ., is very small. Yoshida & Ohtani (YO (1996)) estimate based on the low excitation , and maps. Similarly, Robinson et al. (Robinson (1994)) find in an knot at the edge of the NLR. Thus the low excitation NLR lines are emitted from a very clumpy distribution of gas. Unfortunately, narrow band images or position-resolved long-slit spectroscopy of coronal lines are not yet available for NGC 4151, so their NLR size and filling factor cannot be estimated directly. However, an upper limit on the size of the coronal line emitting region can be estimated from the low ionization NLR lines with the plausible assumption that the high ionization emission is more compact. This is indeed observed in the spatial distribution of the line relative the line (Hutchings et al. Hutchings (1998)), and is observed in the coronal lines of the Circinus galaxy (Maiolino et al. Maiolino (1998)).
Spatially resolved maps of the line emission in the NLR and EELR make it possible to estimate the anisotropy parameter , defined as the ratio between the ionizing luminosity that the gas must see in order to emit the observed line flux, and that directed at the observer. There are indications that the anisotropic bi-conic structure of the NLR and EELR traces an anisotropy in the photoionizing luminosity (as opposed to an anisotropy in the matter distribution). Estimates of vary greatly since they strongly depend on the assumed intrinsic continuum (usually interpolated over the gap in the SED by a power-law) and the photoionization model of the NLR /EELR. Schulz & Komossa (SK (1993)) derive , Yoshida & Ohtani (YO (1996))) derive , Penston et al. (Penston90 (1990)) derive , and Robinson et al. (Robinson (1994)) obtain and by two different methods.
Strong absorption on the line of sight in the optical, UV and X-ray bands implies the existence of a multi-component system of absorbers that may also modify the ionizing SED in other directions. Warwick et al. (Warwick (1996)) fit the X-ray SED with a two component absorber of total hydrogen column density in the range to cm-2. The location of this absorber along the line of sight is unknown. Kriss et al. (Kriss (1992)) fit the Lyman absorption lines with an outflowing clumpy and dense absorber ( cm-3) with a neutral hydrogen column density in the range to cm-2, which covers a large fraction of the continuum source and the BLR along the line of sight. Both the high density and the outflow velocity suggest that the absorber is between the BLR and NLR. The properties of this absorber are incompatible with that of the X-ray absorber, and it must be assumed that these are two different components. HUT observations of NGC 4151 at a later epoch (Kriss et al. KDZKE (1995)) show that the properties of the absorber appear to change in time, possibly in response to changes in the continuum luminosity, and indicate the possible presence of an additional component with neutral hydrogen column density of up to cm-2.
2.3 The line emitting gas
The ISO spectra can be used to estimate the gas density and temperature, given estimates of the reddening and starburst contribution to the line emission.
Estimates of the reddening of the NLR in NGC 4151 range from almost negligible, (Kriss et al. KDZKE (1995)), 0.05 (Penston et al. Penston81 (1981); Wu & Weedman WW (1978); Boksenberg et al. Boksenberg78 (1978)), to considerable, (Kaler Kaler (1976)), 0.13 (Malkan Malkan (1983)), and 0.09 to 0.28 (Ward et al. Ward (1987)). The elemental abundances and the internal dust content of the line emitting gas are even less certain. In a study of the Circinus galaxy, Oliva et al (Oliva (1994)) find that the coronal line emitting gas is dust free and has solar abundances to within a factor of . Similarly, Ferguson et al. (FKF (1997)) compare an extensive grid of coronal line photoionization models to observed line ratios in several Seyfert galaxies and conclude that dust is unlikely to exist in coronal line emitting gas, and that the Si and Ca abundances are solar to within a factor of . The NGC 4151 EELR models of Schulz & Komossa (SK (1993)) point to a solar metallicity for all metals (consistent with metal poor gas, but not with dust depletion). In our models, we will assume that the abundances are solar and that the gas is dust free.
The stellar population in the nucleus of NGC 4151 can affect the observed line fluxes in two ways. First, the presence of star-formation regions within the large ISO-SWS aperture can introduce line emission due to radiation fields peaking at Ryd, which are typical of hot stars (if these regions are shielded from the central continuum). An upper limit on the starburst contribution to the lower ionization lines can be estimated from the upper limits on the PAH emission, which are tracers of star forming activity (Roche et al. RASW (1991); Genzel et al. Genzel (1998)). The mean observed ratios of the integrated line flux to that of the PAH feature in starburst galaxies M83, NGC 4945, NGC 3256 and NGC 7552 (see also Genzel et al. Genzel (1998)) are /PAH m = 0.07 /PAH m = 0.22, as compared to the NGC 4151 lower limits of /PAH and /PAH , the latter value being much less certain. The more reliable upper limit on the PAH m flux leads to an upper limit of % of starburst contribution to in NGC 4151. This is supported by the [O iii], and line ratios and maps in the bright knots of the EELR, which point to photoionization by the central source rather than photoionization by hot stars (Schulz Schulz88 (1988); Pérez et al. Perez (1989); Pérez-Fournon & Wilson PW (1990)). Second, a strong underlying stellar continuum may affect the flux measurements of the optical lines. Robinson et al. Robinson (1994) fit the off-nuclear continuum ( SW of the center) by an old stellar population and conclude that the effect of absorption features on the emission line flux measurements is negligible. Thus, stars are unlikely to affect the reconstruction of the SED.
Three density-sensitive pairs of bright lines of the same ion are found among the NGC 4151 emission lines detected in the ISO-SWS wavelength range: [Ne v] m, [Ne iii] m, and [S iii] m. We also consider the [O iii] m pair observed with ISO-LWS by Spinoglio et al. (Spinoglio (1998)). Among these observations, the [Ne v] ratio is perhaps most interesting since it samples a NLR species with an ionization energy near 100 eV. However, for NGC 4151 with its apparently very small contribution of star forming activity to the emission line spectrum, the [Ne iii], [S iii], and [O iii] ratios are valuable NLR diagnostics as well. Figure 3 shows the density dependence for these ratios, computed by solving the rate equations for five level systems. Transition probabilities and collision strengths have been taken from Mendoza & Zeippen (MZ (1982)) ([S iii]), Galavis et al. (GMZ95 (1995)) ([S iii]), Galavis et al. (GMZ97 (1997)) ([Ne iii], [O iii], [Ne v]), Butler & Zeippen (BZ (1994)) ([Ne iii]), and Lennon and Burke (LB (1994)) ([Ne v], [O iii]). ISO observations of the planetary nebula NGC 6302 (Pottasch et al. Pottasch (1996)) support the Lennon & Burke collision strengths for [Ne v] that were previously questioned by Oliva et al. (OPR (1996)).
The [O iii] ratio of 1.5 measured by Spinoglio et al. (Spinoglio (1998)) for NGC 4151 corresponds to a density of about 450 cm-3. The other ratios should be near their low density limits at such densities and hence of little use to further constrain the density of the NLR gas in NGC 4151. Indeed, the measured ratios [Ne v], [Ne iii], [S iii] of 0.98, 5.9 and 0.67, respectively, are close to their low density limits, and consistent with the [O iii] density. For simplicity and since [O iii] may tend to sample slightly lower density extended regions when compared to higher ionization species, we adopt an electron density of 1000 cm-3 for our modelling. This is still well below the critical densities of the lines we model.
The infrared ground state fine-structure line fluxes are insensitive to the electron gas temperature for K. However, the optical forbidden line intensities, which originate from higher energy levels, are sensitive to the gas temperature of K in photoionized gas. The ratios of optical and infrared transition may therefore be useful diagnostics of the gas temperature. The dominant uncertainty in such an analysis is often the reddening correction to be applied to the optical fluxes. Because of the low extinction to the NLR of NGC 4151, for which we adopt (see above), a temperature analysis based on such an optical/infrared comparison appears promising. The four species discussed above emit optical lines which are in principle suitable. The optical/IR ratios of [S iii] Å and [S iii]Å to and and of Å and Å to [O iii] m and [O iiim, however, are of limited diagnostic value at the density of the NGC 4151 NLR and electron temperatures in the range 10000-20000 K, since the temperature dependence is small compared to the density dependence and compared to the effects of possible problems in inter-calibration of optical and infrared measurements. In case of [Ne v], a suitable large aperture measurement of the 3426Å transition is not available. It is hence not possible to test claims of very high in the highly ionized region that are based on analysis of optical [Fe vii] lines in several Seyferts (Erkens et al. EAW (1997)).
A robust diagnostic is the [Ne iii]Å / m ratio which is basically density-insensitive (Figure 4). We adopt the 3868Å flux of Oke & Sargent (OS (1968)) (Table Infrared spectroscopy of NGC 4151: Probing the obscured ionizing AGN continuum) and correct for . Taking into acount this uncertainty in extinction, and an additional 30% calibration uncertainty which we have added directly, we use the [Ne iii] ratio to derive an electron temperature of 130002500 K, with lower electron temperature obtained for lower adopted extinction. It is instructive to compare this value to the classical NLR temperature diagnostic that uses the optical [O iii]Å / 5007Å ratio, since the two species require similar ionization energies for their creation and should sample a similar part of the NLR. Correcting the 4363Å / 5007Å ratio of 0.03 (Oke & Sargent OS (1968)) for , we infer an [O iii] electron temperature of about 19000 K. We caution however that this number may be very uncertain due to the faintness of the 4363Å line. Similarly high [O iii] electron temperatures in NLRs and EELRs (e.g. Storchi-Bergman et al. (SWMB (1996)), using a more careful treatment of the [O iii]Å line) have been used to put fairly strong constraints on photoionization scenarios (e.g. Binette et al. BWS (1996)), or to reject them entirely. An electron temperature of 13000 K as obtained from the optical/IR [Ne iii] ratio is however reproduced by fairly standard photoionization models, thus avoiding the need for more complex scenarios. Clearly, an extension of this analysis to other AGNs is highly desirable to investigate this discrepancy.
3 The observed line flux compilation
The advantage of the IR lines as diagnostics of the gas and SED lies in their insensitivity to the gas temperature and to external reddening. However, this also means that they cannot constrain these physical parameters. In particular, UV and optical lines are needed to fix . In order to maximize the observational constraints on the models, we added to the measured mid-IR lines observed UV, optical and NIR lines from the literature, as well as recently measured far-IR lines. We initially compiled a list of about 120 observed emission lines: UV lines from Kriss et al. (Kriss (1992)), optical lines from Oke & Sargent (OS (1968)), Anderson (Anderson (1970)), Netzer (Netzer74 (1974)), Boksenberg et al. (BSAFPS (1975)), Osterbrock & Koski (OK (1976)); NIR lines from Osterbrock, Shaw & Veilleux (OSV (1990)), Thompson (Thompson (1995)). In addition, we included some far-IR lines observed by the ISO Long Wavelength Spectrometer (LWS) (Spinoglio et al. Spinoglio (1998)).
Various problems stand in the way of merging these different observations into a self-consistent data set that can be compared with the model results. The observations span some thirty years, and the spectra were taken with a variety of instruments and reduction techniques, at different resolutions and with different apertures. The UV lines were measured with an aperture of (Kriss et al. Kriss (1992)). The apertures of the optical and near-IR spectra (in those papers where quoted), range from (Boksenberg et al. BSAFPS (1975)) to (Anderson Anderson (1970)). The NIR spectra were taken with long slits, ranging from (Thompson Thompson (1995)) to (Osterbrock, Shaw & Veilleux OSV (1990)). The apertures of the SWS ( to ), and LWS () are much larger and cover the entire nucleus (See Figure 1 in Sturm et al. Sturm (1998)). Since the EELR emission in NGC 4151 is very extended and inhomogeneous, these aperture differences cannot be corrected by simply normalizing the fluxes to the aperture size. Here we attempt no such correction. This can be justified by noting that Yoshida & Ohtani (YO (1996)) find that 83% and 78% of the and emission in the central of the nucleus, respectively, is emitted from the NLR in a region centered on the continuum source. We expect that the higher ionization species will be even more centrally concentrated and conclude that the overall error in the line flux measurement that is introduced by the aperture differences is smaller than 20% for all but the smallest apertures.
Broad / narrow component decomposition, variability and absolute flux normalization are three other inter-related problems. The narrow component was separated only in the strongest broad lines, while the quoted values of the weaker permitted lines include both components. Profile decomposition is an uncertain procedure even under ideal conditions. In the case of NGC 4151, it is further complicated by its high variability. In particular, the 1984 low state of NGC 4151 occurred at the middle of the epoch covered by the observations cited above. Most of the optical lines are given only relative to the narrow or full line. The absolute flux value is given only in a few cases, so that the inter-calibration of these measurements is uncertain. Finally, in most cases no measurement errors are given.
Our choice of the lines to include in the modeling is guided by four criteria. First, we want to consider only lines that are primarly formed by photoionization by the extreme-ultraviolet and soft X-ray continuum of the central source. We exclude all lines emitted from ions with eV, since these can be easily ionized by other processes. In particular, this criterion leads to the exclusion of the far-IR O i m, O i m and C ii m lines, which are produced mainly in neutral photon-dominated regions (PDRs) (Tielens & Hollenbach TH (1985); Sternberg & Dalgarno SD (1989)) and in X-ray dissociation regions (Maloney, Hollenbach & Tielens MHT (1996)). Second, we want to consider only lines with reliable flux measurements. This leads to the exclusion of all optical lines taken with spectral resolution worse than 20Å, those with fluxes lower than 1/4 of the narrow flux, or permitted lines whose narrow component was not decomposed from the broad one. The HUT narrow UV lines (Kriss et al. Kriss (1992)) are somewhat problematic in this respect, since their FWHM is 1.5 to 3 times larger than that of the NLR forbidden lines (c.f. Paper I). Although this may indicate a problem in their decomposition we choose to retain these measurements because of the importance of UV data for constraining the reddening. We exclude the two weakest ISO-SWS lines, and , which have a low S/N. Third, we require that the line measurements not be too inconsistent with the large SWS and LWS apertures. This criterion leads to the exclusion of all optical lines taken with apertures whose smaller dimension is less than , which unfortunately include the important He ii line. The eV criterion also helps in this respect by decreasing the contamination of EELR line emission. Fourth, we need to take into account the limitations of the photoionization models. This leads to the exclusion of the Å and Å lines, whose collision strengths values are highly uncertain. The final, much shortened line list is given in Table Infrared spectroscopy of NGC 4151: Probing the obscured ionizing AGN continuum. Whenever more than one measurement of the line exists, we quote the average flux and use the rms scatter as an error estimate. We list also some of the lines and upper limits that are not used in the model fits, so that their consistency with the model results can be checked.
4 The photoionization models
4.1 The SED / cloud models
Two basic ingredients have to be specified for calculating the photoionization models: the gas, or ‘cloud’ properties and the ionizing SED. The main objective of this work is to reconstruct the ionizing SED of NGC 4151 as model-independently as possible. However, cloud models must be adopted in the analysis, and these introduce some uncertainties in the reconstructed SED. The cloud models we consider here (Figure 5) are probably too simple to fully reproduce the rich observed nuclear structure, but they allow us to assess the robustness of the reconstructed SED to the uncertainties of modeling the gas.
In the cloud models that are described below, we distinguish between compact and clumpy gas models. In a compact gas model the entire cloud volume is filled with gas, that is, its filling factor is unity. In a clumpy gas model, , and the cloud can be described as composed of many ‘cloudlets’, or alternatively as having a porous, sponge-like structure. Only the total column density of the cloud is specified. The photoionization calculations assume infinitesimal cloudlets (or holes) that are randomly and uniformly distributed in the cloud volume. In this limit, only enters the photoionization calculations by modifying the volume emissivity and the optical depths (Ferland Ferland (1996)). Although the cloud as a whole may be optically thick, the cloudlets can be thought of as a system of optically thin clouds that filter, but do not entirely absorb, the ionizing radiation, and then transmit it to cloudlets further to the back of the cloud. This picture is physically relevant as long as the illuminated cross-section of the cloud is not too small relative to its depth, since it is unlikely that a thin filament of cloudlets can remain perfectly aligned so as to have the specified total column density. A clumpy gas distribution ‘stretches’ a given column density over a larger physical distance relative to that of a compact cloud. Therefore, the geometrical dilution of the radiation is larger, and hence the ionization structure of the gas and its emission line spectrum are modified.
We consider four types of clouds.
-
1.
Constant density, optically thick clumpy clouds (i.e. ), distributed on a spherical shell of radius centered on the continuum source.
-
2.
Constant density, optically thick compact clouds (i.e. ), similarly distributed.
-
3.
Optically thick compact clouds, similarly distributed, with a density gradient that increases linearly into the cloud (i.e. away from the illuminated surface),
(1) where is the gas density at the irradiated surface, is the distance into the cloud and the gradient. Such models may approximate clouds with evaporating irradiated surfaces (Binette, Wilson & Storchi-Bergmann BWS (1996)) or a density stratification due to radiation pressure (Binette et al. BWRS (1997); Binette Binette (1998)).
-
4.
Two components of constant density, optically thick compact clouds, distributed on two spherical shells of radii , where it is assumed that the SED seen by component 2 is the same as that seen by component 1, with no obscuration but with geometrical dilution.
Realistically, the clouds are likely to have a distribution of densities and positions relative to the central continuum source. However, these simple models may be justified by noting that the large aperture of the SWS (and to a lesser degree the smaller apertures of the optical and NIR spectrometers) integrates over this population. The validity of these models then rests on the assumption that the population average can be approximated by a single, representative cloud type.
We model here only ionization bounded (IB) clouds (i.e. optically thick clouds). Matter bounded (MB) cloud models (i.e. optically thin clouds) have been proposed in response to discrepancies between the observations and the predictions of NLR / EELR single component models, which assumed a simple power law SED (Viegas & Prieto VP (1992); Binette et al. BWS (1996)). Those models typically under-predict the high ionization lines, under-predict the electron temperature and under-predict the scatter in the ratio among Seyfert 2 galaxies. An additional MB component comes at the price of three additional free parameters: the column density of the matter bounded clouds, their fraction relative to the IB clouds and the fraction of IB clouds that see the filtered radiation from the back of the MB clouds relative to those that see the unfiltered radiation. In view of the considerable complexity introduced by these additional free parameters, and because, as will be shown below, the high ionization lines are well modeled by the IB clouds while the gas temperature may not, in fact, be problematic in NGC 4151 (Sect. 2.3), we do not consider these types of models here.
In addition to the cloud geometry and density structure, it is necessary to specify the ionization parameter, which for isotropic emission is defined as
| (2) |
where is the ionizing photon emission rate (s-1) and is the speed of light. It is also necessary to specify the cloud column density , which we assume to be effectively infinite, the element abundances, which we assume to be solar, and the amount of dust, which we assume to be negligible.
The ionizing SED model we use here is based on the observed multi-wavelength SED of the 1993 campaign (Edelson et al. Edelson (1996)). In using it, we are making the assumption that this SED can be used to approximate the time averaged SED over time scales comparable to the light crossing time of the NLR, which is of the order of 1000 yr.
The enumeration on the SED assumes a four-segment broken power-law (Figure 6). The observed SED is adopted longward of 1 Ryd and shortward of 50 keV. In between these two limits, the enumeration proceeds by choosing all possible combinations of the three luminosity densities (erg s-1 Hz-1) at 4, 8, and 30 Ryd (, and , respectively) and connecting them by straight lines in the – plane. This yields a total of possible combinations. The break energies of 1 and 4 Ryd were chosen because they correspond to the H and He ii ionization edges. The break energy of 30 Ryd roughly brackets the highest ionization potential of the observed lines. The break energy of 8 Ryd is arbitrary and is intended to allow additional flexibility in the SED shape. The quantity varies between 25.4 and 26.0 in increments of 0.3. The lower limit for the range is obtained by extrapolating down to 30 Ryd a power-law using observations at 50 to 80 keV (longward of the power-law break at keV) and at keV (shortward of the absorption feature but still longward of the X-rays Fe emission lines). The upper limit on allows for possible errors in the determination of the continuum at keV. The values of and vary between 25.4 and 27.8 in increments of 0.2, thereby reaching values as high as that at 1 Ryd and as low as that at 30 Ryd. This allows the enumeration on the SED to explore the possibility of a very prominent bump, as well as that of a steeply falling continuum in the 1-30 Ryd range.
The photoionization calculations were carried out using the numerical photoionization code ION97, the 1997 version of the code ION described in Netzer (Netzer96 (1996)).
4.2 The fit procedure
The very large parameter space we investigate in this work makes it necessary to adopt a goodness-of-fit score to rank the models. There are, however, some difficulties in applying standard methods to the problem at hand. Both the measurement error estimates and those of the model are highly uncertain, and are probably non-Gaussian and dominated by systematic errors. Therefore, the commonly used score, which relies on the accuracy of the errors estimates, can be highly misleading. Furthermore, the model lines and the observed lines are not directly comparable, since the model calculations yield the line luminosity per unit area on the cloud’s cross-section, whereas the observations are of the line flux on earth. A standard procedure for comparing the two is to normalize all the line fluxes relative to the flux of some strong reference line, such as , which is roughly proportional to the total ionizing luminosity. However, in the case of NGC 4151, this is problematic because the narrow flux measurement is very uncertain due to the difficulty of decomposing the narrow and broad components. The observed forbidden optical and IR lines are also not suited for this purpose because of the large measurement errors. An error in the flux of the chosen reference line will bias all the line ratios, and because of the highly non-linear behavior of the photoionization calculations, this is likely to have complicated effects on the best-fit SED. Moreover, the freedom of choosing the reference line adds ambiguity to the results, since there is no compelling reason for preferring one reference line over another.
Here we formulate and adopt a different fit procedure that does not rely on the accuracy of the measurement error estimates and treats all the lines on an equal footing. We assume that for the correct model and for ideal, error-free observations, the observed and model line fluxes are related by
| (3) |
where is the observed flux in line , is the model luminosity per unit surface area of the irradiated face of the cloud, and the exponent is the dereddening factor with given by the extinction curve at the line’s rest wavelength. The parameter is a proportionality factor common to all the lines. It has a simple geometrical interpretation in the framework of the cloud models we consider here. These models assume an isotropic line emission from clouds distributed on the surface of a sphere of radius , which is centered on the continuum source. In this case
| (4) |
where the covering factor, , is the fraction of the spherical surface covered by the clouds and is the distance of the AGN from the observer. Therefore,
| (5) |
The distance and the corresponding angular distance are fixed by the ionization parameter and the hydrogen gas density,
| (6) |
| (7) |
where is the anisotropy parameter of the ionizing luminosity (Sect. 2.2), and is the ionizing photon flux that would be observed if all the ionizing photons reached the observer. The parameter is a function of , and , which parameterize the SED. Equation 7 can be used to estimate if the other parameters are known independently. Here, this information is unavailable, and remains a free parameter. The covering factor is related to by
| (8) |
The depth of the ionized fraction of the gas distribution, , which is calculated by the photoionization code, can be used to estimate the angular extent of the NLR, ,
| (9) |
corresponds to the angular extent of the Balmer lines emission. Emission from higher ionization lines is more concentrated towards the inner part of the NLR.
We note that there exists a scaling relation between and (observations fix only up to a factor of ) that allows models, which differ only in these parameters, to have identical best-fit line fluxes and SEDs. This can happen when both and the geometrical dilution of the ionizing flux,
| (10) |
are unaffected by the changed parameters. Since scales as , remains constant if is also scaled as , which in turn implies that should scale as . Therefore, if scales as , the line ratios remain constant, while and scale as and as .
The search for the best combination of cloud model and SED proceeds by enumerating over various possible cloud models, whose input parameters are , , , , the number of gas components and their elemental abundances, and the ‘boundary conditions’ of the SED template, and . In addition, is required for calculating and and also for estimating the input value of from the observations. For each cloud model, we then enumerate over , and , and use a ‘goodness-of-fit’ score, which is described below, to find the values of , , , and that best fit the observed line fluxes. The observational constraints on and the derived quantities , and can then provide additional checks on the best fit values of these parameters.
Lacking reliable measurement and model error estimates, a natural measure of the match or mismatch between model and observations is simply the line ratios, . For this reason, photoionization models are commonly judged by their ability to fit the data to within a factor of , on average, where is considered to be a reasonable fit. We formalize this intuitive concept of a logarithmic scale by defining a score function
| (11) |
where is the number of lines used in the fit. The score is an explicit function of and and an implicit function of , , and the cloud model through the model line fluxes . An average fit factor , in the rms sense, is defined as
| (12) |
with the worst fitting line off by a factor of
| (13) |
It is straightforward to show that for a given set of model fluxes, , is minimized when and take the values
| (14) |
and
| (15) |
where the notation designates the average of the bracketed quantities over the lines, and it is assumed that not all the are equal. can formally take negative, non-physical values. In such cases we set it to zero, and re-minimize as a function of only, in which case
| (16) |
The search for the minimum of in , , , and proceeds by first calculating numerically for each point in (, , ) space and then analytically evaluating at each point using and .
is easily generalized to the case of two cloud components,
| (17) |
where are the mixture weights of the two components, which emit a line luminosity , per unit surface area, respectively. The covering factor of each component is given by Eq. (8) with or in place of . The score is minimized by numerically enumerating on possible values of , calculating and then proceeding as in the case of a single cloud component.
The errors on the best-fit parameters of a given cloud model, which are introduced by the measurement errors in the line fluxes, are estimated by Monte Carlo simulations (see e.g. Press et al. PTVF (1992)). A set of simulated observations are drawn using the best-fit parameters and the given measurement error estimates (or a conservative guess of a 50% error if such an estimate is unavailable),
| (18) |
where is a Gaussian deviate of zero mean and standard deviation equal to the quoted fractional measurement error of the line. The minimization procedure is then repeated with the given cloud model for each simulated set, and the best-fit parameters are recorded. The 99.9% confidence limits, which are quoted below, lie between the minimal and maximal values that the parameters take on the contour of constant that encloses 99.9% of the simulated results. The errors are given for each parameter separately and are not statistically independent. Note that this is the only aspect of the modeling where the measurement error estimates affect the results. Note also that the confidence limits on the SED are confined to the range covered by the SED enumeration (see Figure 6). The quoted confidence interval may in fact be smaller than the true one in places where it extends right up to the edge of the enumerated region. It should also be emphasized that the confidence limits are conditional, in the sense that they are calculated under the assumption of a given gas model and SED template. We present below errors only on the parameters , , , , , and . The Monte Carlo procedure can be easily generalized so as to obtain confidence limits on all the free parameters, including those of the gas model, , , and . However, because we test only a small number of values for these parameters, this is not attempted here.
The weighting strategy is a major concern in any fit procedure, including this one. The score assigns equal weights to the different lines. In doing so, we are ignoring the fact that some lines carry more physical information than others, and that the unequal spacing of the lines in over-emphasizes some energy ranges in the SED at the expense of others. Nevertheless, because it is unclear how to deal in a satisfactory and general way with these problems, and because of the simplicity and elegance of the fit, we choose to use the simplest option of equal weights. As will be shown in Sect. 6, we test the sensitivity of the best-fit SED to the weighting by dropping a subset of the lines from the fit (i.e. setting their weight to zero) and re-fitting. We find that the best-fit SED is insensitive to these changes.
A combined SED and cloud model is considered successful if it fulfills the following criteria.
-
1.
The model fits the lines to within a factor of 2, on average ().
-
2.
The worst fitting line is off by no more than a factor of 3 ().
-
3.
The covering factor is less than 0.25, which corresponds to a bi-cone with an opening angle of ().
-
4.
The angular distance of the illuminated face is consistent with the inner radius of the NLR ().
-
5.
The angular extent of the line emitting gas is consistent with the size of the NLR ().
-
6.
The extinction is small ().
We also attempt to detect systematic trends in the residuals, or remaining discrepancies, of the best-fit model. This is done by calculating the correlation between the best-fit ratios, , and the line properties , and the element’s tendency for depletion. These test, respectively, for problems with the assumed extinction law, problems with the assumed SED parameterization, and problems with the elemental abundances (assumed solar), which may be depleted by dust. In order to minimize the sensitivity of these tests to numeric uncertainties and to assumptions on the nature of the correlations (e.g. linear in the logarithm of the quantity vs. linear in the quantity itself), we use the non-parametric Kendall’s correlation coefficient (see e.g. Press et al. PTVF (1992)). Using this estimator, the possibility of depletion is simply tested by correlating the best-fit ratios (after summing line fluxes from the same element) with the depleted abundances, which we take to be those of the Galactic interstellar medium given by Spitzer (Spitzer (1978)). A negative correlation is expected if the true abundances are depleted. The residuals of the correct model should not display any such correlations.
5 Results
The cloud models that we investigate in this work (Table 2) include clumpy and compact single component models with constant density, compact single component models with a density gradient, and two component models that result from mixing pairs of compact, single component constant density models. The ionization parameters lie in the range to and the filling factors in the range to . We assume density profiles of the form , where cm-3 and cm or , the latter corresponding to the constant density case. We assume throughout , isotropic source emission (), solar abundances, no dust, and use a column density that is large enough to absorb all the ionizing radiation. For each of these cloud models, we enumerate on the SED template (Figure 6), calculate the resulting line fluxes with the photoionization code and perform the fit procedure. The extinction curve used for dereddening is based on Seaton (Seaton (1979)) for the UV and optical and Lutz et al. (1996b ) for the IR. Because of the uncertainty involved in inter-calibrating the optical and ISO flux measurements, we repeat the fit procedure twice, once using only the ISO line list (‘ISO fit’) and once with the full ISO and optical line list (‘full fit’). This also allows us to assess the sensitivity of the equal weighting scheme that underlies the score.
The range of ionization parameters was chosen after spot-checks indicated that lower models severely under-produce the high ionization lines emission, while higher models over-produce them. The filling factor corresponds to that used to model the Circinus SED by Moorwood et al. Moorwood (1996), and that of is the value inferred for the low excitation clouds of the NLR in NGC 4151 (Yoshida & Ohtani YO (1996)); Robinson et al. Robinson (1994)). We also made some spot-checks with models of higher and lower densities ( and cm-3) and larger and smaller density gradients ( and cm). These modified models gave qualitatively similar results to the models included in the grid, and will therefore not be further discussed.
5.1 Single component models
The best-fit scores of the single component models are listed in Table 2. As expected, the ISO fits, which are less constrained, have better scores than the full fits. Of the six fit criteria (, , , , and ), is the least restrictive (Some high models have ISO fits with very large values, but these have very large errors). The covering factor points to models with low ionization parameter or small filling factor. The angular distance is uncomfortably large for the lowest models, and disfavor models with the lowest ionization parameters and constant density models with high filling factors. The most restrictive criterion turns out to be . Only models with the lowest filling factor have the large observed NLR size.
Taking into account all the criteria, the best model, for both the ISO and full fits, is that with , and a constant density. This particular choice of is somewhat arbitrary, as the higher models in the sequence fit almost equally well (see Sect. 6). The Balmer lines NLR emission in this model extends between to . The emission is more centrally concentrated, and extends only up to . This is consistent with the images of Hutchings et al. (Hutchings (1998)). The covering factor of this model, , implies that the gas fills almost the entire NLR bi-cone. With such a large cloud cross-section, the clumpy gas description is physically reasonable (Sect. 4.1).
The properties of the best-fit model are summarized in Table Infrared spectroscopy of NGC 4151: Probing the obscured ionizing AGN continuum, the best fitting SEDs are shown in Figure 7 and the best-fit line ratios are shown in Figures 8 and 9. Apart for a somewhat large in the full fit, both fits are successful in the sense defined in Sect. 4.2. The results of the two fit procedures are very similar. In particular, in both the SED falls steeply beyond 1 Ryd towards 4 Ryd and then rises again at around 8 Ryd. As can be expected, the ISO fit does not constrain very well and also does not reproduce the optical lines as well as the full fit. Although the confidence limit on are improved in the full fit, they are still quite large. This probably reflects the fact that the fit is still dominated by the IR lines, and that the optical reddening indicators give conflicting estimates (Sect. 2.3). The best fit is consistent with the lower range of these reddening estimates. In both fits, even the lines that were excluded from the score are reproduced reasonably well, including the He ii line, for which wide aperture measurements are unavailable.
5.2 Two component models
The fitting procedure of the two component models treats the mixture weight, , as an additional free parameter of the fit. We find that in most cases, the best-fit two component model was one with the trivial mixture weight of or , meaning that the fit of the better model of the two could not be improved by any amount of mixing with the other model. In those cases where a non-trivial mixture did improve the fit, the score was still worse than that of the best fitting single component model, for both the full and ISO fits. We therefore conclude that there is no compelling reason to prefer the mixed two-component constant density models over the simpler single component models.
5.3 Dependence on the UV template SED
The template SED has two points fixed by the observations, one at 1 Ryd and one at 56.2 keV (4134 Ryd). The hard photons at 56.2 keV are well beyond the ionization potentials of the lines and affect only the low ionization lines by maintaining partially ionized regions at the back of the clouds. Therefore, the model line fluxes should not depend strongly on the exact SED value at 56.2 keV. This is not necessarily the case for the fixed point at 1 Ryd, as these photons interact very strongly with the gas. There are two sources of uncertainty in the value adopted for the SED at 1 Ryd. One is the strong variability of NGC 4151, which may result in a big difference between the template SED and the effective, time-averaged SED that is relevant for the NLR. The other is the accuracy of dereddening correction that was used to derive the intrinsic SED from the observed one.
In order to check the sensitivity of the results to the shape of the UV SED, we repeated the calculations for the clumpy, , model, this time varying also the flux at 1 Ryd. Instead of the fixed value of , we enumerated on the values , 28.0 and 28.2. These correspond to the dereddened IUE flux at 1806Å with , and , respectively, or to any combined effect of reddening and variability of order . For reasons of computational economy, we enumerated only on every second point in and . The best-fit results of these models and those of the fixed 1 Ryd luminosity models are almost identical. We therefore conclude that uncertainties of the order of 1 mag in the determination of the luminosity at the Lyman limit do not have a significant effect on the best-fit results.
6 Discussion
6.1 Properties of the best fit model
The best-fit model succeeds in reproducing the observed line fluxes to within a factor of 2, on average. It is also consistent with low extinction and with the geometrical constraints on , and . We find no indication of a Big Blue Bump rising beyond the Lyman limit (c.f. Figure 1). On the contrary, the SED declines steeply from the Lyman limit towards 4 Ryd and then rises sharply and peaks at around 8 Ryd. The exact shape of the SED varies among the various successful models, but generally, we get very similar results from the different cloud models we considered here.
The best-fit model is a single component, clumpy cloud with constant density. We find no compelling evidence pointing towards multi-component clouds, non-solar elemental abundances or significant continuum anisotropy. The scaling relation (Sect. 4.2) cannot be applied in this case without increasing and beyond their observed values of and , respectively. Note, however, that is not well constrained because of the uncertainty in (cf Eq. 7) that follows from the uncertainty in (section 5.3). A clumpy gas distribution enhances the geometrical dilution of the ionizing radiation relative to a compact distribution by ‘stretching’ a given gas column density over a larger physical distance. It appears that geometrical dilution plays an important role in establishing the ionization structure that is required for reproducing the observed line ratios. This can be seen by noting that models with a density gradient (e.g. , ) also reproduce the line ratios very well, and result in the same best-fit SED. In such models, geometrical dilution is qualitatively mimicked by the increase in gas density with depth into the cloud. However, such models fail to reproduce the large extent of the NLR since only the thin illuminated skin of the cloud emits lines. It is possible that an extended system of such clouds with suitably adjusted ionization parameters may be consistent with the observations as well, and may be natural in the context of radiatively accelerated clouds (Binette Binette (1998)). However, the dynamics of the NLR are outside the scope of this work, and in view of the success of simpler models, this possibility was not investigated here.
The insensitivity of the low- results to the value of (Sect. 5) is also related to the geometrical dilution. The volume averaged ionization parameter (taking into account only geometrical dilution but ignoring true absorption) is
| (19) | |||||
where and are the inner and outer radius of the NLR, respectively, and is the geometrical dilution (c.f. Eq. 10). When the geometrical dilution is significant, can be much smaller than , which is defined at the irradiated face of the cloud, since the volume average is dominated by the outer shells. The inner and outer radii of the NLR are free parameters in our fit procedure. Inspection of the , full fit results in Table 2 shows that the best fit value of varies with in such a way that approximately, and therefore irrespective of . In addition, the best fit SEDs of all these models are almost identical to that of the model (Figure 7). Thus, while the emission line data cannot precisely constrain , or individually, they clearly favor models with a low , a low and a very hard SED.
The filling factor of the best-fit model, , was deduced from observations of the low excitation NLR lines. The high ionization lines of the best-fit model are produced closer to the central source, while the lower ionization lines are produced deeper in the cloud in less ionized regions. The fact that this model reproduces both the high and low excitation lines supports a simple picture that the clumps emitting the coronal lines and those emitting the optical narrow lines form one continuous and homogeneous system.
The most significant result of this work is that we find no evidence for a Big Blue Bump just beyond the Lyman limit of NGC 4151. Such a bump is too soft to be consistent with the flux ratios of the high and low ionization lines. This is demonstrated in Figure 10, which shows the model to data ratio () of the line ( eV) and line ( eV) as function of and for the best-fit model. Both lines are very well modeled without a Big Blue Bump (Figure 9). The right hand side of the gray scale plots corresponds to high luminosity at 4 Ryd, and the lower right hand side corner to the case of an extreme Big Blue Bump, which peaks at around 4 Ryd ( eV) and then falls off steeply. Such a bump clearly over-produces the low ionization line and under-produces the high ionization line.
A single power-law is also not favored by the observations. As an example, we calculated the fit for a model similar to the best fit model, but with , and , which is the SED that most closely resembles a single power-law and is still contained within the 99.9% confidence interval shown in Figure 7. This SED obtains a fit score of , under-predicts the line by a factor of 8.5, and under-predicts the other high lines as well. The fit of this model to the observed NLR geometry is also clearly worse than that of the best fit model. The softer SED results in a smaller ionization depth, , a higher covering factor, , and a higher photon flux , so that (Eq. 7).
6.2 Comparison with the Circinus SED
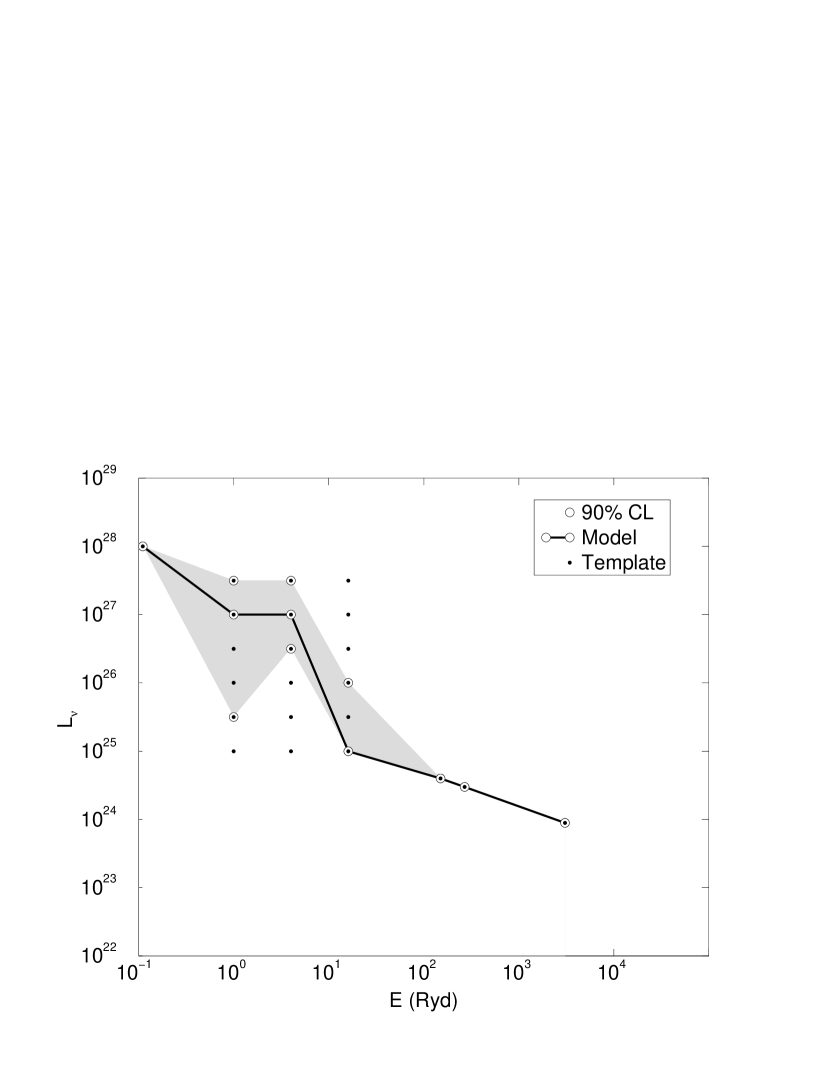
It is instructive to discuss the SED of NGC 4151 by comparing it to the SED of the Seyfert 2 Circinus galaxy. Unlike NGC 4151, the reconstructed SED of the Circinus galaxy does appear to have a Big Blue Bump (Moorwood et al. Moorwood (1996)). As a check on the Circinus results and a test of the method, we applied the fitting procedure described here to the observed optical and IR line fluxes of Circinus (Oliva et al. Oliva (1994); Moorwood et al. Moorwood (1996)). We assume, as in Moorwood et al. (Moorwood (1996)), a single component constant density clumpy gas distribution of solar abundances with cm-3, an ionization parameter , a filling factor , isotropic emission () and . Figure 11 shows the best-fit SED for this model. Only lines with eV were used in the fit to avoid contamination from lines excited by hot stars, which contribute significantly to the nuclear emission (Moorwood & Oliva MO (1988); Marconi et al. Marconi (1994); Moorwood et al. Moorwood (1996)). This model fits 17 observed lines with , , , , , and (for ). These values are consistent with the observed properties of the Circinus galaxy (Oliva et al. Oliva (1994)). A Big Blue Bump is seen in our best fit, in qualitative agreement with the Moorwood et al. (Moorwood (1996)) result. However, this result cannot be established with a high confidence level due to the lack of constraints on the SED below 30 eV (note that Figure 11 shows only a 90% confidence region). Although the confidence limits on the best-fit Circinus SED can accommodate a NGC 4151-like trough, this is not required by the narrow emission line data. In the following, we adopt the simplest working hypothesis, namely that the Circinus SED has the UV bump that is seen in the best-fit SED. We note that careful separation of the nuclear and stellar contributions is crucial in studies of this type. When we also include in the fit star-contaminated lines with eV, we find that the best-fit SED no longer exhibits a bump, but rather falls off sharply from 1 Ryd to 4 Ryd and then remains flat.
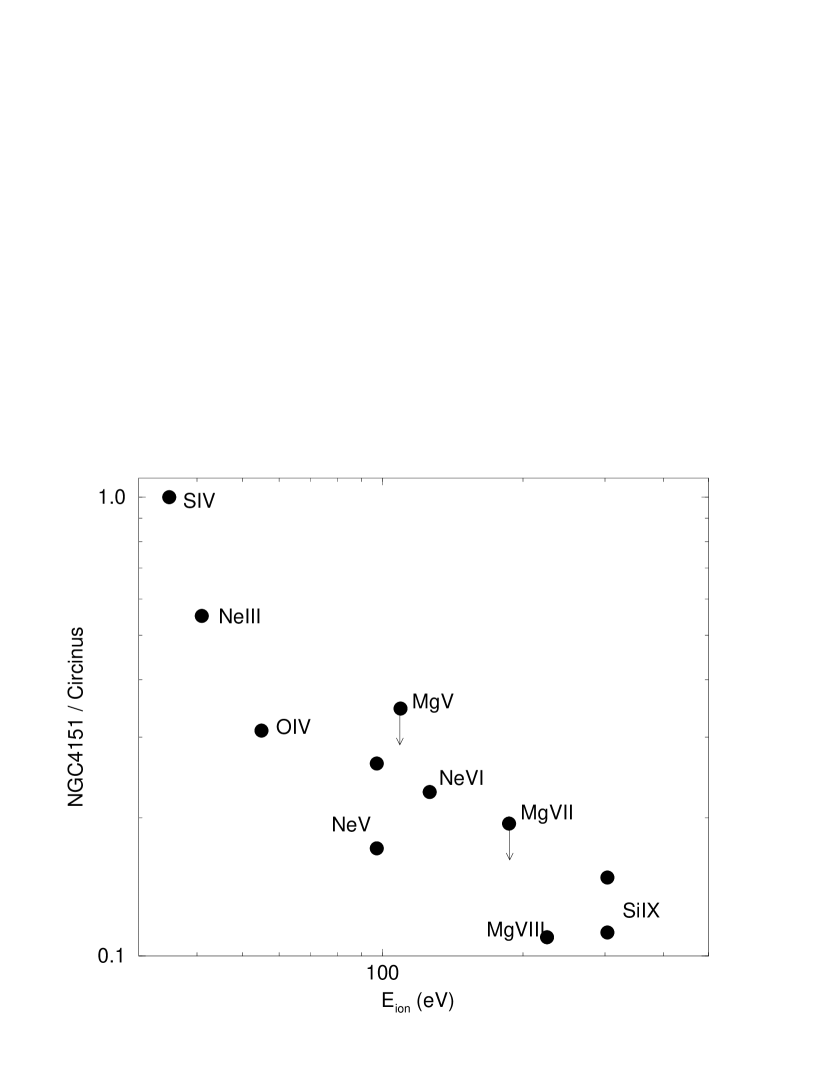
The possibility that the SEDs of Seyfert 1 and Seyfert 2 galaxies are intrinsically different may have far reaching consequences for unification schemes of AGNs (Antonucci Antonucci (1993)). This cannot be reconciled with the idea that the observational differences between these two AGN types are due to orientation effects alone. Bearing in mind the large uncertainties in the reconstruction of the Circinus SED, we make a tentative attempt to understand the differences between the NGC 4151 and Circinus results. We consider first the narrow emission line spectra. A simple comparison of the NGC 4151 to Circinus emission line ratio as function of (Figure 12) reveals a strong decrease with . This trend implies that the NLR of NGC 4151 is not as highly ionized as that of Circinus. However, our analysis shows that the SED of NGC 4151 is as hard or harder than that of Circinus. The mean ionizing photon energy (between 1 to 30 Ryd) is 3.2 Ryd (ISO fit) to 4.1 Ryd (full fit) for NGC 4151 as compared to 3.2 Ryd for Circinus. This is in the opposite sense needed to explain the trend illustrated in Figure 12. It is possible, in principle, that the paucity of UV photons immediately beyond the Lyman edge in the harder NGC 4151 SED is a bottle-neck for the ionization sequence that leads to the high ionizations levels. However, this is not supported by the trends apparent in Figure 10, which show that modifying the SED by replacing hard photons by soft photons only further decreases the ionization level. The geometrical dilution in the NLR of both AGNs is quite similar ( in Circinus as compared to in NGC 4151), so that the difference in simply reflect that in , with in Circinus being 20 times larger than in NGC 4151.
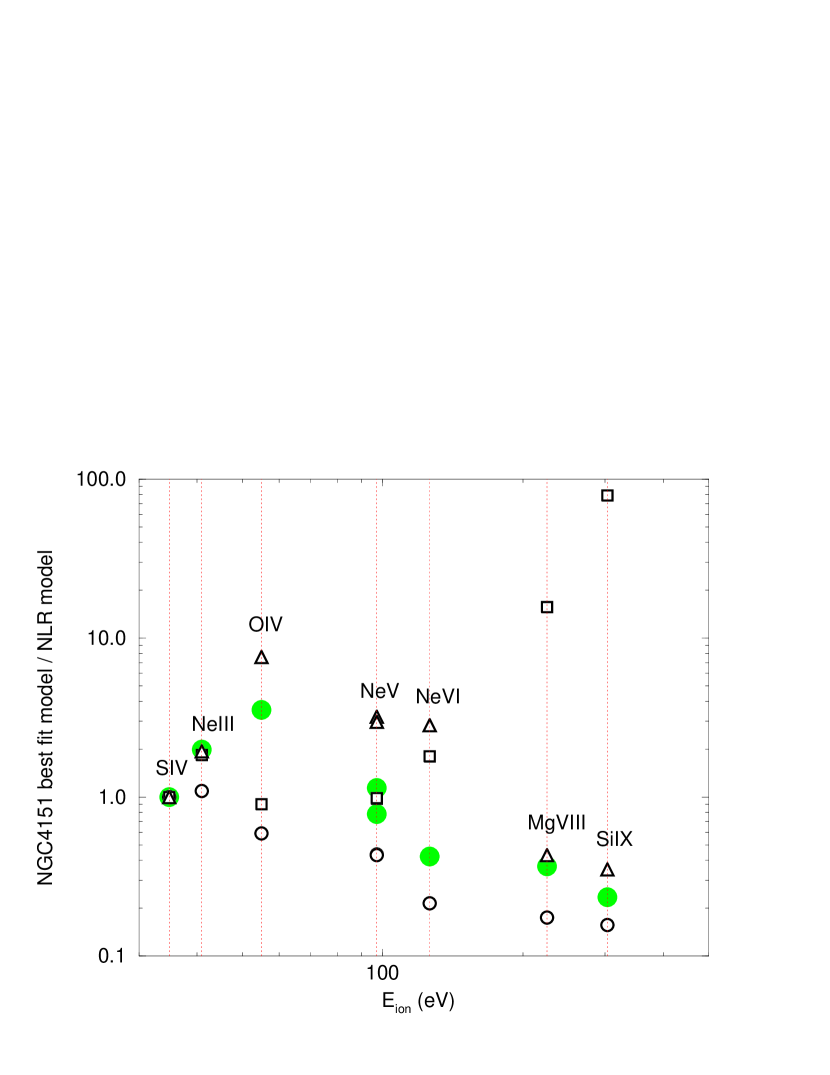
We investigate the relative contribution of these factors to the NLR ionization by calculating the ratios between the ISO line fluxes in the best full fit NGC 4151 model and those in a sequence of four NLR models: (i) the best fit Circinus model; (ii) a model identical to the best full fit NGC 4151 model, apart for having the high Circinus ; (iii) a model identical to the best full fit NGC 4151 model, apart for having the Circinus-like bumpy SED shown in Figure 14; and (iv) a model identical to the best full fit NGC 4151 model, apart for having both the Circinus and a bumpy SED. The ratios are plotted in Figure 13 as function of . The run of ratio (i) with is generally similar but not the same as that based on the observed line fluxes (Figure 12) because the models don’t exactly reproduce the observations (in particular, the discrepancies in reproducing the and lines mask the observed trend below eV). We use these model ratios as the standard for comparison with the other three models. We find that ratio (ii) falls off with even more sharply than (i). This shows that the large difference can more than account for the much higher ionization in Circinus. Ratio (iii) rises with . This demonstrates that all other factors being equal, the harder SED of NGC 4151 can ionize the NLR to levels higher than in Circinus. Ratio (iv) does fall off with , but less than ratio (ii). We therefore conclude that the difference dominates the relative line strengths in the spectra of the two AGN. Although the relative hardness of the two SEDs affects the line ratios in the opposite sense, the effect is smaller and it does not reverse the trend.
Next, we attempt to interpret the difference in the SEDs. We begin by assuming that they are the intrinsic SEDs, i.e. that they directly reflect the accretion process. There is evidence that the two AGNs have different radiative efficiencies. Edelson et al. (Edelson (1996)) estimate that the black hole mass in NGC 4151 is , and that it is emitting at a rate of , where is the Eddington luminosity. Maiolino et al. (Maiolino (1998)) place an upper bound of on the black hole mass in Circinus, which together with a non-stellar luminosity estimate of (Moorwood et al. Moorwood (1996)), translates into . There are two known families of steady-state accretion solutions: hot thin disks (Shakura & Sunyaev SS (1973)), and advection-dominated accretion flows (ADAFs) (Narayan & Yi NY (1995); Narayan et al. NKH (1997)). Naked thin disks (i.e. without additional components) emit thermally and are therefore efficient compared to ADAFs, where most of the energy is advected into the black hole by the ions, and only a small fraction of it is emitted through synchrotron radiation and inverse Compton scattering. The high efficiency of Circinus and the bump in its SED are naturally explained by thin disk accretion. However, the reconstructed SED of NGC 4151 does not fit our pre-conceived ideas about accretion flow spectra. Neither the high luminosity of NGC 4151 nor the sharp features in its SED can be easily reconciled with ADAF spectra (c.f. Lasota et al. Lasota (1996)). Hybrid ADAF / thin disk models such as considered by Lasota et al. (Lasota (1996)) can do better in matching the observed high luminosity, but would re-introduce a significant thermal bump component. The mismatch between the spectra of these accretion models and NGC 4151 may be related to the AGN’s extreme variability. It is conceivable that such high variability can no longer be described as a small perturbation on top of a steady-state accretion flow, but is related to some other transient flow geometry.
6.3 Internally absorbed ionizing continuum
The alternative assumption is that the reconstructed SED of NGC 4151 is not the intrinsic one, but only the one that photoionizes the NLR. This can be the case if the NLR is partially shielded from the continuum source by an absorbing medium (Halpern & Steiner (1983) suggested that varying amounts of shielding can naturally explain the Seyfert to LINER sequence of NLR spectra). The relatively high NLR covering factor of the best fit model, together with the large broad to narrow flux ratio, suggest that this is indeed the case in NGC 4151. The measured broad to narrow ratio varies from 1.5 (DeRobertis DeRobertis (1985)) during a low state epoch of the AGN (Penston & Pérez PP (1984)), through (Osterbrock & Koski OK (1976)), up to (Kaspi et al. Kaspi (1996)) during a high state epoch333Based on the low resolution Wise spectrum of the full line and the narrow flux given in Table Infrared spectroscopy of NGC 4151: Probing the obscured ionizing AGN continuum. (Kriss et al. KDZKE (1995)). We adopt a broad to narrow flux ratio of 5 as a representative value. The line emission in the best fit model is well modeled by case B recombination with K, which is close to the maximal efficiency for production by recombination per unit covering factor. The covering factor of the best fit model is , which implies an unphysical covering factor for the BLR, . It is well known (Netzer BNW (1990)) that the uncertainty in calculating the broad Balmer line intensities is large, due to complicated radiative transfer effects. It is likely that these effects, combined with collisional excitation of and , can enhance the intensity over its recombination value, by a factor of a few. However, this is unlikely to lower to an acceptably low value, especially if the broad to narrow flux ratio is in fact as large as .
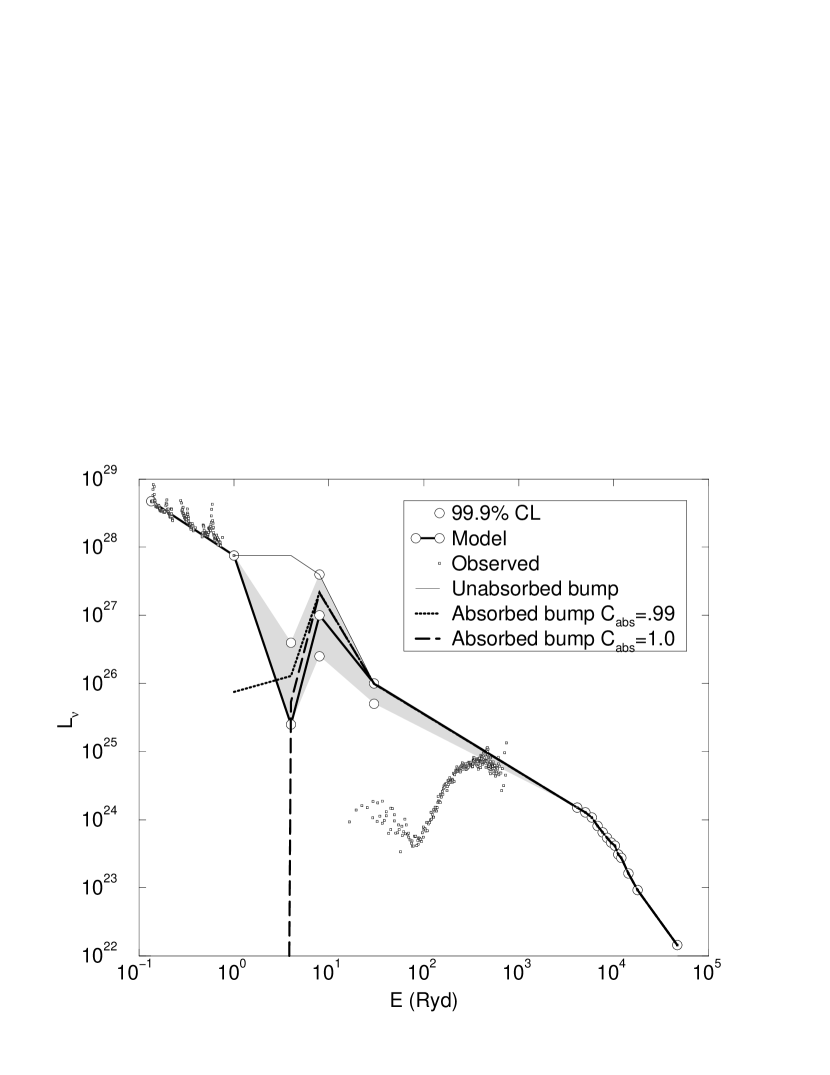
A possible solution to this problem is to assume that the BLR gas sees more ionizing photons than the NLR. For example, the unabsorbed Circinus-like bumpy SED, shown in Figure 14, has 10 times as many ionizing photons as the best fit SED. In this case, , which is the canonical value for . Figure 14 shows that the rise towards 8 Ryd in the best fit SED is well reproduced by the recovery slope of an intrinsically bumpy SED absorbed by cm-2 of neutral hydrogen, located between the BLR and the NLR. The covering factor of the absorber relative to that of the NLR, , has to be close to unity, but some leakage is still consistent with the best fit SED.
It is remarkable that such an absorber was detected with completely independent methods by absorption lines (Kriss et al. Kriss (1992, 1995)) (Sect. 2.2). The absorber’s H i column density and location , although poorly determined, are consistent with what we deduce from the narrow emission line data. The observations also imply that the absorber is very dense and that it covers a large fraction of the continuum source and the BLR along the line of sight. The only additional assumption that is required is that it also covers the line of sights to the NLR, which is consistent with our assumption of . The high density of the absorber, cm-3, implies that it does not contribute to the forbidden line emission. Therefore, our gas models, which do not include possible narrow line emission from this component, remain valid since they rely predominantly on the forbidden lines. The analysis of Kriss et al. (Kriss (1992, 1995)) suggests that the absorber has a complex, possibly time-variable multi-zone structure. Since the energy resolution of the enumerated SED is too coarse, and additional free parameters will make the enumeration too large, such detailed modeling is outside the scope of this work. We note that the evidence for an intrinsic UV bump comes only from the BLR covering factor problem. The absorption beyond the Lyman edge is so high that there are almost no direct constraints on the intrinsic SED in that energy range.
To summarize, we have to consider two possible interpretations of the reconstructed SED of NGC 4151.
-
1.
It is an intrinsic SED, which does not fit easily with present-day accretion theories, which challenges AGN unification schemes, and which photoionizes a BLR with an unusually high (perhaps even an impossibly high) covering factor.
-
2.
It is an intrinsically bumpy SED (consistent with a hot thin accretion disk), similar to the one we find in the Seyfert 2 Circinus galaxy, which is modified by an absorber between the BLR and NLR. The existence of an absorber with the required properties was discovered independently by UV absorption lines.
Both simplicity and plausibility arguments lead us to adopt the second interpretation. While the intrinsic SED of NGC 4151 cannot be reconstructed from narrow emission line data because of the internal absorption, it is encouraging that our method has succeeded in detecting this feature in the SED. The absorption in NGC 4151 is very complex and it is not at all clear, due to the lack of similar quality data, how typical is this among AGN. It is quite possible that the narrow emission lines of other AGNs will provide us with direct information on the intrinsic ionizing continuum. A program of ISO observations of additional AGNs, currently in progress, will hopefully shed more light on this issue.
7 Summary
In this paper we inferred the spectral shape of the obscured photoionizing continuum source in the nucleus of the Seyfert 1 galaxy NGC 4151. We constrained the SED by fitting the observed intensities of NLR emission lines, particularly the high-ionization IR lines, to a large grid of photoionization models. The advantage of this approach over methods that attempt to relate the observed UV and soft X-ray spectra is that it can be used to study AGNs individually rather than statistically, thus avoiding the problems of selection effects and small sample statistics.
We used the available information on the line emitting gas to construct a large grid of gas models. For each of these models, we enumerated extensively on possible ways to bridge the UV–X-ray gap in a SED based on simultaneous multi-band observations of the AGN continuum, and calculated the line emission with a photoionization code. We then employed a new method to fit the model predictions to a compilation of observed line fluxes ranging from the UV to the IR. In addition to minimizing over the SED, this method also minimizes over the gas geometry and the extinction, thus making it possible to use observational information on these quantities to further constrain the best-fit model. Our results suggest that the filling factor of the NLR plays an important role in determining the properties of the observed line spectrum. We find that the best-fit SED for NGC 4151 does not have a Big Blue Bump, but rather falls steeply beyond the Lyman limit towards 4 Ryd, and then rises sharply again towards 8 Ryd. Using our new method we confirm our previous conclusion that a Big Blue Bump is present in the SED of the Seyfert 2 galaxy Circinus.
We consider the possibility that the reconstructed NGC 4151 SED is the intrinsic SED produced by the accretion mechanism. However, such a SED does not have enough UV photons to reproduce the BLR recombination emission. This leads us to adopt the interpretation that the BLR is photoionized by the intrinsic continuum source, which does contain a strong UV component (perhaps a Big Blue Bump), but that this UV component is absorbed by material located between the NLR and BLR. Our analysis suggests that the absorber consists of cm-2 of neutral hydrogen. Such an absorber was detected independently by UV absorption lines.
References
- (1) Anderson, K. S., 1970, ApJ, 162, 743
- (2) Antonucci R., 1993, ARA&A, 31, 473
- (3) Binette L., 1998, MNRAS, 294, 49
- (4) Binette L., Raga A., Wilson A. S., & Storchi-Bergman Th., 1997, A&A, 327, 909
- (5) Binette L., Wilson A. S., & Storchi-Bergman Th.,1996, A&A, 312, 365
- (6) Blandford R. D., Netzer H., & Woltjer L., Active Galactic Nuclei (Berlin: Springer-Verlag), 208
- (7) Boksenberg A., Shortridge K., Allen D. A., Fosbury R. A. E., Penston M. V., & Savage A., 1975, MNRAS, 173, 381
- (8) Boksenberg A., et al. 1978, Nat, 275, 404
- (9) Boksenberg A., et al. 1995, ApJ, 440, 151
- (10) Brinkmann W., Siebert J., Reich W., Fürst E., Reich P., Voges W., Trümper J., & Wielebinski R., 1995, A&AS, 109, 147
- (11) Brunner H., Müller C., Fridrich P., Dörrer T., Staubert R., & Riffert H., 1997, A&A, 327, 467
- (12) Butler K., & Zeippen C. J., 1994, A&AS, 108, 1
- (13) Crenshaw D. M., et al. 1996, ApJ, 470, 322
- (14) De Robertis M., 1985, ApJ, 289, 67
- (15) Eckart A., & Genzel R., 1996, Nature, 383, 415
- (16) Edelson, R., et al. 1996, ApJ, 470, 364
- (17) Erkens U., Appenzeller I., & Wagner S. J., 1997, A&A, 323, 707
- (18) Ferland G. J., 1996, Hazy: a brief introduction to Cloudy, Univ. of Kentucky, Dept. of Physics and Astronomy Internal Report
- (19) Ferguson J. W., Korista K. T., & Ferland G. J., ApJS, 110, 287
- (20) Galavis M. E., Mendoza C., & Zeippen C. J., 1995, A&AS, 111, 347
- (21) Galavis M. E., Mendoza C., & Zeippen C. J., 1997, A&AS, 123, 159
- (22) Genzel R., et al. 1998, ApJ, in press
- (23) Greenhouse, M. A., Feldman, U., Smith, H. A., Klapisch, M., Bhatia, A. K., & Bar-Shalom, A., 1993, ApJS,88, 23
- (24) Halpern J. P., & Steiner J. E., 1983, ApJ, 296, L37
- (25) Heckman T.M., & Balick B., 1983, ApJ, 268, 102
- (26) Hutchings J. B. et al., 1998, ApJ, 492, L115
- (27) Kaler J. B., 1976, ApJS, 31, 517
- (28) Kaspi S., et al. 1996, ApJ, 470, 336
- (29) Kormendy J., Richstone D., 1995, ARA&A, 33, 581
- (30) Kriss G. A. et al., 1992, ApJ, 392, 485
- (31) Kriss G. A., Davidsen A. F., Zheng W., Kruk J. W., & Espey B. R., 1995, ApJ, 454, L7
- (32) Laor A., Fiore F., Elvis M., Wilkes B. J., & McDowell J C., 1994, ApJ, 435, 611
- (33) Laor A., Fiore F., Elvis M., Wilkes B. J., & McDowell J C., 1997, ApJ, 477, 93
- (34) Lasota J.-P., Abramowicz M. A., Chen X., Krolik J., Narayan R., & Yi I., 1996, ApJ, 462, 142
- (35) Lennon D. J., & Burke V. M., 1994, A&AS, 103, 273
- (36) Lutz D., et al. 1996a, A&A, 315, L137
- (37) Lutz D., et al. 1996b, A&A, 315, L269
- (38) Maiolino R., Krabbe A., Thatte N., & Genzel R., 1998, ApJ, 493, 650
- (39) Malkan M. A., 1983, ApJ, 264, L1
- (40) Maloney, P.R., Hollenbach, D.J., & Tielens, A.G.G.M. 1996, ApJ466, 561
- (41) Marconi A., et al. 1994, The ESO Messenger, 78, 20
- (42) Mendoza C., & Zeippen C. J., 1982, MNRAS199, 1025
- (43) Miyoshi et al. 1995, Nature, 373, 127
- (44) Moorwood A. F. M., & Oliva E. 1988, A&A, 203, 278
- (45) Moorwood A. F. M., et al. 1996, A&A, 315, L109
- (46) Narayan R., Kato S., & Honma F. 1997, ApJ476, 49
- (47) Narayan R., & Yi I., 1995, ApJ452, 710
- (48) Netzer, H., 1974, MNRAS, 169, 579
- (49) Netzer, H., 1996, ApJ, 473, 781
- (50) Oke J. B., & Sargent W. L. W., 1968, ApJ, 151, 807
- (51) Oliva, E., & Moorwood, A. F. M., 1990, ApJ, 348,50
- (52) Oliva E., Pasquali A.,& Reconditi M., 1996, A&A, 305, L21
- (53) Oliva E., Salvati M., Moorwood A. F. M., & Marconi A., 1994, A&A, 288, 457
- (54) Osterbrock D. E., & Koski A. T., 1976, MNRAS, 176, 61P
- (55) Osterbrock D. E., Shaw R. A., & Veilleux S., 1990, ApJ, 352, 561
- (56) Pedlar A., Howley P., Axon D. J., & Unger S. W., 1992, MNRAS, 259, 369
- (57) Pedlar A., et al., 1993, MNRAS, 264, 471
- (58) Penston M. V., & Pérez E., 1984, MNRAS, 211, 33P
- (59) Penston M. V., et al. 1981, MNRAS, 196, 857
- (60) Penston M. V., et al. 1990, A&A, 236, 53
- (61) Pérez E., González-Delgado R., Tadhunter C., & Tsvetanov Z., 1989, MNRAS, 241, 31P
- (62) Pérez-Fournon I., & Wilson S. W., 1990, ApJ, 356, 456
- (63) Pottasch S. R., et al. 1996, A&A, 315, L261
- (64) Press W. H., Teukolsky S. A., Vetterling W. T., & Flannery B. P., 1992, Numerical Recipes, 2nd ed. (Cambridge: CUP)
- (65) Puchnarewicz E. M., et al. 1996, MNRAS, 281, 1243
- (66) Reconditi, M., & Oliva, E., 1993, A&A, 280, 536
- (67) Robinson A., et al. 1994, A&A, 291, 351
- (68) Roche P. F., Aitken D. K., Smith C. H., & Ward M. J., 1991, MNRAS, 248, 606
- (69) Seaton M. J., 1979, MNRAS, 187, 73P
- (70) Schulz H., 1987, A&A, 178, 7
- (71) Schulz H., 1988, A&A, 203, 233
- (72) Schulz H., 1990, AJ, 99, 1442
- (73) Schulz H., & Komossa S., 1993, A&A, 278, 29
- (74) Shakura N. I., & Sunyaev R. A., 1973, A&A, 24, 337
- (75) Spitzer L., 1978, Physical Processes in the Interstellar Medium (New York: John Wiley & Sons), 4
- (76) Spinoglio L., & Malkan M. A.. 1992, ApJ, 399, 504
- (77) Spinoglio L., et al. 1998, in Extragalactic Astronomy in the Infrared, ed. G. A. Mamon, Trin Xuân Thuân, J. Trân Thanh Vân (Gif-sur-Yvette, Editions Frontières), 333
- (78) Sternberg A., & Dalgarno A., 1989, ApJ, 338, 197
- (79) Storchi-Bergmann Th., Wilson A. S., Mulchaey J. S., & Binette L., 1996, A&A, 312, 357
- (80) Sturm E., Alexander T., Lutz D., Sternberg A., Netzer H., & Genzel R., 1988, submitted to ApJ
- (81) Thompson R. I., 1995, ApJ, 445, 700
- (82) Tielens A. G. G. M., & Hollenbach D., 1985, ApJ, 291, 722
- (83) Unger S. W., et al. 1989, in IAU Symp. 134, Active Galactic Nuclei, ed. Osterbrock D. E., & Miller J. S. (Dordrect: Kluwer), 331
- (84) Veilleux S., 1991, ApJS, 75, 357
- (85) Veilleux S., 1991, ApJ, 369, 331
- (86) Viegas S. M., & Prieto A., 1992, MNRAS, 258, 483
- (87) Voit G. M., 1992, ApJ, 399, 495
- (88) Walter R., & Fink H. H., 1993, A&A, 274, 105
- (89) Walter R., Orr A., Courvoisier T. J.-L., Fink H. H., Makino F., Otani C., & Wamsteker W., 1994, A&A, 285, 119
- (90) Ward M. J., et al., 1987, ApJ, 316, 138
- (91) Warwick D. A., et al. 1996, ApJ, 470, 349
- (92) Wu C.-C., & Weedman D. W., 1978, ApJ, 223, 798
- (93) Yoshida M., & Ohtani H., 1993, PASJ, 45, 407
- (94) Zheng W., Kriss G. A., Telfer R. C., Grimes J. P., & Davidsen A. F., 1997, ApJ, 475, 469
| Line | aaThe ionization energy required to produce the emitting ion from the preceding ionization stage. | bbObserved flux. For permitted lines, the flux of the decomposed narrow component is quoted. | ccError estimate on observed flux. The ISO-SWS errors were estimated by adding in quadrature the error due to the uncertainty in defining the underlying continuum and a global 20% statistical error. A question mark means that error estimates are unavailable. | |||||
|---|---|---|---|---|---|---|---|---|
| m | eV | |||||||
| UV and optical lines | ||||||||
| H i | 0. | 1216 | 13. | 6 | 111. | 8 | 8. | 4 |
| C iv | 0. | 1550 | 47. | 9 | 15. | 8 | 5. | 9 |
| He ii | 0. | 1640 | 54. | 4 | 13. | 6 | 2. | 3 |
| H i | 0. | 4861 | 13. | 6 | 8. | 99 | 4. | 67 |
| [O ii] | 0. | 3726+3729 | 13. | 6 | 31. | 3 | ? | |
| [Ne iii] | 0. | 3868+3967 | 41. | 0 | 23. | 6 | ? | |
| [O iii] | 0. | 4959+5007 | 35. | 1 | 176. | 0 | ? | |
| [Fe vii] | 0. | 5721 | 100. | 0 | 2. | 67 | ? | |
| [Fe vii] | 0. | 6086 | 100. | 0 | 4. | 35 | ? | |
| H i | 0. | 6563 | 13. | 6 | 18. | 0 | ? | |
| [Ar iii] | 0. | 7136 | 27. | 6 | 2. | 96 | ? | |
| [O ii] | 0. | 7320+7330 | 13. | 6 | 3. | 85 | ? | |
| [S iii] | 0. | 9069+9531 | 23. | 3 | 27. | 3 | 3. | 4 |
| ISO IR lines | ||||||||
| [Mg viii] | 3. | 028 | 224. | 9 | 0. | 62 | 0. | 13 |
| [Si ix] | 3. | 936 | 303. | 2 | 0. | 41 | 0. | 08 |
| [Ne vi] | 7. | 642 | 126. | 2 | 7. | 9 | 1. | 6 |
| [Ar iii] | 8. | 991 | 27. | 6 | 2. | 20 | 0. | 46 |
| [S iv] | 10. | 51 | 34. | 8 | 11. | 3 | 2. | 3 |
| [Ne ii] | 12. | 81 | 21. | 6 | 11. | 8 | 2. | 4 |
| [Ne v] | 14. | 32 | 97. | 1 | 5. | 5 | 1. | 2 |
| [Ne iii] | 15. | 56 | 41. | 0 | 20. | 7 | 4. | 1 |
| [S iii] | 18. | 71 | 23. | 3 | 5. | 4 | 1. | 1 |
| [Ne v] | 24. | 32 | 97. | 1 | 5. | 6 | 1. | 1 |
| [O iv] | 25. | 89 | 54. | 9 | 20. | 3 | 4. | 1 |
| [S iii] | 33. | 48 | 23. | 3 | 8. | 1 | 1. | 7 |
| [Ne iii] | 36. | 01 | 41. | 0 | 3. | 5 | 0. | 7 |
| [O iii] | 51. | 81 | 35. | 1 | 10. | 3 | 3. | 2 |
| [O iii] | 88. | 36 | 35. | 1 | 6. | 8 | 0. | 6 . Problematic lines not used in fit |
| He ii | 0. | 4686 | 54. | 4 | 2. | 05 | 0. | 8 |
| [Ar iv] | 0. | 4711 | 40. | 7 | 1. | 25 | ? | |
| [N ii] | 0. | 6548+6584 | 14. | 5 | 18. | 6 | ? | |
| [S ii] | 0. | 6717 | 10. | 4 | 14. | 6 | ? | |
| [S ii] | 0. | 6731 | 10. | 4 | 17. | 4 | ? | |
| [Ar v] | 0. | 7006 | 59. | 8 | 0. | 46 | 0. | 08 |
| [Ar iii] | 0. | 7751 | 27. | 6 | 0. | 89 | ? | |
| [Si vii] | 2. | 481 | 205. | 1 | 1. | 2 | 0. | 1 |
| [Si ix] | 2. | 585 | 303. | 2 | 0. | 23 | 0. | 07 |
| [Mg iv] | 4. | 49 | 80. | 1 | 0. | 31 | 0. | 07 |
| [Mg vii] | 5. | 50 | 186. | 5 | 1. | 0 | — | |
| [Mg v] | 5. | 608 | 109. | 2 | 1. | 5 | — | |
| [Si ii] | 34. | 81 | 8. | 2 | 15. | 6 | 3. | 3 |
| [O i] | 63. | 18 | 0. | 0 | 30. | 6 | 3. | 1 |
| [O i] | 145. | 5 | 0. | 0 | 1. | 94 | 0. | 05 |
| [C ii] | 157. | 7 | 11. | 3 | 5. | 69 | 0. | 35 |
| 0.005 | 0.01 | 0.025 | 0.05 | 0.1 | 0.2 | 0.4 | |||
|---|---|---|---|---|---|---|---|---|---|
| ISO fit | |||||||||
| 17.5 | 1 | 2.32 | 1.75 | 1.64 | 1.60 | 1.59 | 1.66 | 1.73 | |
| aaWhen the model to data ratio is smaller than 1, the discrepancy is given as the reciprocal of the ratio. | 6.32-1 | 2.48-1 | 2.35-1 | 2.33-1 | 2.09-1 | 2.56 | 3.47 | ||
| 0.21 | 0.23 | 0.31 | 0.40 | 0.39 | 0.42 | 0.51 | |||
| bbAngular distance of cloud surface from center, in arcsec, assuming . | 1.54 | 1.02 | 0.66 | 0.46 | 0.36 | 0.27 | 0.18 | ||
| ccAngular thickness of the ionized layer in the cloud, in arcsec, assuming . | 0.01 | 0.01 | 0.01 | 0.01 | 0.01 | 0.02 | 0.03 | ||
| 0.00 | 0.00 | 0.00 | 0.00 | 1.59 | 3.42 | 4.55 | |||
| 1 | 2.06 | 1.80 | 1.78 | 1.76 | 1.92 | 2.29 | 2.25 | ||
| 3.29-1 | 2.53-1 | 2.55-1 | 2.56-1 | 3.35 | 5.45 | 7.20 | |||
| 0.17 | 0.16 | 0.20 | 0.29 | 0.28 | 0.28 | 0.33 | |||
| 1.54 | 1.15 | 0.73 | 0.48 | 0.34 | 0.26 | 0.15 | |||
| 0.06 | 0.12 | 0.17 | 0.20 | 0.24 | 0.25 | 0.41 | |||
| 0.00 | 0.00 | 0.00 | 0.00 | 0.09 | 2.26 | 3.25 | |||
| 0.065 | 2.10 | 1.81 | 1.82 | 1.80 | 1.93 | 2.06 | 2.10 | ||
| 3.32-1 | 2.48-1 | 3.07-1 | 2.71-1 | 3.55-1 | 4.99 | 5.64 | |||
| 0.18 | 0.22 | 0.39 | 0.36 | 0.33 | 0.38 | 0.40 | |||
| 1.54 | 1.08 | 0.60 | 0.45 | 0.34 | 0.23 | 0.16 | |||
| 0.56 | 0.72 | 0.65 | 0.74 | 0.78 | 0.86 | 0.87 | |||
| 0.00 | 0.00 | 0.00 | 0.00 | 0.00 | 1.14 | 1.57 | |||
| 0.00065 | 2.87 | 2.06 | 1.80 | 1.79 | 1.79 | 1.79 | 1.79 | ||
| 13.49-1 | 3.19-1 | 2.93-1 | 3.07-1 | 3.11-1 | 3.12-1 | 3.11-1 | |||
| 0.22 | 0.28 | 0.29 | 0.28 | 0.28 | 0.26 | 0.28 | |||
| 1.62 | 1.05 | 0.64 | 0.46 | 0.32 | 0.24 | 0.16 | |||
| 4.38 | 4.51 | 4.68 | 4.85 | 4.95 | 4.95 | 5.01 | |||
| 0.00 | 0.00 | 0.00 | 0.00 | 0.00 | 0.00 | 0.00 | |||
| Full fit | |||||||||
| 17.5 | 1 | 2.02 | 1.80 | 1.87 | 1.96 | 2.10 | 2.33 | 2.36 | |
| 5.68-1 | 2.86 | 3.38-1 | 3.81-1 | 4.65-1 | 5.04 | 5.92 | |||
| 0.23 | 0.26 | 0.38 | 0.47 | 0.48 | 0.47 | 0.45 | |||
| 1.54 | 1.02 | 0.63 | 0.46 | 0.32 | 0.23 | 0.16 | |||
| 0.01 | 0.01 | 0.01 | 0.01 | 0.02 | 0.02 | 0.03 | |||
| 0.07 | 0.04 | 0.03 | 0.02 | 0.01 | 0.01 | 0.00 | |||
| 1 | 1.95 | 1.90 | 2.05 | 2.15 | 2.35 | 2.82 | 2.69 | ||
| 3.28-1 | 2.81-1 | 3.46-1 | 3.80-1 | 5.81-1 | 13.87 | 13.00 | |||
| 0.23 | 0.24 | 0.31 | 0.45 | 0.38 | 0.22 | 0.27 | |||
| 1.48 | 1.04 | 0.65 | 0.43 | 0.32 | 0.21 | 0.15 | |||
| 0.07 | 0.14 | 0.19 | 0.18 | 0.24 | 0.47 | 0.52 | |||
| 0.05 | 0.04 | 0.02 | 0.01 | 0.00 | 0.00 | 0.00 | |||
| 0.065 | 1.94 | 1.86 | 2.03 | 2.15 | 2.35 | 2.55 | 2.53 | ||
| 3.30-1 | 2.64-1 | 3.05-1 | 3.79-1 | 5.45-1 | 11.09 | 11.04 | |||
| 0.25 | 0.26 | 0.41 | 0.52 | 0.46 | 0.37 | 0.38 | |||
| 1.48 | 1.04 | 0.62 | 0.43 | 0.32 | 0.22 | 0.15 | |||
| 0.61 | 0.79 | 0.87 | 0.76 | 0.83 | 1.06 | 1.12 | |||
| 0.05 | 0.04 | 0.03 | 0.01 | 0.00 | 0.00 | 0.00 | |||
| 0.00065 | 2.31 | 1.95 | 1.90 | 1.91 | 1.92 | 1.92 | 1.93 | ||
| 12.45-1 | 2.98 | 3.03-1 | 3.49-1 | 3.53-1 | 3.16-1 | 3.16-1 | |||
| 0.24 | 0.26 | 0.24 | 0.28 | 0.28 | 0.23 | 0.23 | |||
| 1.62 | 1.09 | 0.69 | 0.47 | 0.33 | 0.24 | 0.17 | |||
| 4.38 | 4.61 | 4.95 | 4.91 | 5.01 | 5.25 | 5.31 | |||
| 0.08 | 0.05 | 0.03 | 0.02 | 0.02 | 0.03 | 0.03 | |||
| ISO fit (15 lines) | Full fit (28 lines) | |
|---|---|---|
| Input parameters | ||
| 0.025 | 0.025 | |
| aaHydrogen density in cm-3. | ||
| bbLuminosity in erg s-1 Hz-1, using , with Mpc. | 27.88 | 27.88 |
| 24.18 | 24.18 | |
| Best-fit resultsccValues in parentheses are the 99.9% confidence intervals. | ||
| 1.8 | 1.9 | |
| ddWhen the model to data ratio is smaller than 1, the discrepancy is given as the reciprocal of the ratio. | 2.93-1 | 3.03-1 |
| worst line | [Fe vii] Å | |
| 25.4 (25.4, 26.2) | 25.4 (25.4, 26.6) | |
| 26.6 (26.2, 27.0) | 27.0 (26.4, 27.6) | |
| 26.0 (25.7, 26.0) | 26.0 (25.7, 26.0) | |
| 0.29 (0.17, 0.43) | 0.24 (0.10, 0.40) | |
| eeAngular distance of cloud surface from center, in arcsec, assuming . ( pc for ) | 0.64 (0.62, 0.78) | 0.69 (0.63, 0.89) |
| ffAngular thickness of the ionized layer in the cloud, in arcsec, assuming . | 4.68 (3.84, 4.95) | 4.95 (4.14, 5.35) |
| 0.00 (0.00, 2.41) | 0.03 (0.00, 0.20) | |
| ggIonizing photon flux in s-1 cm-2. | 7.35 | 8.36 |
| hhIonizing photon luminmosity in s-1, assuming isotopic emission and . | 53.31 | 53.37 |
| iiMean ionizing photon energy in Ryd, calculated between 1 and 30 Ryd. | 3.2 | 4.1 Residual correlationsjj is the probability for a correlation in random data. |
| depletion | ||

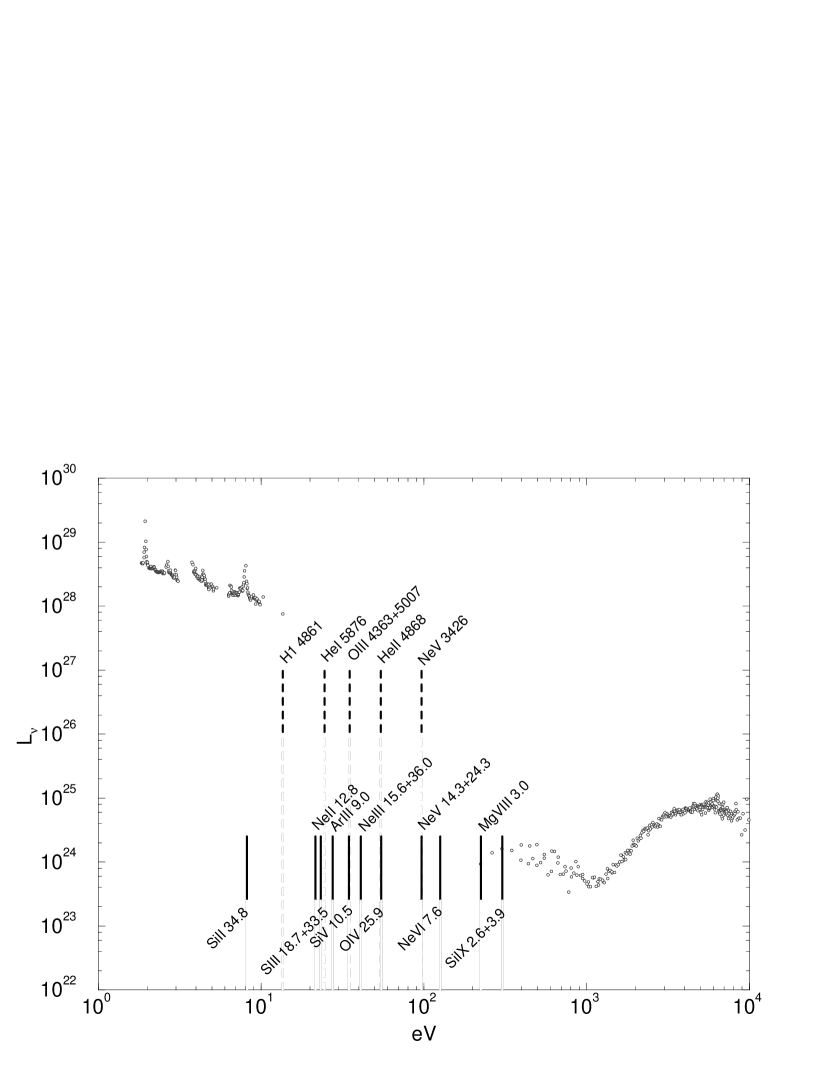


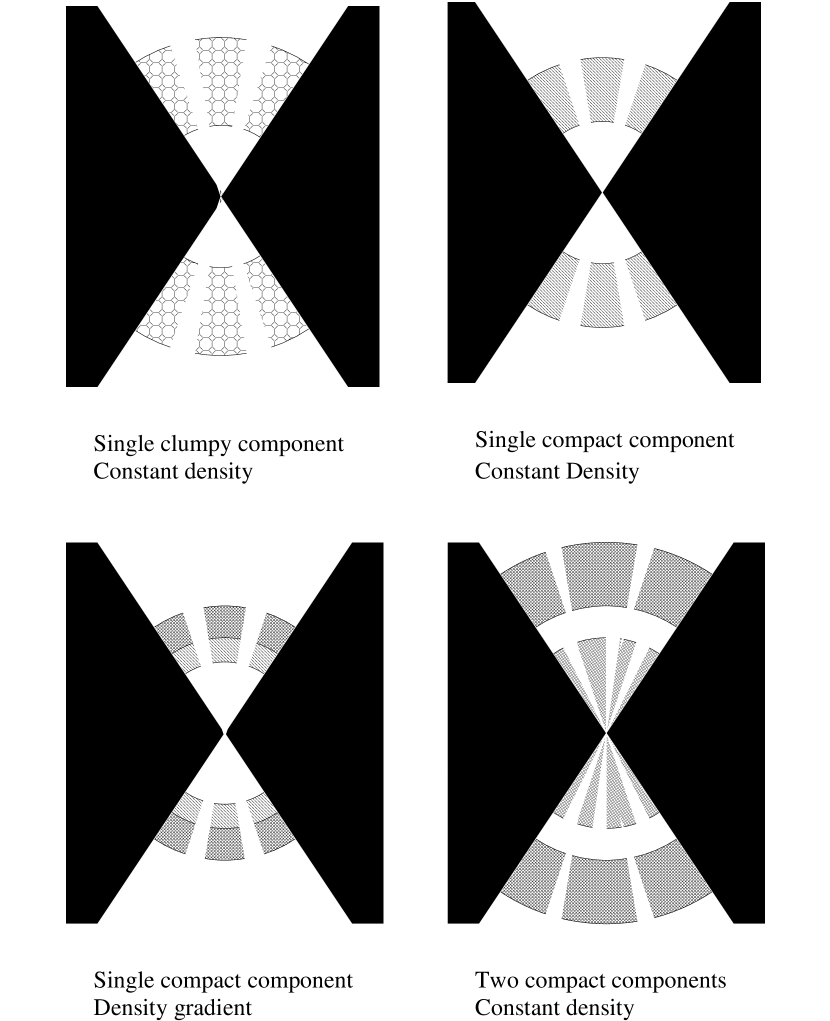
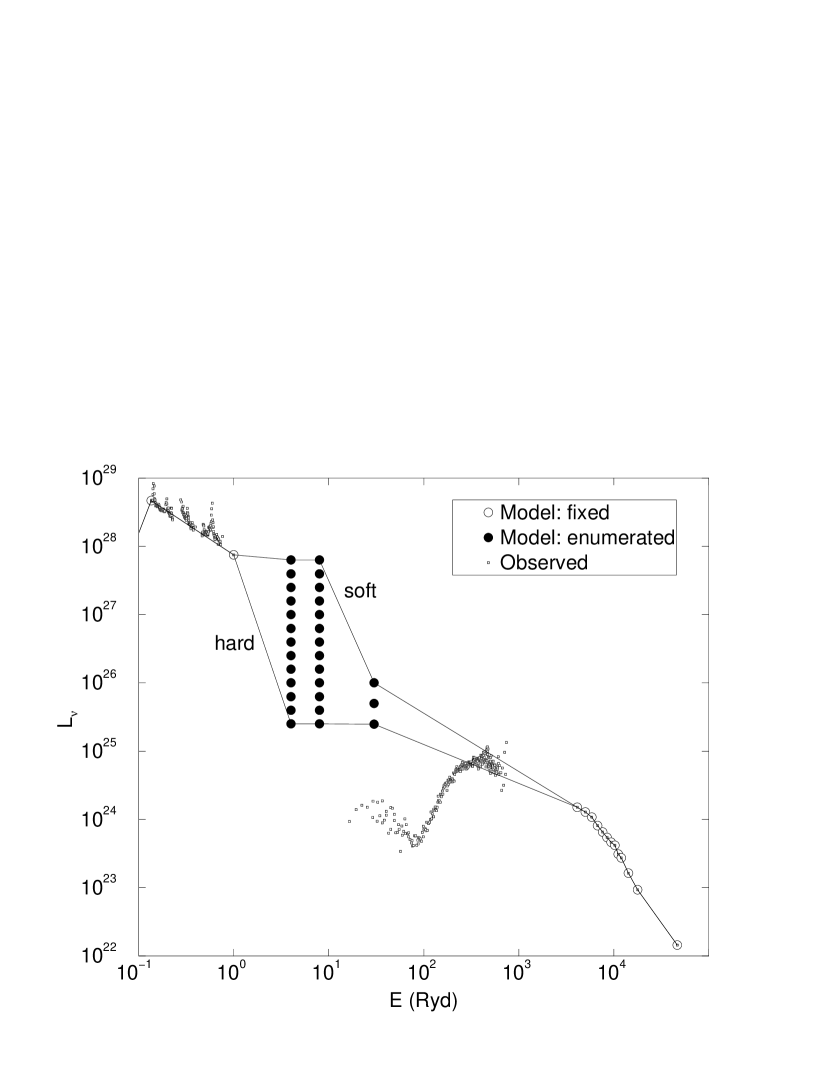
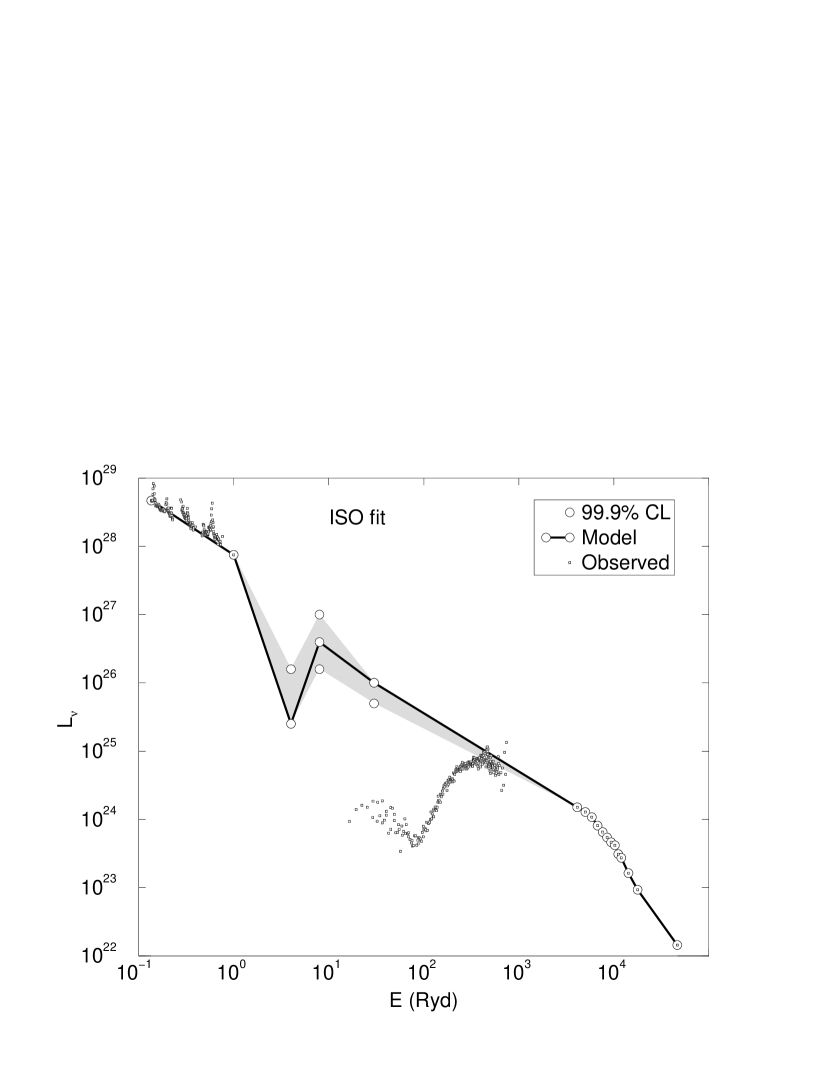
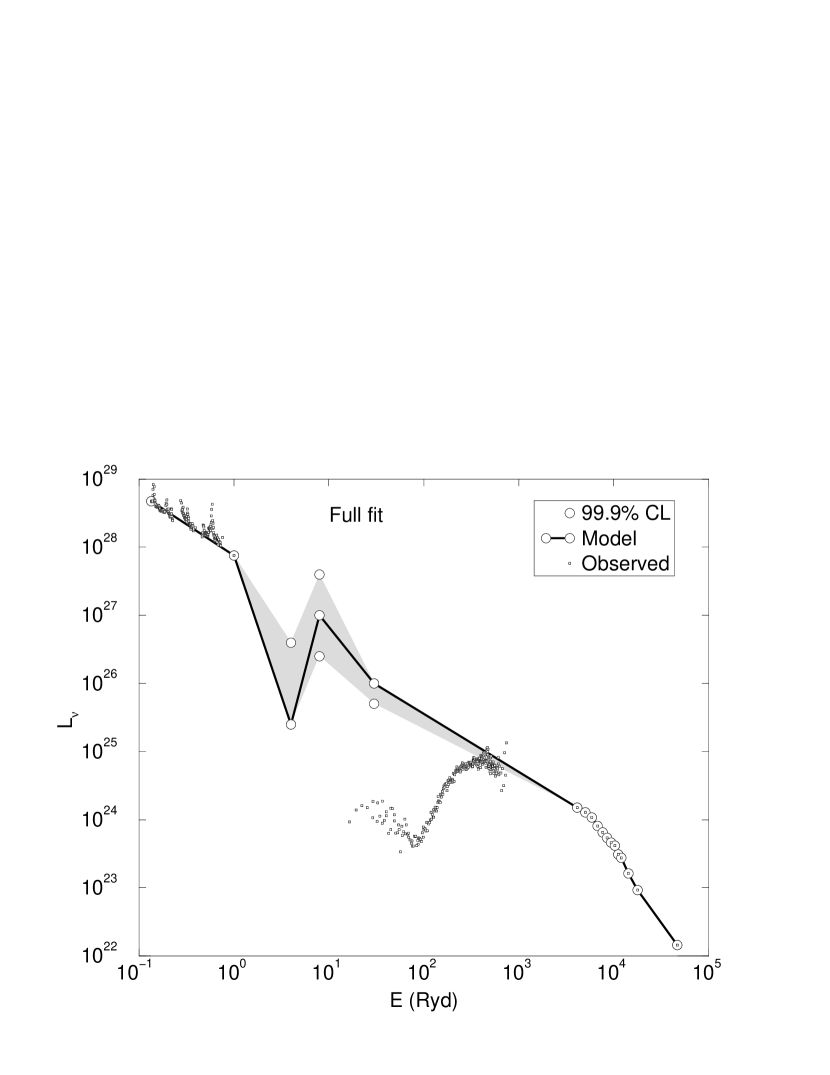


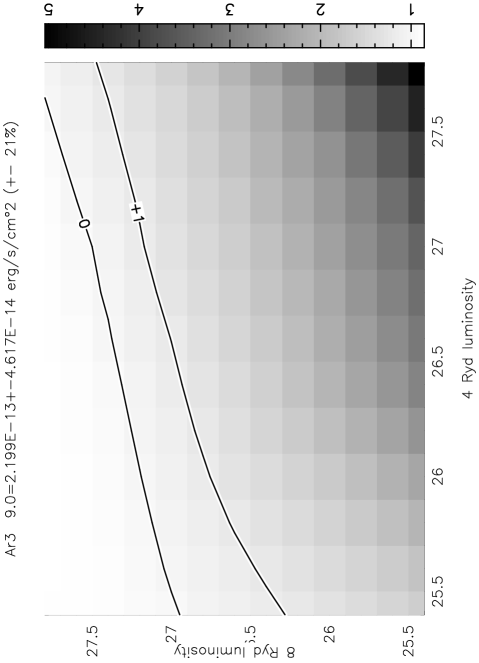
|
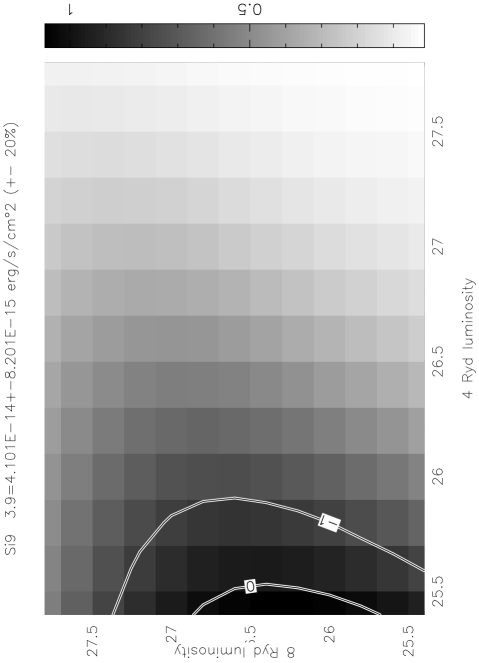
|