Abstract
We present timing and spectral analysis of the data collected by the Extreme Ultraviolet Explorer Satellite (EUVE) for the Seyfert 1 galaxy NGC 4051 during 1996. NGC 4051 was observed twice in May 1996 and again in December 1996 for a total of more than 200 ks. The observations were always simultaneous with hard X-ray observations conducted with the Rossi X-Ray Timing Explorer (RXTE). The EUVE light curves are extremely variable during each observation, with the maximum variability of more than a factor of 15 from peak to minimum. We detected signal in the EUVE spectrograph in the 75-100 Å range which is well fitted by absorbed power law models. We illustrate the results of our spectral and detailed power spectrum analysis performed on EUVE data and the comparison with RXTE lightcurves and discuss the constraint we can place on the mass of the central object and on the size of the emitting region.
1 Introduction
NGC 4051 (z=0.0023) is a low-luminosity narrow line Seyfert 1 galaxy which displays strong and rapid variability in the X-rays (e.g. Papadakis & Lawrence 1995) while its optical flux has not been seen to vary within 1 per cent even when the X-ray flux varied by a factor of 2 (Done et al. 1988). Given the presence of a very strong soft X-ray excess, the close distance and the low Galactic hydrogen column, N (Elvis, Lockman & Wilkes 1989), NGC 4051 was expected to be a strong source of extreme ultraviolet (EUV) radiation (58–740 Å or 0.02–0.21 keV) and indeed it was seen ( detection, Fruscione 1996) by the Extreme Ultraviolet Explorer Satellite (EUVE) during the all-sky survey.
We obtained simultaneous observations of NCG 4051 with the Rossi X-ray Timing Explorer (RXTE) and with the EUVE satellite to investigate if the source is variable in the EUV and if and how this energy band is related to the X-rays.
2 Observations
NGC 4051 was observed with the Deep Survey-Spectrometer (DS/S) onboard the EUVE satellite twice in May 1996 and once in December 1996 for a total of approximately 200 ks. The DS/S configuration (e.g. Welsh et al. 1990) allows simultaneous imaging and spectroscopy in the 58–740 Å (0.02–0.21 keV) region with a spatial resolution of and a spectral resolution of at the short wavelengths.
In May 1996 RXTE was observing NGC 4051 with several short observations (typical duration ks), while from December 13 to December 16 RXTE performed a long look which overlapped for ks with EUVE. Only RXTE data from the Proportional Counter Array (PCA), which covers the 2-60 keV band, were used.
3 EUVE: energy spectrum, lighcurves and power spectrum
NGC 4051 was detected by EUVE only in the region below Å because the interstellar medium severely attenuates the EUV spectrum at longer wavelengths; despite the long ( ks) total effective exposure, the signal to noise ratio (SNR) achieved in the spectrum is very low ( in the range 80-90 Å). We modeled the EUV spectrum of NGC 4051 over the 70-100 Å range with an absorbed power law of the form
where is a normalization factor, is the energy index and
the absorption is characterized by a column density N(X) and an
absorption cross section for each element.
We fixed the Galactic hydrogen column density at cm-2 (Elvis et al. 1989) and the ratios Hei/Hi=0.1
and Heii/Hi=0.01.
The best fit values are: and (at 0.155 keV).
Further information regarding the EUVE
spectrum can be found in Fruscione et al. 1998.
Thanks to the times larger effective area of the DS instrument, a much higher
SNR can be achieved in the lightcurves: the average SNR in each EUVE orbit
(5544 s on average) is about 6.5.
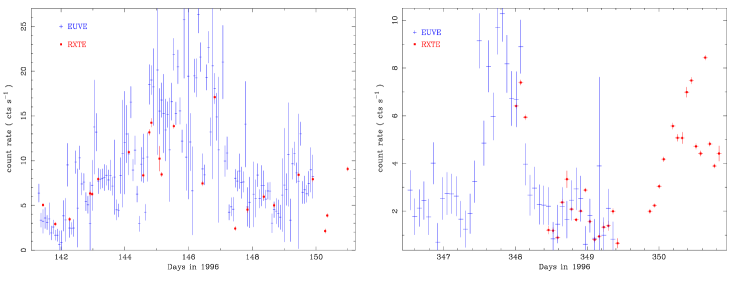
EUVE lightcurves binned over 5544 s are presented, together with RXTE
data, in
Figure 1; EUVE count rates were multiplied by a factor of 100 for presentation
purposes.
Both during May 20-28 and December 11-14, NGC 4051 was very variable showing changes by
a factor from peak to minimum; in December the source was in a lower state
(the average count rate in May was CR counts and in
December CR counts ) but showed similar variability.
We performed a power spectrum analysis on the lighcurves binned over 500 s (for details see Fruscione et al. 1998); the averaged and binned results are presented in Figure 2. We fitted the logarithm of the power spectrum with a model of the form
| (1) |
(which is a power law with slope for frequencies and flattens at frequencies ; the constant represents the power level due to the Poisson counting statistics) convolved with EUVE window function. The peaks in Figure 2 are due to the satellite orbital period and one of its harmonics.
Both May and December 1996 power spectra for NGC 4051 are well fitted by this model; the best fit parameters for the two power spectra are consistent within the 68% confidence regions. The slope of the power spectrum is steeper than 1.6, and the spectrum flattens at frequencies lower than Hz.

4 Comparison of EUVE and RXTE lightcurves
A comparison of EUVE and RXTE lightcurves, binned over one average EUVE orbit (5544 s), is presented in Figure 1, where EUVE data were scaled up of a factor of 100 for presentation purposes. The RXTE lightcurves were extracted in the 2-10 keV region where the count rate varies from 3 to 17.4 counts . A striking correlation between the two bands is clearly visible. We performed a cross-correlation analysis with the Discrete Correlation Function (DCF) of Edelson & Krolik 1988, between the EUVE band and the 4-10 keV RXTE band, excluding the 5-7 keV interval, to avoid both the iron line and the warm absorber. The DCF confirms that the best estimate of the lag is zero, although it is possible that the EUV band may lead the X-rays by days. (Further details can be found in Uttley et al. 1998)
5 Discussion
This first deep EUVE observation of NGC 4051 allowed a detailed power spectrum analysis: the QPO found in EXOSAT data cannot be confirmed since its frequency is very similar to EUVE orbit. If the break, found in the best fit of the power spectrum, were related to thermal instabilities in the accretion disk (Nowak 1994) and if we assume that the EUV emission comes from 7RS and keplerian orbit, we find that the mass of the central black hole lies in the range M⊙.
From the comparison of EUVE and RXTE lightcurves it is clear that there is a tight correlation between the EUV and the continuum X-ray emission; no lag was found down to 0.2 days and it could be further reduced down to 1 ks (Uttley et al. 1998). Assuming that the observed lag corresponds to the time interval needed to upscatter EUV photons to X-ray energies, we can constrain the size of the Comptonising region for a M⊙ black hole to RS for 0.2 day lay or to RS for 1 ks lag (see details in Uttley et al. 1998).
Acknowledgements
This work was supported by AXAF Science Center NASA Contract NAS 8-39073 and by NASA grant NAG 5-3174 and NAG 5-3191.
References
- 1
- 2 Done, C. et al.: 1988, Mon. Not. R. Astr. Soc. 243, 713.
- 3 Edelson, R.A., Krolik, J.H.: 1988, Astrophys. J. 333, 646.
- 4 Elvis, M., Lockman, F.J., Wilkes, B.J.: 1989 Astron. J. 97, 777.
- 5 Fruscione, A.: 1996, Astrophys. J. 459, 509.
- 6 Fruscione, A., Cagnoni, I., McHardy, I. M., Papadakis, I. E.: 1998, in preparation.
- 7 Papadakis I. E., Lawrence, A.: 1995 Mon. Not. R. Astr. Soc. 272, 161.
- 8 Nowak, M.A.: 1994, Astrophys. J. 422, 688.
- 9 Uttley, P. et al.: 1998, in preparation.
- 10 Welsh, B. Y. et al.: 1990, Opt. Eng. 29 752.
- 11