A Lensed Arc in the Low Redshift Cluster Abell 212411affiliation: Based on observations obtained at the W.M. Keck Observatory, operated as a scientific partnership by the California Institute of Technology, the University of California, and the National Aeronautics and Space Administration.
Abstract
We report the discovery of an arc-like object 27″ from the center of the cD galaxy in the redshift cluster A2124. Observations with the Keck II telescope reveal that the object is a background galaxy at , apparently lensed into an arc of length 85 and total R magnitude . The width of the arc is resolved; we estimate it to be 06 after correcting for seeing. A lens model of the A2124 core mass distribution consistent with the cluster galaxy velocity dispersion reproduces the observed arc geometry and indicates a magnification factor 9. With this magnification, the strength of the [OII] 3727 line implies a star-formation rate of yr-1. A2124 thus appears to be the lowest redshift cluster known to exhibit strong lensing of a distant background galaxy.
Subject headings:
galaxies: clusters: individual (Abell 2124) — galaxies: elliptical and lenticular, cD — gravitational lensing1. Introduction
The vast majority of known gravitational arcs have been identified in galaxy clusters at redshifts (see for instance the tabulations by LeFèvre et al. 1994 and Kneib & Soucail 1996). They have been used to place constraints on the mass distributions within these clusters free from any assumptions regarding hydrostatic or dynamical equilibrium (Narayan & Bartelmann 1998 give a recent review). Such instances of strong lensing also provide the opportunity to study the properties of the distant background galaxies that are magnified by the foreground cluster lenses.
One cluster with proposed to exhibit a gravitational arc is A3408 at (Campusano & Hardy 1996). Campusano, Kneib, & Hardy (1998) further investigated the possibility that the spiral galaxy at located 50″ from the central elliptical in A3408 is being lensed. They found that the lensing must be fairly weak, with a magnification factor 1.7. Even so, lensing in low-redshift clusters in general provides the opportunity to study core mass distributions at higher spatial resolutions than that afforded by the moderate to high-redshift clusters that have been the focus of most lensing studies so far.
Abell 2124 is a richness class 1 cluster at a redshift . Hill & Oegerle (1993) measured velocities for 66 galaxies with km s-1 in the field of A2124 and reported a cluster dispersion of km s-1; they noted that the high dispersion was primarily due to four galaxies with km s-1. Fadda et al. (1996) reanalyzed the velocity data and concluded km s-1 from 61 cluster members. This latter value is more appropriate to A2124’s fairly modest X-ray luminosity ergs s-1 in the 0.1–2.4 keV band (Ebeling et al. 1996). However, the cluster velocity dispersion profile shown by Fadda et al. appears to rise to km s-1 within kpc (where is the Hubble constant in units of 100 km s-1 Mpc-1).
As a Bautz-Morgan type I, Rood-Sastry class cD cluster (Abell et al. 1989; Struble & Rood 1987), A2124 is dominated by a single giant cD galaxy, UGC 10012. The cD has a central stellar velocity dispersion of km s-1 and a “secondary nucleus” at a projected separation of 11.2 kpc with a relative velocity of km s-1 (Blakeslee & Tonry (1992)). The cD itself has no significant peculiar velocity with respect to the cluster mean (Oegerle & Hill (1994)).
2. Observations
We observed the A2124 cD as part of a project to extend to larger distances and denser environments a previous survey of the globular cluster populations of brightest cluster galaxies (Blakeslee, Tonry, & Metzger 1997). In the course of inspecting the final image, we noticed a narrow arc-like object 27″ along the major axis from the cD center. The orientation of the arc suggested that it might be lensed, so we carried out further observations to test this hypothesis.
2.1. Imaging Data
The cD galaxy in A2124 was imaged in the band on the night of 28 April 1997 with the Low Resolution Imaging Spectrograph (LRIS, Oke et al. 1995) on the Keck II telescope under photometric conditions. The image scale was 0211 pix-1. As the goal was to detect faint globular clusters in the cD halo, the total integration time was 8400 s; the seeing in the final stacked image was 057. The data were reduced as detailed by Blakeslee et al. (1997). The photometric calibration of the image, determined from Landolt (1992) standard stars observed the same night, agreed to within 0.01 mag with that of a short -band photometric exposure taken with COSMIC (Dressler 1993) on the Palomar 5 m telescope.
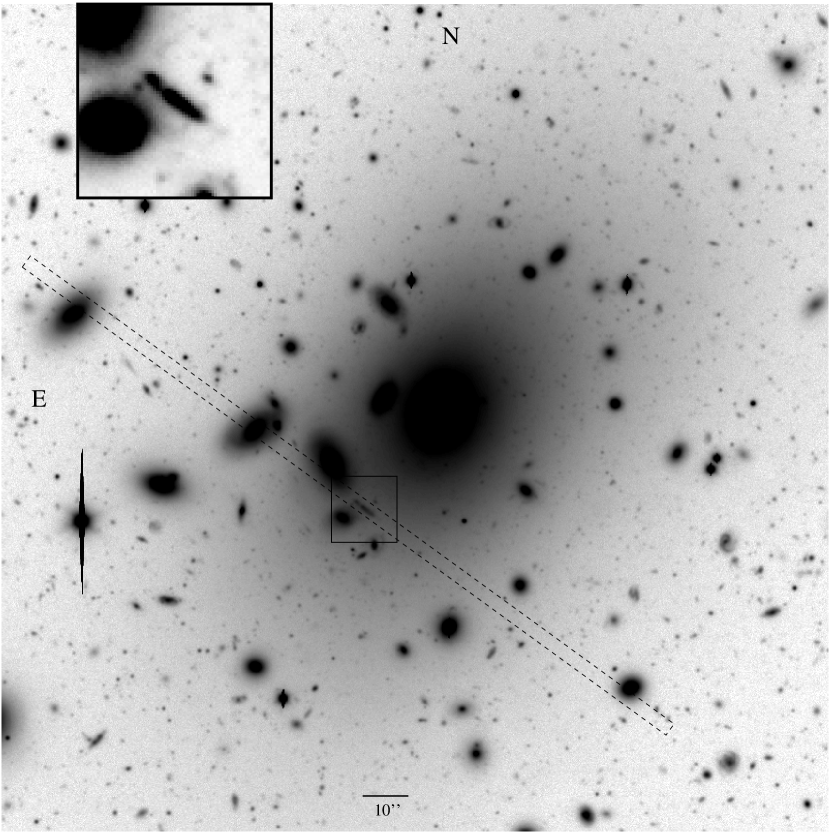
Figure 1 shows the central of the deep 8400 s -band Keck image. The arc is located from the center of the cD at a position angle PA141∘, very close to the major axis of the cD. The elliptical cD isophotes at radii along the major axis are oriented at PA. (At , the cD isophotes are at PA157∘ and are less elliptical.) The cD halo has a surface brightness mag arcsec-2 at the position of the arc.

The isophotal contour map plotted in Figure 2 reveals substructure in the A2124 arc. The brightest intensity peak is located near the arc center, with two fainter peaks near either end of the main part of the arc. A faint tail extends 15 further to the southwest along the same line as the main part of the arc. There is a stellar object located 12 to the southeast of the intensity peak at the northeast end of the arc; because it does not follow the same locus, we believe this object is unassociated with the arc (compare the inset in Figure 1). Its magnitude corresponds to the brightest globular clusters in the cD. After all sources of contamination are accounted for, and corrected for 0.07 mag of Galactic extinction (Schlegel, Finkbeiner, & Davis (1998)), the total magnitude of the arc is .
The axis ratio of the arc is poorly defined because of the substructure. The axis ratio of the 23.4 mag arcsec-2 isophote (about half the intensity of the brightest isophote plotted) is 4.8, and would be 5.7 in the absence of seeing. However, the total length of the arc including the faint tail to the southwest is at least 85, and the full width at half maximum normal to the arc at the central or northeast intensity peaks is , which would be in the absence of seeing. Using these measures, the axis ratio is then . By measuring the deviation from lines drawn from one end of the arc to the other, we estimate the radius of curvature to be .
We also obtained s of -band integration with COSMIC on the Palomar 5 m. The seeing in the stacked image was 17, making it difficult to measure an accurate color. For the brightest 7″ of the arc, we find .
2.2. Spectroscopic Data
We obtained two 900 s spectra of the arc with LRIS on the night of 18 June 1998. A 300 line grating blazed at 5000 Å gave a dispersion of 2.44 Å pix-1 and wavelength coverage of 4000–9000 Å. The slit was 1″ wide, yielding a resolution of 10 Å. The slit was oriented at a PA of 541, aligned with the bright nucleus of the S0 galaxy 30″ northeast of the arc, as shown in Figure 1. The alignment galaxy has an absorption spectrum that indicates it is an A2124 member at . Halogen flats and arc-lamp exposures were taken after each spectrum, and standard IRAF routines were used for extraction and wavelength calibration. The spectra were flux calibrated using a spectrum of Feige 110 taken at the end of the night. Variable seeing and the presence of thin, patchy cirrus makes the absolute calibration uncertain.
The raw two-dimensional spectra show one bright emission line at the spatial position of the arc, tilted obliquely with respect to the night sky lines. The tilt is at least partly the result of the misalignment of the arc and the slit. On close inspection of the sky-subtracted 2-d spectra, two other much weaker emission lines are visible at longer wavelengths with the same tilt as the brighter line. The total tilt is consistent with the width of the slit, and the length of the emission in the spatial direction is consistent with the length of the main part of the arc in the -band image. This indicates that the arc was well-centered within the slit and that the seeing was somewhat better than 1″.
Figure 3 shows the final calibrated 1-d spectrum of the arc. Identifying the strong emission line at 5863.5 Å with [OII] Å gives a redshift . Identifying the line observed at 7798.2 Å as [OII] gives . Unfortunately, H lands in the midst of the atmospheric absorption of the Fraunhofer band. There does appear to be real emission (as evidenced by the 2-d spectrum) corresponding to H at , but the irregular profile of the band makes the precise position unreliable. The other Balmer features identified in the figure give an average . Relying mainly on the [OII] line and including calibration uncertainty, we adopt a redshift .
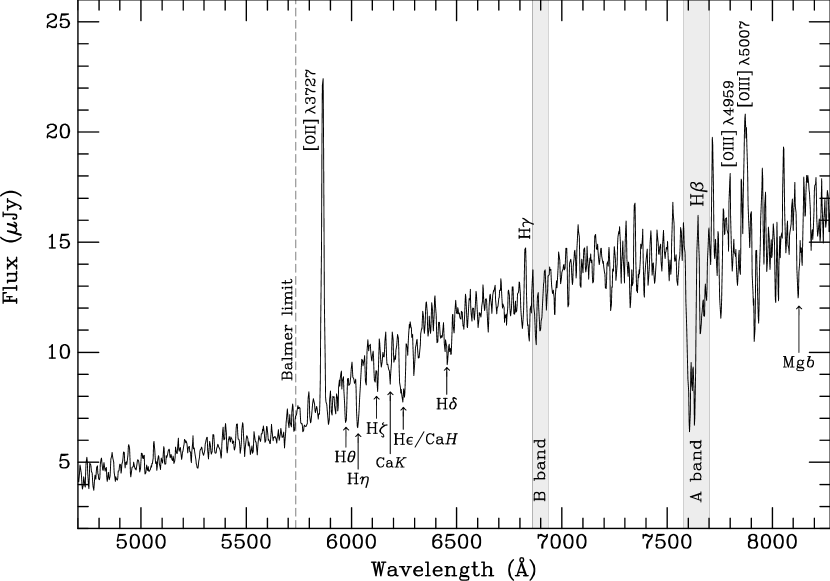
We can identify some other absorption features in the arc spectrum. Mg absorption is visible around 8135 Å, in a gap between night sky emission lines. The Ca absorption line appears weaker than the Ca line because the latter is blended with H. Similarly, there is not a strong 4000 Å break, but there is a change in spectral slope corresponding to the Balmer limit near 5735 Å.
In comparison to the galaxy spectra in the atlases of Kennicutt (1992a) and Liu & Kennicutt (1995), the A2124 arc spectrum most resembles those of the “post-starburst” galaxies suggested to be the local analogs of distant E+A galaxies (Dressler & Gunn 1983). These are low ionization systems that may have strong [OII] and H (off the end of our spectrum) emission from ongoing star formation, sometimes show weak emission at H and H, but have the rest of the Balmer series appearing strongly in absorption; they are thought to be evolved merger events. This is what we see, although the [OII] equivalent width measured for the arc Å would place it among the youngest of these “post-starburst” galaxies.
3. Lens Models
To model the cluster as a lens, we use an elliptical potential of the form (Blandford & Kochanek 1987)
where is the line-of-sight velocity dispersion in the limit for the spherical case, and are angular size distances to the source and from the lens to the source, respectively, and defines a softening radius. The ellipticity enters in the definition of ,
where the coordinates are aligned along the major and minor axes of the potential. This represents a softened isothermal sphere for , and tends to represent the shape of dark halo potentials fairly well near the cores of clusters (e.g., Tyson et al. 1998). We chose the more limited relation with a fixed power law, as there are few lensing constraints in this system to differentiate various potential profiles.
We also chose to fix many of the model parameters using observational constraints where available. The orientation and ellipticity of the cluster potential were set based on the measured of cD halo light profile, using the approximation , following Mellier et al. (1993). The center of the cluster potential was fixed at the cD center. Two additional spherical terms with were added to represent the central cusp of the cD itself and the halo of the bright galaxy 12″ northeast of the arc. The cD potential was normalized by setting the asymptotic dispersion km s-1 from the measured central dispersion (Blakeslee & Tonry (1992)), and km s-1 was assumed for the bright galaxy.
Our primary constraints for the lens model are the arc radius, size, and orientation. The lack of a counterarc suggests a source position that lies outside the tangential and radial caustics (e.g., Grossman & Narayan 1988). However, the length of the arc could imply either a much longer arc opposite that is not observed, or a shorter demagnified arc that would be ambiguous without redshift information.
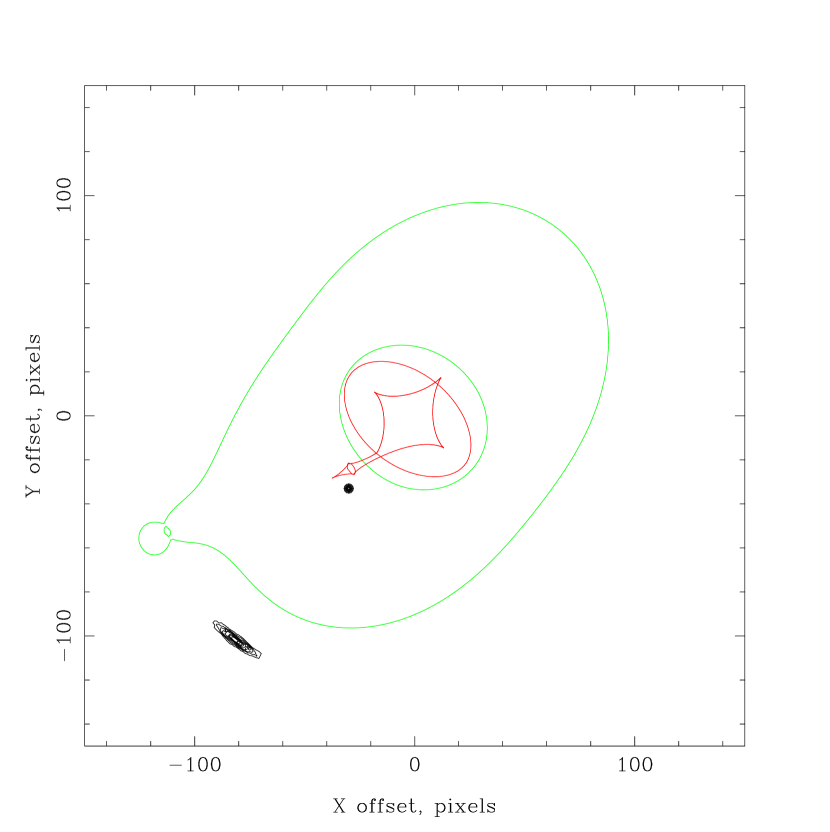
A family of models with a range of core radii and asymptotic dispersions for the primary lens (cluster dark matter) were found that reproduce the characteristics of the arc. These models are degenerate in and for determining the mass enclosed within the arc radius. Models with large core radii tend to produce larger radial magnifications, leading to smaller intrinsic source sizes and larger total magnifications. Fixing the velocity dispersion to the Fadda et al. (1996) value of 878 km s-1, we find a best-fit model having ″ (9 kpc) and a roughly round source 04 in extent with an unlensed position 61 east and 68 south of the cD center. Figure 4 shows the source and image planes for this model, along with the caustic and critical curve structure. The magnification of the source ranges between 9 and 13 for the family of best-fit models.
4. Discussion
We find that quite reasonable values of the physical parameters of the cluster and source can naturally produce a lensed arc at the observed radius. Though our best-fit core radius for the cluster may seem small, it has been shown that cluster potentials as measured by lensing in higher redshift clusters tend to be steeper near the center than implied by models of the X-ray emission (LeFèvre et al. 1994; Waxman & Miralda-Escude 1995). The intrinsic dispersion of this cluster is also somewhat ambiguous, and adopting dispersions nearer the larger estimate (§1) implies larger core radii. The core radius is not strongly affected by changing the model of the cD potential, which is a relatively small perturbation on the cluster potential. There are several faint sources in the field that appear arc-like and may be strongly lensed; having arcs at different radii would allow better constraints on the slope of the potential near the core.
At and in the absence of lensing, 1″ corresponds to 4.3–3.7 kpc (–0.5). The observed 85 arc length would then imply a physical length of 53 kpc (for , ), or 64 kpc (). With a -correction of 0.4 mag, the observed magnitude would correspond to , nearly (Lin et al. 1996, with ). The observed color is that of an E+A galaxy in which the merger/starburst occurred 0.5 Gyr ago (Belloni et al. 1995; Belloni & Röser 1996).
We noted that the arc’s spectrum resembles that of some “post-starburst” galaxies. From the observed [OII] emission, we can infer the ongoing star-formation rate (SFR). The total [OII] line flux in the spectrum shown in Figure 3 is ergs s-1 cm-2. We estimate the total flux to be larger by 15–20% due to the placement of the arc in the slit and the better seeing for the flux standard spectrum. However, the presence of thin cirrus makes the absolute flux uncertain by at least another 10%. We therefore conservatively adopt ergs s-1 cm-2. This translates to a luminosity ergs s-1. Adopting the mean relation from Kennicutt (1998) and setting yields yr-1. The SFR calibration based on [OII] equivalent width and observed luminosity (Kennicutt 1992b, modified as in Kennicutt 1998) is intrinsically much less certain but gives a similar result.
The galaxy would thus be an extremely large and luminous, linear or flattened galaxy with a lumpy morphology and a substantial amount of ongoing star formation. These points would be indicative of a large merger event, except for the narrow, slightly curved shape. The extreme length if unlensed (50–65 kpc) by itself suggests that the arc is a gravitationally magnified image of a smaller object with a more modest SFR.
Further observations might help to confirm the lens model and constrain the cluster mass profile at small physical radii. A weak lensing analysis would help to determine the radial mass profile; such an analysis is in progress but complicated by the extensive globular cluster population. A2124 would be an ideal target for a wide-field imager on a 4 m class telescope (e.g., Boroson et al. (1994); Metzger, Luppino, & Miyazaki 1995). A search for a counterarc via longslit spectroscopy might prove fruitful, since the acceptable image positions would lie roughly along a line. The demagnification in models with additional images yields sources not much fainter than , and given the strong emission line in the lensed galaxy, this could be detected with Keck spectroscopy. In addition, HST observations of the arc and possible additional arcs might show substructure that would provide further lens mapping constraints.
5. Summary and Conclusions
We have identified an arc-like object at located 27″ along the major axis from the center of the cD galaxy in A2124 (). The total magnitude of the arc is , corrected for Galactic extinction, and the color is . There are three intensity peaks along its length and a faint extension 15 to the southwest that makes the total length 85, and the axis ratio 14. The spectrum shows strong [OII] emission with Å and strong higher-order Balmer absorption; it thus resembles the spectra of some “post-starburst” galaxies. If the object were unlensed, the observed length would correspond to a physical size of 50–65 kpc, and the observed [OII] emission would imply yr-1 (). We believe it is more likely that the arc is the magnified image of a smaller background object, and the true SFR is less than a tenth of this. A simple lens model, appropriate to the core of A2124, produces an arc radius equal to that observed. This model and the observed geometry strongly support the lensing hypothesis for the A2124 arc; further observations may yield additional constraints that could confirm or reject this hypothesis. Finally, as the probability of such distant galaxies being lensed by nearby clusters depends on the poorly-known shape of the inner cluster potential, it would be worthwhile to try to find these lenses in a systematic, rather than serendipitous, manner.
References
- Abell et al. (1989) Abell, G. O., Corwin H. G. Jr. & Olowin, R. P. 1989, ApJS, 70, 1
- Belloni et al. (1995) Belloni, P., Bruzual, A. G., Thimm, G. J., & Röser, H.-J. 1995, A&A, 297, 61
- Belloni & Röser (1996) Belloni, P. & Röser, H.-J. 1996, A&A, 118, 65
- Blakeslee & Tonry (1992) Blakeslee, J. P. & Tonry, J. L. 1992, AJ, 103, 1457
- Blakeslee et al. (1997) Blakeslee, J. P., Tonry, J. L., & Metzger, M. R. 1997, AJ, 114, 482
- Blandford & Kochanek (1987) Blandford, R. D. & Kochanek, C. S. 1987, ApJ, 321, 658
- Boroson et al. (1994) Boroson, T., Reed, R., Wong, W.-Y., & Lesser, M. 1994, Proc. SPIE, 2198, 877
- Campusano & Hardy (1996) Campusano, L. D. & Hardy, E. 1996, in Astrophysical Applications of Gravitational Lensing, ed. C. S. Kochanek & J. N. Hewitt (Dordrecht: Kluwer), 125
- Campusano et al. (1998) Campusano, L. D., Kneib, J.-P., & Hardy, E. 1998, ApJ, 496, L79
- Dressler (1993) Dressler, A. 1993, in Palomar Obs. Ann. Rep. 1993, 2
- Dressler & Gunn (1983) Dressler, A. & Gunn, J. E. 1983, ApJ, 270, 7
- Ebeling et al. (1996) Ebeling , H., Voges, W., Bohringer, H., Edge, A. C., Huchra, J. P., Briel, U. G. 1996, MNRAS, 281, 799
- Fadda et al. (1996) Fadda, D., Girardi, M., Giuricin, G., Mardirossian, F., Mezzetti, M. & Biviano, A. 1996, ApJ, 473, 670
- Grossman & Narayan (1988) Grossman, S. A. & Narayan R. 1988, ApJ, 324, L37
- (15) Hill, J. M. & Oegerle, W. R. 1993, AJ, 106, 831
- (16) Kennicutt, R. C. 1992a, ApJS, 79, 255
- (17) Kennicutt, R. C. 1992b, ApJ, 388, 310
- Kennicut (1998) Kennicutt, R. C. 1998, ARA&A, 36, in press
- Kneib & Soucail (1996) Kneib, J.-P. & Soucail, G. 1996, in Astrophysical Applications of Gravitational Lensing, ed. C. S. Kochanek & J. N. Hewitt (Dordrecht: Kluwer), 113
- Landolt (1992) Landolt, A. U. 1992, AJ, 104, 340
- LeFèvre et al. (1994) LeFèvre, O., Hammer, F., Angonin, M. C., Gioia, I. M., & Luppino, G. A. 1994, ApJ, 422, L5
- Lin et al. (1996) Lin, H., Kirshner, R. P., Shectman, S. A., Landy, S. D., Oemler, A., Tucker, D. L., & Schechter, P. L., 1996, ApJ, 464, 60
- Liu & Kennicut (1995) Liu, C. T. & Kennicutt, R. C. 1995, ApJS, 100, 325
- Mellier et al. (1993) Mellier, Y., Fort, B., & Kneib, J.-P. 1993, ApJ, 407, 33
- Metzger et al. (1996) Metzger, M. R, Luppino, G. A., & Miyazaki, S. 1995, BAAS, 187, 7305
- Narayan & Bartelmann (1998) Narayan, R. & Bartelmann, M. 1998, in Proc. 1995 Jerusalem Winter School, Formation of Structure in the Universe, ed. A. Dekel & J. P. Ostriker (Cambridge: Cambridge Univ. Press)
- Oegerle & Hill (1994) Oegerle, W. R. & Hill, J. M. 1994, AJ, 107, 857
- Oke et al. (1995) Oke, J. B., Cohen, J. G., Carr, M., Cromer, J., Dingizian, A., Harris, F. H., Labrecque, S., Lucinio, R., Schaal, W., Epps, H., & Miller, J. 1995, PASP, 107, 307
- Schlegel, Finkbeiner, & Davis (1998) Schlegel, D., Finkbeiner, D., & Davis, M. 1998, ApJ, 500, 525
- Struble & Rood (1987) Struble, M. F. & Rood, H. J. 1987, ApJS, 63, 555
- Tyson et al. (1998) Tyson, J. A., Kochanski, G. P., & Dell’Antonio, I. P. 1998 ApJ, 498 L107
- Waxman & Miralda-Escude (1995) Waxman, E. & Miralda-Escude, J. 1995, ApJ, 451, 451