Optical and near-infrared imaging of faint
Gigahertz Peaked Spectrum sources
Abstract
A sample of 47 faint Gigahertz Peaked Spectrum (GPS) radio sources selected from the Westerbork Northern Sky Survey (WENSS, Rengelink et al. 1997), has been imaged in the optical and near infrared, resulting in an identification fraction of 87%. The and colours of the faint optical counterparts are as expected for passively evolving elliptical galaxies, assuming that they follow the band Hubble diagram as determined for radio-bright GPS galaxies. We have found evidence that the radio spectral properties of the GPS quasars are different from those of GPS galaxies: The observed distribution of radio spectral peak frequencies for GPS sources optically identified with bright stellar objects (presumably quasars) is shifted compared with GPS sources identified with faint or extended optical objects (presumably galaxies), in the sense that a GPS quasar is likely to have a higher peak frequency than a GPS galaxy. This means that the true peak frequency distribution is different for the GPS galaxies and quasars, because the sample selection effects are independent of optical identification. The correlation between peak frequency and redshift as has been suggested for bright sources has not been found in this sample; no correlation exists between magnitude (and therefore redshift) and peak frequency for the GPS galaxies. We therefore believe that the claimed correlation is actually caused by the dependence of the peak frequency on optical host, because the GPS galaxies are in general at lower redshifts than the quasars. The difference in the peak frequency distributions of the GPS galaxies and quasars is further evidence against the hypothesis that they form a single class of object.
1 Introduction
Extragalactic radio sources have been studied for many years, but it is still unclear how they are formed and evolve. A crucial element in the study of their evolution is to identify the young counterparts of the “old” FRI/FRII extended objects. Good candidates for young radio sources are those with peaked spectra (Gigahertz Peaked Spectrum (GPS) sources and Compact Steep Spectrum (CSS) sources, Fanti et al. 1995, Readhead et al. 1996, O’Dea and Baum 1997, O’Dea 1998), because they are small in angular size as expected for young sources. GPS sources are characterized by a convex radio spectrum peaking at a frequency of about 1 GHz and are typically 100 pc in size. CSS sources have a peak in their spectrum at lower frequencies and have projected linear sizes of Kpc. A commonly discussed alternative to them being young, is that they are small due to confinement by a particularly dense and clumpy interstellar medium that impedes the outward propagation of the jets (O’Dea et al 1991).
Important information about the nature of Gigahertz Peaked Spectrum GPS sources comes from the properties of their optical counterparts. Systematic optical identification programs on GPS sources have been performed by O’Dea et al. (1990), Stanghellini et al. (1993) and de Vries et al. (1995), and these show that the optical counterparts are a mixture of galaxies and quasars. O’Dea et al. (1990) and Stanghellini et al. (1993) found that disturbed optical morphologies are a common characteristic of GPS galaxies, with many of them having close companions or appearing to lie in a group or cluster. This may indicate that galaxy-galaxy interactions and/or mergers play an important role in the GPS phenomenon. GPS galaxies appear to be a homogeneous class of giant ellipticals with old stellar populations (Snellen et al. 1996a, 1996b, O’Dea et al. 1996). Their optical to near-infrared fluxes seem not to be contaminated by light produced by the active nucleus, and they are therefore potentially useful probes of galaxy evolution.
In the light of the orientation unification scheme (eg. Barthel 1989), it would be expected that the redshift distributions of GPS sources identified with galaxies and quasars are more or less the same. However, the GPS quasars tend to be at much higher redshift than the galaxies (, O’Dea et al. 1991). In addition, the intrinsic peak frequency distributions and radio morphologies seem to be different for GPS galaxies and quasars (Stanghellini et al. 1996). These results are probably influenced by several selection effects, but if true, they may indicate that GPS galaxies and quasars are not unified by orientation, but form separate classes of object which happen to have similar radio spectra.
To further address these issues, we have started to investigate GPS sources at fainter flux density levels (Snellen et al. 1995, Snellen et al. 1998) than those in the samples of bright GPS sources studied until now (O’Dea et al. 1991, de Vries et al. 1997, Stanghellini et al. 1998). By comparing the properties of these new faint samples with those of bright samples in the literature, we shall investigate properties of GPS sources as a function of radio luminosity, redshift and rest frame peak frequency.
This paper describes the optical and near-infrared imaging of a sample of faint GPS sources selected from the Westerbork Northern Sky Survey (WENSS Rengelink et al. 1997).
2 The Sample of Faint GPS Sources
The selection of the sample has been described in detail in Snellen et al. 1998 (paper I). Candidate GPS sources selected from the Westerbork Northern Sky survey, are those with an inverted spectrum between 325 MHz and higher frequencies. The sources are located in two regions of the survey; one at and , which is called the mini-survey region (Rengelink et al. 1997), and the other at and . Additional observations at 1.4, 5, 8.4 and 15 GHz were carried out with the Westerbork Synthesis Radio Telescope (WSRT) and the Very Large Array (VLA), yielding a sample of 47 genuine GPS sources with peak frequencies ranging from 500 MHz to more than 15 GHz, and peak flux densities ranging from to mJy. To determine whether the GPS sources have an optical counterpart on the Palomar Sky Survey plates (POSS), the Automatic Plate Measuring (APM) catalogue (Irwin et al. 1994) and the HST Guide Star Catalogue (Russel et al. 1990) were used for the sources in the mini-survey region and in the region , respectively. This information was used for finding charts, to determine the required exposure times for the observations, and for astrometric purposes.
3 Observations
The sample was imaged in the optical in the course of three observing sessions (see table 1), with the 0.9m Jacobus Kapteyn Telescope (JKT), the 2.5m Isaac Newton Telescope (INT) and the 2.5m Nordic Optical Telescope (NOT), all located at Observatorio del Roque de los Muchachos on La Palma, Spain. The sample was also observed in the near-infrared with the 4.2m William Herschel Telescope (WHT), and with the NOT. The INT, NOT and WHT observations were done as part of the international CCI observing time awarded to the WENSS team in 1995.
During the different observing sessions, several standard stars from Landolt (1983) were observed for photometric calibration. A summary of the relevant parameters for the observations is given in table 1.
| Telescope | Observing | Detector | Filter | Detector | Pixel | Field of |
|---|---|---|---|---|---|---|
| Date | Size | Size | View | |||
| JKT | 3-9 Jun. 1994 | CCD | R, I | |||
| INT | 6 Apr. 1995 | CCD | R | |||
| NOT | 1-5 Oct. 1995 | CCD | R | |||
| WHT | 28&31 Jan. 1996 | WHIRCAM | K | |||
| NOT | 15-17 Aug. 1995 | ARNICA | J, K | |||
| NOT | 5-6 Sep. 1995 | ARNICA | J, K |
JKT CCD Imaging
Six nights of observing time were obtained on the JKT, from 3 to 9 June 1994. All 25 GPS sources in the sample from the mini-survey region were observed in and bands using Harris filters (Matura et al. 1993), which have, in combination with the GEC7 CCD, effective wavelengths of 6550 and 8260 Å and FWHM bandwidths of 1500 and 3000 Å for the and filters respectively. Typical observing times were seconds for the POSS detections and seconds for the unidentified sources on the POSS. The GEV7-chip used as the detector has a projected pixel size corresponding to 0.3 ′′, and a total field of view of . In addition to the Landolt standards, spectroscopic standards were measured to determine the absolute flux density scale for the particular set of filters. Limiting surface brightnesses () were for the longest exposures typically 26.1 and 25.3 mag/arcsec-2 in respectively and band. The weather was photometric during the run, except for the second half of the night on 7 June. The sources observed on 7 June were re-observed briefly on 9 June for photometric calibration purposes.
INT CCD Imaging
Sources which had not been detected with the JKT were reobserved using the INT on 6 April 1995. These objects, B1525+6801, B1551+6822, B1600+7131, B1620+6406, B1639+6711, B1655+6446, and B1808+6813, were observed in band using a 10241024 TEK-chip and Harris filter (, FWHM=1500 Å). Each source was observed for 15 minutes under photometric conditions. Limiting brightnesses () were typically 27.3 mag/arcsec-2 for the longest exposures. The CCD detector had a pixel scale of and a field of view of .
NOT CCD Imaging
Sources in the region and were observed using the NOT in the period 1 to 5 October 1995. A 10241024 TEK Chip in combination with a Harris band filter (, FWHM=1500 Å) was used. The CCD detector had a pixel scale of and a field of view of . One source, B1954+6146, was also observed using an band filter which, in combination with the TEK CCD, had an effective wavelength of 8300 Å. Limiting brightnesses () were typically 27.0 mag/arcsec-2 for the longest exposures. The conditions were photometric during the whole run.
NOT ARNICA Observations
About half of the GPS sources in the mini-survey region were observed in band (), and some in band ()using the ARcetri Near Infrared CAmera (ARNICA) on the NOT, from 15 to 17 August and on 5 and 6 September 1995. These observations are discussed in detail by Villani and di Serego Alighieri (1998). ARNICA utilizes a NICMOS 3 (256 256 pixels) array as a detector, with a projected pixel size corresponding to and a field of view of . In order to ensure background limited images and to avoid saturation of the brightest sources, the total exposure time on each source was divided into a number of shorter exposures, between which the telescope was moved in a 9 position raster. The total exposure times were between 6 and 30 minutes, depending on the expected magnitude of the object.
WHIRCAM Observations
Seventeen sources in the region were observed on 28 and 31 January 1996, using the WHT Infrared Camera (WHIRCAM). WHIRCAM utilizes a InSb array detector, and was used as a direct camera with an image scale of 0.24 arcsec/pixel. Each source was observed in band () with an 8 position jitter pattern. At each position the field was integrated for 2, 4 or seconds using the ND_STARE mode, meaning that the array is reset and read immediately and read again after the exposure time. This resulted in total exposure times of 160, 320 or 800 seconds, depending on the expected magnitude of the object. Two sources, B0830+5813 and B0755+6354, were observed on 28 January 1996 through thin cirrus. The conditions on 31 January were photometric.
3.1 Optical Data Reduction and Calibration
The reduction of the optical observations was carried out with the software packages IRAF from the NOAO and AIPS from the NRAO. The fits images were loaded into IRAF and bias subtracted and flat fielded in the standard manner. Positional calibration was then carried out within AIPS using the task XTRAN. Positions of stars in the CCD fields were taken from the APM catalogue (Irwin et al. 1994) for the sources in the mini-survey region and the HST Guide Star Catalogue for the sources with . These positions have an intrinsic rms accuracy of typically . The epoch and equinox of the reference coordinate system was then converted from B1950 to J2000 using the AIPS task EPOSWITCH.
The absolute flux density scale was determined using the spectroscopic standard stars observed during the JKT run. This was done by combining the tabulated stellar spectra (Stone 1977) with the filter relative transmission curves and the CCD response. An object of zero magnitude, observed in the Harris band filter, was estimated to have a flux density of at 6550 Å. An object of zero magnitude, observed in the Harris band filter, has been estimated to have a flux density of at 8900 Å. The filter response curves indicate that these absolute calibration measurements can also be applied to the Harris band observations on the NOT and the INT, due to the similar CCD characteristics. The band filter used on the NOT had no absolute photometric calibration information available. However, since the filter bandpass is similar to the Harris I band filter used on the JKT, the same absolute calibration was used.
3.2 Near-infrared Data Reduction and Calibration
The data of the ARNICA and WHIRCAM observations were reduced using IRAF. The images were dark-subtracted and then flat-fielded by median filtering the image stack. Thereafter the frames were normalized and mosaiced together to produce one final image per object. In the case of the ARNICA observations, it was necessary to do the background subtraction from each frame before flat-fielding, in order to eliminate the contribution of the thermal emission from the background and the telescope. UKIRT faint standards were observed several times during the nights at a range of air-masses. Although the WHIRCAM observations were done using a short filter, the band magnitude system has been used for which zero magnitude corresponds to a flux density of . Astrometric measurements have been done in the same way as in the optical, using positions of objects in the band CCD images that were also in the near-infrared fields.
3.3 Identification Procedure
The procedure for identifying a GPS source in the optical is simplified compared to large size radio sources, because the angular size of the radio source is very small compared to the optical resolution. The likelihood method (eg. de Ruiter et al. 1977) was used to quantify our identification procedure. The reliability of a proposed identification has been assessed using the observed differences between the optical and radio positions and their errors and the optical background counts. For each candidate counterpart the following dimensionless measure of the uncertainty in position difference, , was calculated.
| (1) |
where and are the offsets between the optical and radio positions, and and the uncertainties in the optical right ascension and declination positions. The error in the radio position is small compared to the error in optical position ( versus ) and was therefore neglected.


An optical object is considered to be a candidate identification if it is located within an angular distance from the radio position. Only six sources did not have a candidate identification in the optical or near-infrared. The radio-optical offsets are shown in figure 1 for the sources in the mini-survey region and in the region . For the sources in the region and , a median position offset of in declination was found between the optical and the radio. This was removed before determining the dimensionless position uncertainties. The cause of this offset is not clear. The median position offsets in for the region , and in both and for the sources in the mini-survey region were found to be smaller than and therefore not taken into account.
The background density of objects, , on the CCD frames, depends mainly on the galactic latitude and magnitude limit of the observation, and was in each case estimated by counting the number of objects on the CCD frames for each source. The background densities range from 5 to objects per square arcminute. The likelihood method assumes that a radio source and its optical identification always coincide in position, and that the true identification is always closer to the radio source than the first contaminating object. Given the normalized position difference for a certain radio optical pair, the likelihood ratio is defined by (de Ruiter et al. 1977);
| (2) |
where . This is the ratio of the probability that a given object found between and is the correct identification , divided by the probability that it is a contaminating object . We have used a likelihood ratio cut off of 2.0, which means that a source is considered to be identified if the probability that the given object is the correct identification is twice the probability that it is a contaminating background source. A likelihood ratio of 2.0 corresponds to an optical to radio offset of for a background density of 10 objects per square arcminute. Note that all the candidate identifications fall within this limit, except for B1647+6225 which has two candidate counterparts, of which the closest one is selected as a possible identification.
Using a likelihood ratio cutoff of 2.0, we find an identification fraction of 87%. This identification fraction can be related to the two a posteriori probabilities that the object found at an angular distance from the radio source position is a genuine identification, , or a confusing object, , using Bayes’ theorem (eg. Röttgering et al. 1995).
| (3) |
The completeness, , of the identifications, which is the number of accepted identifications over the number of correct id’s, and the reliability, , which is the fraction of identified sources for which the identification is correct, are given by:
| (4) |
| (5) |
Sources in our sample which remain unidentified have no optical and/or near-infrared counterpart within of the radio position. This corresponds to a completeness of . The reliability is determined to be 97.6%, which implies that it is probable that one source will have an erroneous identification.
3.4 Parameters of the Optical Counterparts
The magnitudes enclosed within a circular aperture were measured for all the candidate identifications within various radii from the peak brightness of the object. These radii are between and , depending on the angular size of the optical identification. Furthermore, for the sources with , the FWHM of the object was measured and compared to that of stars in the frame, in order determine if it is an unresolved or an extended source. A detection limit in a aperture is taken as an upper limit for sources without a candidate identification. The measured magnitudes were then corrected for the galactic foreground extinction using data from Burnstein and Heiles (1984) derived from HI column densities, assuming an extinction curve proportional to . This might be too large a correction in the near-infrared, however extinction correction are small at those wavelengths anyway. These extinction data have been taken from the NASA/IPAC extragalactic database (NED).
4 Results and Discussion
The results for the individual sources are presented in table 2. Column 1 gives the source name; columns 2 the optical positions (J2000) for the candidate identifications; columns 3 and 4 the radio-optical position offsets in right ascension and declination; column 5 the dimensionless position error; column 6 gives the morphological classification of the identification (F=Faint , S=Star-like, E=Extended), column 7 the galactic foreground extinction in band, column 8 the aperture diameter used for measuring the magnitudes and column 9, 10, 11 and 12 give the , , , and band magnitudes respectively.
The optical and near-infrared images are presented in the appendix, with notes on individual sources. All the band and WHIRCAM band, and the band images with detections are shown. The near-infrared maps taken with ARNICA are shown by Villani and di Serego Alighieri (1998). The and band images show a region of , and the band images a region of around the radio position. To reduce the effect of digitization of the contours, the data was convolved with a Gaussian with a FWHM of 3 pixels. The contours are at 3, 6, 12, 24, 48, etc. times the sky noise for the bright sources, and at 3, 4, 6, 12, 24, 48 etc. times the sky noise for the faintest sources. The level of the faintest contour in mag/arcsec2 is given at the top-right corner of each image.
4.1 Magnitude and Colour Distributions

Figure 2 shows the band magnitude distribution of the sources in the sample. If a radio source has more than one candidate identification, the one closest to the radio position was taken as the ID. The shaded areas indicate identifications with star-like objects, which are assumed to be quasars. In our sample there are 6 bright galaxies (13%), 20 bright quasars (43%), and 21 faint objects (44%) for which morphological classification is uncertain. This was compared with the radio bright sample of Stanghellini et al. (1998) containing 33 sources, which is complete to a flux density of 1 Jy at 5 GHz. For this radio bright sample, the percentages are % for the bright galaxies, % for the quasars, and % for the faint objects with . While the percentages of bright quasars in both samples are the same within the errors, the ratio of bright to faint galaxies is lower in our faint sample than in the radio bright sample at a level. Assuming that the faint optical objects are galaxies, this may indicate that the redshift distribution of GPS galaxies in our sample is more biased towards higher redshift.


Figure 3 shows the available and colours as function of band magnitude. The diamond symbols represent the extended objects, the crosses the star-like objects, and the squares the faint identifications. The dotted lines show the upper and lower limits on colour for a spectral energy distribution of with , which is the expected range for of radio loud quasars (eg. Baker and Hunstead 1995). All the colours of the stellar objects are within the expected range for quasars, except for two colours and one colour. These are slightly redder than expected which may be due to the contribution of emission lines in the or band.
The solid lines represent the and colours expected for passively evolving ellipticals, assuming that the galaxy magnitudes lie on the band Hubble diagram for GPS sources defined in Snellen et al. (1996a). The colours of the extended and faint identifications are consistent with this, but four from the six faint objects with measured colours are bluer () than expected. These could still be passively evolving ellipticals with high formation redshifts as long as they are intrinsically fainter than expected on the basis of the band Hubble relation. Indeed the Hubble diagram is poorly determined for galaxies with . The discrepancy of 1.5 magnitudes in colour for a galaxy could be explained if it is not at a redshift of 1.3, but at a redshift of 1.0. This is well within the uncertainties of the Hubble diagram at such a high redshift.
4.2 The Optical Morphologies and Environments


It has been claimed by Stanghellini et al. (1993) that 75% (8 out of 11) of the GPS galaxies in the radio bright sample with have distorted isophotes, double nuclei or close neighbours. There are four galaxies in our sample which have and can be used to check this claim. The angular morphologies of B0830+5813, B1622+6630, B1819+6707 and B1946+7048 have ellipticities of 0.173, 0.026, 0.070, and 0.031, with position angles of , , , and respectively. Contour plots of the two brightest galaxies, B0830+5813 and B1946+7048, seem to indicate that these are “relaxed” systems (as indicated by the regular symmetric contours).
To check this an law was fitted to the galaxy profiles (figure 4). The profile of B1946+7048 is well fitted by an law, with an effective radius of , but the profile of B0830+5813 clearly flattens in the inner 10 pixels. In this case an law was fitted to the outer part of the profile (). This indicates that about half of the expected light is missing in the centre of the galaxy, possibly due to the presence of dust. Unfortunately the band data on this galaxy is of too poor a quality to measure the colour gradient along the profile. Assuming that the light profile without dust followed the law, then an estimate of the dust mass can be made. Following van Dokkum and Franx (1995), the dust mass corresponds to
| (6) |
where is the area covered by the dust, is the average extinction in this area, and mag kpc2 visual mass absorption coefficient. The average extinction is estimated to be 0.8 mag within the radius . The redshift of the galaxy is z=0.093 (Snellen 1997, Snellen et al. in prep), hence this corresponds to an area of 30 kpc2 ( km/sec/Mpc, ). This gives a dust mass estimate of . This is comparable to dust-masses estimated in 3C galaxies (de Koff et al., 1998).
The exposure times on B1622+6630 and B1819+6707 were not long enough to construct reliable profiles such as for B0830+5813 and B1946+7048, but there are indications from the noisy profiles that they are also relaxed, although a nuclear point source might well be present in B1622+6630.
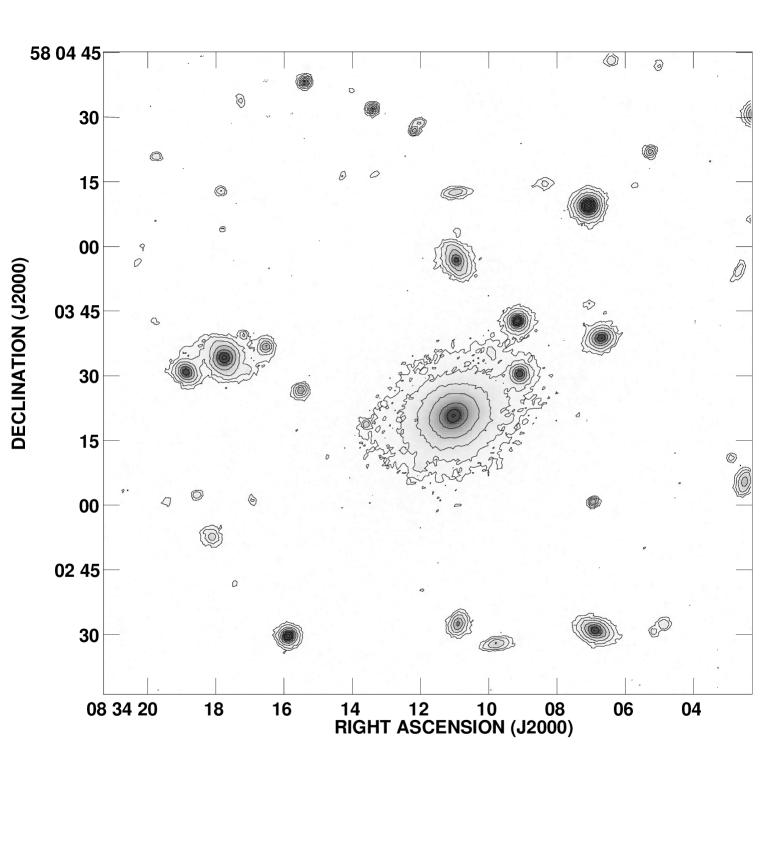
Of the four brightest galaxies, two seem to have close neighbours but none of them show evidence for an ongoing galaxy interaction. There are two objects located at a distance of from the core of B0830+5813, clearly within the envelope of the galaxy. Although these objects may well not be associated physically with the main galaxy and the result of a projection effect. B0830+5813 seems to be located in a cluster environment (fig. 5). There are 13 galaxies on the CCD image with magnitudes between the magnitude of the third brightest galaxy and 2 magnitudes fainter. This corresponds to an Abell richness class (Abell, 1958) of , assuming a modified Hubble profile (Sarazin, 1986) for the projected surface density of galaxies with a core radius of 500 Kpc. The galaxies B1622+6630 and B1819+6707 seem to have close neighbours at a distance of respectively 2.0′′ and 1.5′′, but B1946+7048 has no neighbouring galaxies.
4.3 The Optical Identifications and their Radio Spectra

If the orientation unification scheme for extragalactic radio sources is correct, then it is expected that the redshift distributions of radio galaxies and quasars are more or less the same. If differences occur then these must be due to luminosity effects, for example, a change of quasar opening angle with radio power (eg. Urry and Padovani, 1995). The observed redshift distributions in radio-bright samples of GPS sources identified with galaxies and quasars are found to be very different, with the GPS quasars located at high redshifts (, O’Dea et al, 1991). However, two selection effects influence this result. Firstly, the GPS galaxies are biased towards low redshift because spectroscopy is easier on low redshift galaxies. Secondly, the GPS quasars may be biased towards high redshift because their intrinsic peak frequencies seem to be higher (eg. de Vries et al 1997, Stanghellini et al 1996). If that is true, low redshift GPS quasars may fall outside the bright samples because their observed peak frequencies are too high. We have found evidence that the redshift distribution of GPS galaxies in the faint sample is indeed different from that of the GPS quasars (Snellen 1997). The faint sample is more suitable for this, because sources are selected on the optically thick part of their radio spectrum, and moving sources within the sample to lower redshift, thereby shifting the observed peak frequency to lower frequencies, will not make them disappear from the sample. The difference in redshift distributions is unlikely to be caused by a radio power effect, because it occurs both in the faint and bright samples. This seems to indicate that GPS galaxies and quasars are not unified by orientation and form two different classes of objects which happen to have the same radio spectral properties.
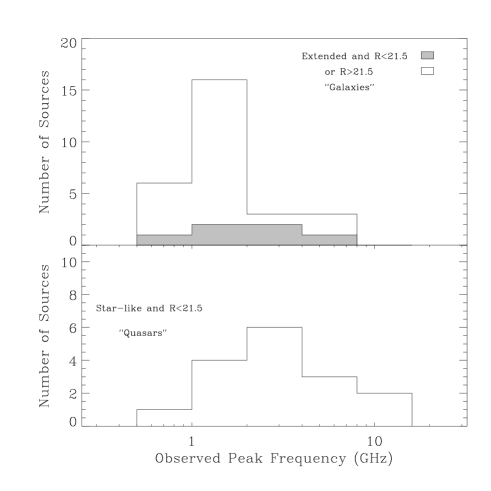
As mentioned above, it has been found (Stanghellini et al., 1996, de Vries etal. 1997) that the intrinsic peak frequency distributions of GPS quasars and galaxies are different. However, the selection bias discussed above may be responsible for this. We conclude that it would be better to compare the observed peak frequency distributions of the galaxies and quasars. Although radio selection effects are severe in the observed frame, they are independent of optical host. If all optical counterparts of the faint GPS sources that are classified as “extended” or “faint” can be assumed to be galaxies, and all unresolved star-like identifications quasars, figure 6 shows that there is a clear difference in the peak frequency distribution for these two groups. The hypothesis that the distributions of the quasars and galaxies are drawn from the same parent distribution can be rejected at confidence level using the Kolmogorov-Smirnov test.
De Vries et al. (1997) have found an apparent absence of sources at high redshift with low peak frequencies, which they interpreted as a correlation between redshift or radio luminosity with peak frequency. We believe this is not a dependence of redshift, but a dependence on optical host because the quasars tend to be at higher redshift than the galaxies. To check this we investigated whether the observed peak frequency is a function of redshift for the GPS galaxies only. The redshifts are not known for the majority of the GPS galaxies, but the band magnitude of GPS galaxies is a good indicator of the redshift, at least for the radio bright samples (Snellen et al. 1996a). Plotting the band magnitude of the ‘candidate’ galaxies versus their radio peak frequency however, shows no correlation between these two quantities (fig. 7).
5 Conclusions
A sample of 47 faint GPS sources selected from the Westerbork Northern Sky Survey has been imaged in the optical and near-infrared, resulting in an identification fraction of 87% with a reliability of 97.6% and a completeness of . The optical to near infrared colours of the faint and the extended optical identifications are found to be in agreement with passively evolving elliptical models, assuming that their redshifts can be determined from the band Hubble diagram as defined for radio bright GPS galaxies (Snellen et al. 1996a), and taking into account the large uncertainty in the Hubble diagram at high redshift.
The GPS sources optically identified with bright stellar objects, presumably quasars, have in the observed frame, on average, higher radio peak frequencies than the GPS sources identified with faint and extended objects, presumably galaxies. This indicates that there is a difference between the true peak frequency distributions of GPS galaxies and quasars, because selection effects are the same for both type of optical counterparts. Such a difference in intrinsic peak frequency distribution may cause a selection bias, resulting in a different redshift distribution for GPS galaxies and quasars. However, it has been shown by this faint sample (Snellen 1997) that this is not the case, and that both the redshift distribution and intrinsic peak frequency distribution for GPS galaxies and quasars are different.
This seems to indicate that GPS galaxies and quasars are not unified by orientation and form two different classes of objects which happen to have the same radio spectral properties.
acknowledgements
We thank the Comite Cientifico International (CCI) of the IAC for the allocation of observing time. The Jacobus Kapteyn Telescope, the Isaac Newton Telescope, and the William Herschel Telescope are operated on the island of La Palma by the Isaac Newton Group in the Spanish Observatorio del Roque de los Muchachos of the Instituto de Astrofisica de Canarias. We thank Daniela Villani and Sperello di Serego Alighieri for providing unpublished data. The NASA/IPAC Extragalactic Database (NED) is operated by the Jet Propulsion Laboratory, California Institute of Technology, under contract with the National Aeronautics and Space Administration. This work was in parts funded through a NWO programme subsidy and by the European Commission under contracts SCI*-CT91-0718 (The Most Distant Galaxies) and ERBFMRX-CT96-086 (Formation and Evolution of Galaxies), and ERBFMRX-CT96-0034 (CERES). RGM thanks the Royal Society for support.
References
- [1] Abell G.O., 1958, Astrophys. J. Suppl.,3, 211
- [2] Baker J.C., and Hunstead R.W., 1995, Astrophys. J., L95
- [3] Barthel P.D., 1989, Astrophys. J., 336, 606
- [4] Burnstein D., and Heiles C.,1984, Astrophys. J. Suppl., 54, 33
- [5] van Dokkum P.G., and Franx M., 1995, Astron. J., 110, 2027
- [6] Fanti C., Fanti R., Dallacasa D., Schilizzi R.T., Spencer R.E., Stanghellini C., 1995, Astr. & Astrophys., 302, 317
- [7] Irwin M., Maddox S., McMahon R., 1994, in Spectrum, newsletter of the Royal Observatories, 2, p14
- [8] de Koff S., Baum S., Sparks W., Best P., Rottgering H., Miley G.K., Golombek D., Macchetto F., Martel A., 1998, in preparation
- [9] Landolt A.J., 1983, Astron. J., 88, 439
- [10] Matura D., Gonzalez R., Heathcote S., Schommer B., 1993, NOAO newsletter, 34
- [11] O’Dea C.P., Baum S.A. and Morris G.B., 1990, Astr. Astrophys., 82, 261
- [12] O’Dea C.P., Baum S.A., Stanghellini C., 1991, Astrophys. J., 380, 66
- [13] O’Dea C.P., Stanghellini C., Baum S.A., Charlot S., 1996, Astrophys. J., 470, 806
- [14] O’Dea C.P., Baum S.A., 1997, Astron. J., 113, 148
- [15] O’Dea C.P., 1998, P.A.S.P., 747, 493
- [16] Readhead A.C.S., Taylor G.B., Xu W., Pearson T.J., Wilkinson P.N., Polatidis A.G., 1996, Astrophys. J., 460, 612
- [17] Rengelink R.B., Tang Y., de Bruyn A.G., Miley G.K., Bremer M.N., Röttgering H.J.A., Bremer M.A.R., 1997, Astr. & Astrophys. Suppl., 124, 259
- [18] de Ruiter H.R., Arp H.C., Willis A.G., 1977 Astr. & Astrophys. Suppl., 28, 211
- [19] Röttgering H.J.A, Miley G.K., Chambers K.C., Macchetto F., 1995, Astr. and Astrophys. Suppl., 114, 51
- [20] Russell J.L, Lasker B.M., McClean B.J.,Sturch C.R., Jenkner H., 1990, Astron. J., 99, 2059
- [21] Sarazin C.L., 1986, Rev. Mod. Phys., 58, 1
- [22] Snellen I.A.G., Zhang M., Schilizzi R.T., Röttgering H.J.A., de Bruyn A.G. and Miley G.K., 1995, Astronomy and Astrophysics, 300, 359
- [23] Snellen I.A.G., Bremer M.N., Schilizzi R.T., Miley G.K., van Ojik R., 1996a, Mon. Not. R. Astr. Soc., 279, 1294
- [24] Snellen I.A.G., Bremer M.N., Schilizzi R.T., Miley G.K., 1996b, Mon. Not. R. Astr. Soc., 283, 123
- [25] Snellen I.A.G., PhD thesis 1997, Leiden Observatory
- [26] Snellen I.A.G., Schilizzi R.T., de Bruyn A.G., Miley G.K., Rengelink R.B., Röttgering H.J.A., Bremer, M.N., 1998, Astr. & Astrophys. Suppl., in press
- [27] Stanghellini C., O’Dea C.P., Baum S.A., Laurikanen E., 1993, Astrophys. J. Suppl., 88,1
- [28] Stanghellini C., Dallacasa D., O’Dea C.P., Baum S.A., Fanti R., Fanti C., 1996, in proc of 2nd workshop on GPS&CSS Radio Sources, eds. I. Snellen, R.T. Schilizzi, H.J.A. Röttgering and M.N. Bremer, p. 4
- [29] Stanghellini C., O’Dea, C. P., Dallacasa, D., Baum, S.A., Fanti, R., Fanti, C., 1998, Astron. & Astrophys. Suppl., in press
- [30] Stone R.P.S., 1977, Astrophys. J., 218, 767
- [31] Urry C.M., Padovani, P., 1995, P.A.S.P, 107, 803
- [32] Villani D. and di Serego Alighieri S., 1998, Astron. & Astrophys., submitted
- [33] De Vries W.H., Barthel P.D., Hes R., 1995, Astron. and Astrophys. Suppl., 114, 259
- [34] De Vries W.H., Barthel P.D., O’Dea C.P., 1997, Astron. and Astrophys., 321, 105
Appendix A
Comments on individual sources
B0400+6042 No optical identification has been found to a limiting magnitude of and .
B0436+6152 No optical identification has been found to a limiting magnitude of and .
B0441+5757 A very bright star is located only away to the north-west. There may be a second object to the south east very close to the identification.
B0539+6200 An optical identification is found in band, just at the detection limit. However, the object is clearly detected in band.
B0552+6017 No optical identification has been found to a limiting magnitude of .
B0759+6557 This object has faint detections in both and band.
B0826+7045 Two possible identifications are found at 0.8 and 1.2 arseconds distance from the radio position.
B1600+7131 No optical identification has been found to a limiting magnitude of and .
B1620+6406 A very bright star is located only 2 arcminutes to the south west.
B1622+6630 Two objects are found within an angular distance of 2′′. The may be neighbouring galaxies.
B1639+6711 No optical identification has been found to a limiting magnitude of and .
B1647+6225 Two objects are found within 3.5 arseconds from the radio position. The fainest one is probably the real identification.
B1655+6446 No optical identification has been found to a limiting magnitude of and .
B1807+5959 A possible identification is found at a magnitude level.
B1807+6742 No optical identification has been found to a limiting magnitude of and .
B1819+6707 Two objects are found within an angular distance of 1.5′′. The may be neighbouring galaxies.
B1843+6305 This source has no identification to but is clearly detected in band.
B1942+7214 The optical identification is very faint in but is clearly visible in and band.
B1954+6146 The optical identification is a Red point source, with very faint extended emission in band.
B1958+6158 Two objects are found within 2.0 arseconds from the radio position.
| Source | Optical Position (J2000) | RA | Decl | r | ID | Ap. | ||||||||||
|---|---|---|---|---|---|---|---|---|---|---|---|---|---|---|---|---|
| R.A. | Decl. | off. | off. | |||||||||||||
| h | m | s | ′ | ′′ | ′′ | ′′ | ′′ | mag. | mag. | mag. | mag. | |||||
| (1) | (2) | (3) | (4) | (5) | (6) | (7) | (8) | (9) | (10) | (11) | (12) | |||||
| B0400+6042 | - | 3.0 | ||||||||||||||
| B0436+6152 | - | 2.45 | 3.0 | |||||||||||||
| B0441+5757 | 04 | 46 | 8.82 | 58 | 02 | 48.92 | +0.6 | +1.0 | 1.7 | S | 5.3 | |||||
| B0513+7129 | 05 | 19 | 29.01 | 71 | 33 | 2.84 | +0.3 | 1.1 | 1.6 | S | 0.49 | 5.3 | ||||
| B0531+6121 | 05 | 36 | 30.88 | 61 | 23 | 22.31 | +0.6 | 1.2 | 2.0 | E | 0.99 | 7.0 | ||||
| B0535+6743 | 05 | 41 | 13.43 | 67 | 45 | 22.36 | +0.0 | 1.0 | 1.4 | F | 0.39 | 5.3 | ||||
| B0537+6444 | 05 | 42 | 10.02 | 64 | 46 | 31.99 | 0.2 | 0.3 | 0.5 | S | 0.55 | 5.3 | ||||
| B0538+7131 | 05 | 44 | 31.37 | 71 | 32 | 40.60 | 0.5 | 0.8 | 1.3 | S | 0.41 | 4.2 | ||||
| B0539+6200 | 05 | 44 | 33.57 | 62 | 01 | 17.86 | 0.1 | 1.9 | 2.7 | F | 0.73 | 5.3 | ||||
| B0543+6523 | 05 | 48 | 39.79 | 65 | 24 | 24.43 | +0.3 | 0.7 | 1.1 | S | 0.58 | 5.3 | ||||
| B0544+5847 | 05 | 48 | 27.01 | 58 | 47 | 55.51 | +0.2 | 0.4 | 0.6 | S | 1.02 | 5.3 | ||||
| B0552+6017 | - | 0.57 | 3.0 | |||||||||||||
| B0557+5717 | 06 | 01 | 49.46 | 57 | 17 | 20.82 | 0.4 | 0.3 | 0.7 | F | 0.97 | 4.2 | ||||
| B0601+5753 | 06 | 05 | 42.29 | 57 | 53 | 14.87 | +0.3 | 1.5 | 2.2 | S | 0.59 | 5.3 | ||||
| B0748+6343 | 07 | 53 | 0.76 | 63 | 35 | 45.61 | +0.7 | 0.5 | 1.2 | S | 0.12 | 5.3 | ||||
| B0752+6355 | 07 | 56 | 54.66 | 63 | 47 | 58.71 | +0.1 | 0.2 | 0.3 | F | 0.11 | 3.5 | ||||
| B0755+6354 | 07 | 59 | 52.86 | 63 | 46 | 13.03 | 0.1 | 0.3 | 0.5 | S | 0.11 | 4.2 | ||||
| B0756+6647 | 08 | 01 | 36.51 | 66 | 39 | 9.04 | +0.7 | 0.7 | 1.4 | S | 0.12 | 5.3 | ||||
| B0758+5929 | 08 | 02 | 24.59 | 59 | 21 | 34.00 | 0.1 | 0.6 | 0.9 | S | 0.18 | 5.3 | ||||
| B0759+6557 | 08 | 03 | 55.52 | 65 | 49 | 18.46 | +0.3 | 0.4 | 0.7 | F | 0.18 | 3.5 | ||||
| B0826+7045 | 08 | 31 | 57.51 | 70 | 35 | 35.96 | 1.2 | 0.1 | 1.7 | S | 0.08 | 4.2 | ||||
| 08 | 31 | 57.91 | 70 | 35 | 35.84 | +0.8 | 0.2 | 1.3 | S | 0.08 | 2.1 | |||||
| B0830+5813 | 08 | 34 | 11.03 | 58 | 03 | 20.75 | 0.6 | 0.3 | 1.0 | E | 0.21 | 21.1 | ||||
| B1525+6801 | 15 | 25 | 45.95 | 67 | 51 | 24.39 | 0.2 | +0.9 | 1.3 | F | 0.05 | 4.7 | ||||
| B1538+5920 | 15 | 39 | 29.45 | 59 | 11 | 0.45 | +0.2 | 0.0 | 0.3 | S | 0.04 | 4.8 | ||||
| B1550+5815 | 15 | 51 | 58.13 | 58 | 06 | 44.92 | +0.2 | +0.6 | 0.9 | S | - | 5.3 | ||||
| B1551+6822 | 15 | 52 | 4.22 | 68 | 13 | 46.81 | 0.9 | 0.7 | 1.6 | F | 0.05 | 3.6 | ||||
| B1557+6220 | 15 | 57 | 52.73 | 62 | 11 | 37.27 | 0.5 | +0.4 | 0.9 | F | 0.00 | 4.8 | ||||
| B1600+7131 | - | 0.08 | 3.0 | |||||||||||||
| B1620+6406 | 16 | 21 | 15.27 | 63 | 59 | 13.63 | +0.1 | +0.6 | 0.9 | F | 0.03 | 3.3 | ||||
| B1622+6630 | 16 | 23 | 4.51 | 66 | 24 | 0.99 | +0.5 | +0.2 | 0.8 | E | 0.07 | 7.7 | ||||
| B1639+6711 | - | 0.12 | 3.0 | |||||||||||||
| B1642+6701 | 16 | 42 | 21.75 | 66 | 55 | 48.89 | 0.6 | 0.5 | 1.1 | S | 0.09 | 4.4 | ||||
| B1647+6225 | 16 | 48 | 3.85 | 62 | 20 | 36.36 | +2.2 | 2.8 | 5.1 | S | 0.03 | 3.9 | ||||
| 16 | 48 | 3.56 | 62 | 20 | 39.44 | +0.1 | +0.3 | 0.5 | F | 0.03 | 3.3 | |||||
| B1655+6446 | - | 0.05 | 3.0 | |||||||||||||
| B1657+5826 | 16 | 58 | 5.05 | 58 | 22 | 2.19 | +0.1 | 0.1 | 0.2 | F | 0.00 | 3.3 | ||||
| B1746+6921 | 17 | 46 | 30.04 | 69 | 20 | 35.74 | +0.6 | +0.4 | 1.0 | S | 0.14 | 3.9 | ||||
| B1807+5959 | 18 | 07 | 55.41 | 59 | 59 | 59.85 | 0.2 | +0.1 | 0.3 | F | 0.14 | 3.6 | ||||
| B1807+6742 | 18 | 07 | 14.17 | 67 | 42 | 52.84 | 0.4 | 1.4 | 2.1 | - | 0.19 | 3.0 | ||||
| B1808+6813 | 18 | 08 | 12.25 | 68 | 14 | 12.08 | +1.9 | 0.3 | 2.7 | F | 0.19 | 3.3 | ||||
| B1819+6707 | 18 | 19 | 44.38 | 67 | 08 | 47.02 | +0.5 | 0.2 | 0.8 | E | 0.18 | 6.6 | ||||
| B1841+6715 | 18 | 41 | 3.86 | 67 | 18 | 50.05 | +0.1 | +0.1 | 0.2 | E | 0.30 | 4.4 | ||||
| B1843+6305 | 18 | 43 | 30.50 | 63 | 08 | 50.80 | +0.6 | 0.2 | 0.9 | - | 0.28 | 3.6 | ||||
| B1942+7214 | 19 | 41 | 27.04 | 72 | 21 | 41.88 | +0.8 | 0.5 | 1.3 | F | 0.48 | 3.3 | ||||
| B1945+6024 | 19 | 46 | 12.95 | 60 | 31 | 39.97 | 0.2 | +0.9 | 1.3 | S | 0.33 | 3.3 | ||||
| B1946+7048 | 19 | 45 | 53.32 | 70 | 55 | 48.86 | 0.4 | 0.2 | 0.6 | E | 0.53 | 24.0 | ||||
| B1954+6146 | 19 | 54 | 55.87 | 61 | 53 | 59.39 | 0.1 | +0.9 | 1.3 | S | 0.37 | 3.3 | ||||
| B1958+6158 | 19 | 59 | 30.30 | 62 | 06 | 43.19 | +1.9 | 0.8 | 2.9 | S | 0.40 | 3.3 | ||||
| 19 | 59 | 30.02 | 62 | 06 | 44.96 | 0.1 | +0.0 | 0.1 | F | 0.40 | 3.0 | |||||