Caltech Faint Galaxy Redshift Survey VIII: Analysis for the Field J0053+123411affiliation: Based in large part on observations obtained at the W.M. Keck Observatory, which is operated jointly by the California Institute of Technology and the University of California
Abstract
The results of a spectroscopic investigation of a complete sample of objects with mag in a 2 by 7.3 arcmin field at J005325+1234 are reported. Redshifts were successfully obtained for 163 of the 195 objects in the sample; these redshifts lie in the range [0.173, 1.44] and have a median of 0.58 (excluding 24 Galactic stars). The redshift identifications are believed to be almost complete for . Approximately half of the galaxies lie in five narrow redshift features with local velocity dispersions of km s-1. These narrow redshift “peaks” are primarily populated both by absorption–line galaxies and the most luminous galaxies in the sample, although the incidence of emission lines in the luminous galaxies increases with redshift. The estimated dynamical masses of these redshift peaks, and the sky distribution of the galaxies within them, appear similar to groups or poor clusters of galaxies in the local universe at various stages of virialization. Some groups of galaxies therefore form at epochs , and the galaxies in such groups appear to be coeval and to show little sign of ongoing star formation. The galaxies outside the redshift peaks are also clustered, albeit more weakly, are less luminous and more frequently exhibit strong emission lines. These “isolated” galaxies therefore appear, on average, to form stars at later epochs than the strongly clustered galaxies. The galaxy SEDs derived from our photometry are also very closely correlated with the galaxy spectral types and luminosities. These results have strong implications for the analysis of redshift surveys at intermediate redshift.
The sample is used to investigate the evolution of the combined galaxy luminosity function back to . No significant change is found in the characteristic luminosity and only weak color changes are detected, consistent with passive evolution. The blue galaxy luminosity function is more dwarf-rich than the red galaxy luminosity function. No significant change in the comoving density is found in this sample out to assuming that the objects without redshifts (16% of the sample) are galaxies essentially all of which have . This suggests that mergers are not important among the objects in this sample.
A population of extremely red objects with mag exists in the infrared-selected sample; all four such objects with redshifts are found to be absorption line galaxies with . Most of the very red objects therefore appear to be galaxies with which are not heavily reddened by dust.
A measure of the UV extinction at 2400Å for the emission line galaxies of a factor of two is obtained, implying only modest UV extinction in high redshift star-forming galaxies.
1 Introduction
We observe that galaxies evolve. The number of very faint (and, presumably, distant) galaxies on the sky is at least (Williams et al. (1996)), roughly thirty times more than would be naively predicted on the basis of the comoving volume of the Universe and the local bright-galaxy luminosity function (Loveday et al. (1992); Marzke, Huchra, & Geller (1994); Lin et al. 1996a ; Gardner et al. (1997); Hogg et al. (1997); Ratcliffe et al. (1998)). In addition, faint galaxies are bluer (Koo & Kron (1992); Smail et al. (1995)), smaller (Smail et al. (1995); Griffiths et al. 1994b ), and more irregular (Griffiths et al. 1994a,b; Glazebrook et al. (1995); Driver, Windhorst, & Griffiths (1995); Abraham et al. (1996); Odewahn et al. (1996)) than bright galaxies at the present day.
In order to translate these observations into a description of the physical evolution of the whole galaxy population with cosmic time, it is necessary to understand the galaxy redshift distribution. For this reason much telescope time has been devoted to large redshift surveys which allow us to measure the luminosities and ages of statistical samples of galaxies. In addition, they also explore, directly, the variation of the star formation rate, the chemical abundance, and non-thermal activity with cosmic time, which are strong markers of the evolutionary history of galaxies. Furthermore, these surveys can be used, globally, to study the clustering and spatial distribution of faint galaxies.
The Caltech Faint Galaxy Redshift Survey, (henceforth CFGRS), is designed to measure the properties of field galaxies in the redshift interval . The survey is described in Cohen et al (1998), where it is contrasted with the many other recent redshift surveys of field galaxies. The CFGRS uses complete samples to a fixed limiting magnitude in a particular bandpass within a small solid angle on the sky. Spectra are obtained for every object in the sample with the Low Resolution Imaging Spectrograph (henceforth LRIS) (Oke et al. 1995) on the 10 m Keck Telescope.
This paper presents spectroscopic results from one field located at J005325+1234, the central region of which is part of the Medium Deep Survey (Griffiths et al. 1994a ) and among the deepest fields imaged with HST prior to the Hubble Deep Field. The field measures arcmin2 with a statistical sample containing 195 infrared-selected objects complete to mag, of which 24 are spectroscopically confirmed Galactic stars and 32 cannot be assigned spectroscopic redshifts. (21 of these have spectra). A preliminary report on the field J0053+1234 was given by Cohen et al. (1996a) where it was shown that roughly half of the galaxies are located in dense groups. The sample definition and photometric catalog are presented in a companion paper (Pahre et al. (1998)), while the redshifts are given in a second companion paper, Cohen et al. (1998). The properties of the Galactic stars are discussed in Reid et al. (1997). Large scale structure will be discussed, in the context of this survey, in a forthcoming paper (Cohen et al. 1999b ). A redshift survey of another region, the Hubble Deep Field (Williams et al. (1996), henceforth the HDF), will be the subject of the next paper in this series (Cohen et al. 1999a ).
This paper is structured as follows. The galaxy luminosities and colors in the observed frame are discussed the §2. The extremely red galaxies in our sample are discussed in §2.3. Then the galaxy spectral energy distributions (SEDs) are constructed in the rest frame and it is shown that these are strongly correlated with the galaxy spectral classes in §3. On this basis, redshifts are provisionally assigned for the 32 galaxies in our complete sample whose spectra lack adequate line features. After using our SEDs to deduce the ultraviolet extinction for strong emission line galaxies with in §3.4, we then discuss the overall distribution of galaxies in redshift and comoving volume. Next, we distinguish the clustering of the different spectral classes in §4.2 and demonstrate that the prominent groups contain apparently older galaxies. The limited morphological information that we have on our sample is presented along with some predictions in §6. Finally, our conclusions are collected and discussed in §7 along with some suggestions for future research.
We adopt the values km s-1 Mpc-1and with throughout. The present age of the universe in this cosmology is 13 Gyr and the current cosmological density is g cm-3.
2 Galaxy Properties in the Observed Frame
2.1 Hubble Diagrams
The conventional way to represent the results of redshift surveys is with a Hubble diagram. Three Hubble diagrams, , and are presented as Figures 1a,b,c for the redshift sample. The four different galaxy spectral classes defined in Cohen et al. (1998) (“” for emission line dominated galaxies, “” for galaxies showing only absorption features, “” for galaxies with composite spectra and “” for AGNs) are distinguished on these diagrams. (A few galaxies were not detected at and these are ignored in Figure 1a.) We also exhibit the magnitudes of the 32 objects from the galaxy sample that do not have redshifts when these are detected. As is usual, we ignore reddening internal to the galaxies themselves and from the IGM.
As the rest wavelengths are blueshifted with respect to our six bandpasses, it is also conventional to correct the magnitudes for this effect using k-corrections. These have been tabulated by Poggianti (1997) who conveniently separates this purely spectral effect from the change due to the evolution of the stars that we observe locally. Together, these two effects are called “passive” evolution. (We have corrected for our different filters and cosmology.) The spectral evolution predicted by Poggianti for a galaxy with with no evolution is also exhibited on the Hubble diagrams for local galaxies with SEDs of an elliptical, Sa, and Sc type.111The SED for the local elliptical is from Bruzual & Charlot (1993). The passive evolution predictions from Poggianti (1997) are also shown in Figure 1a,b,c, again for a galaxy. 222The k-correction assigned to an elliptical galaxy as computed from the Worthey (1994) and Bruzual & Charlot (1996) models (as provided in Leitherer et al. (1996)) show good agreement with each other, and with the Bruzual & Charlot (1993) model described above. They also show good agreement with the “empirical” approach to estimating –corrections by Cowie et al. (1994), which was based on broad-band photometry of nearby elliptical galaxies. These –corrections differ substantially by mag from the Poggianti (1997) models at for the filter, suggesting that the latter models are problematical at near–infrared wavelengths.
An enormous range in galaxy luminosities is apparent in Figure 1. For intermediate redshift galaxies observed in the band, there is a five magnitude spread in luminosities. The second notable feature of this diagram is the concentration of roughly half of the galaxies, predominantly “” galaxies, in redshift clumps. A third peculiarity is the dearth of galaxies, especially “” galaxies, for and . Fourthly, we note that Poggianti’s (1997) passive evolution tracks do not appear to represent the observed run of galaxies, particularly at and . Including the evolutionary correction term for passive evolution leads to luminosities that decrease as increases, while use of just the k-correction term (i.e. no evolution) is in fact better.
It has long been argued that elliptical galaxies in clusters of galaxies show only passive evolution, at least out to (Aragón–Salamanca et al. (1993); Kelson et al. (1997); Pahre (1998); Postman, Lubin & Oke (1998)). Evolutionary brightening of disk galaxies in the field is also quite modest as measured using surface photometry (Schade et al. (1996); Barger et al. 1998a ) or the Tully-Fisher relation (Vogt et al. 1996, 1997), reaching only mag in the –band at . More recently Hogg (1998) in an analysis of the HDF has shown that there evolution of is at most modest out to . Hamilton (1985) has demonstrated that the amplitude of the 4000Å— jump is approximately constant for bright field elliptical galaxies out to .
2.2 Galaxy Colors
A conventional view of galaxy colors is given in Figures 2a,b,c, which show the dereddened galaxy colors , and for the full sample as a function of redshift. Galaxies without a detection at are not plotted. The same symbols are used to indicate the galaxy spectral types as appear in figure 1. The thin and thick lines represent the predictions of the Poggianti (1997) models for no-evolution and for passive evolution respectively. For galaxy colors, only differences of the values of the evolutionary corrections computed in each of two colors for the passive evolution models of Poggianti (1997) are relevant, while in comparing galaxy luminosities with predictions from models, the values themselves are at issue. Thus the effects of any errors in the evolutionary corrections in Figures 2a,b,c are more subtle than those seen in the Hubble diagrams (Figure 1a, b, c).
Figure 2 shows overall agreement with the color predictions from no-evolution models, as has been noted earlier by, for example, Oke, Gunn, & Hoessel (1996) for galaxies in clusters with and in the CFRS (Crampton et al. (1995)), but still many minor concerns persist. In each panel of this figure, the range of the observed galaxy colors (equivalent to the range of galaxy SEDs, i.e., the range of star formation histories considered valid for galaxies) is somewhat larger at all redshifts than the range predicted by the models.
The evolutionary corrections are better studied by a more carefully defined sample of galaxies in clusters where the galaxy spectral type can be more tightly constrained. Such an approach has been taken by Pahre (1998).
2.3 The Very Red Objects
At high galactic latitude there is a population of faint, very red objects. Among the main sample (Pahre et al. (1998)) there are 19 objects with mag—three of which have mag—producing a surface density on the sky of 1.3 arcmin-2. Ignoring Galactic stars, this class of objects comprises 11% of the number counts for mag.
The spectroscopically confirmed stars in the total sample all have mag, and are mostly M dwarfs. While the reddest galactic M dwarfs reach mag (Leggett (1992)), such extremely red stars are not common in magnitude limited samples.
Lawrence et al. (1995), among others, advocate that a significant fraction of galaxies at high redshift are dusty. However we do not find significant UV extinction among the emission line galaxies in our sample (§3.4), and hence do not believe that the many of the very red objects in our sample without measured redshifts are heavily reddened blue galaxies.
Four of the 19 very red objects have measured redshifts. All four of them are classified as “”, with ; three of the four have . Persson et al. (1993) have speculated that such objects are passively-evolved elliptical galaxies with , while Graham & Dey (1996) suggest that they are reddened star forming galaxies. The very red objects for which we were successful in measuring a redshift support the hypothesis that such objects are high redshift elliptical galaxies, specifically that they are galaxies with that are not heavily reddened by dust.
3 Spectral Energy Distributions
3.1 Computation of the Rest Frame Spectral Energy Distributions
For each galaxy in our redshift sample, we can construct a rest frame spectral energy distribution (SED). We do this in a slightly non-standard way. For each galaxy, we compute the luminosity per , , as a function of rest frequency using the six photometric magnitudes of Pahre et al. (1998). The calibrations for absolute flux were adopted from Bessell (1979) for through , and were calculated from the material in Pahre et al. (1998) for and for . A selection of raw SEDs is displayed in Figure 3. In constructing raw SEDs, we interpolate linearly between measurements. The nominal error on each measured point is dominated by systematic effects. We estimate this to be in magnitude or in . For a variety of reasons discussed in Pahre et al. (1998), many photometric measurements have much larger errors and these are shown as vertical bars. In addition, several photometric measurements are only upper limits and these are also designated in Figure 3.
We next transform these raw SEDs into corrected SEDs by interpolation and extrapolation through the inaccurate measurements and upper limits and extension redward to 2.2 using the observed colors. (We believe this procedure to be quite robust because the near infrared spectra of most galaxies are well represented as power laws.) We also introduce two new spectral bands, and at rest frequencies in the vacuum ultraviolet which are directly observed in most cases. (We extrapolate to these frequencies in the lowest redshift galaxies.) This operation leaves us with continuum spectra and a set of 8 rest spectral luminosities , where . (The biggest concern about this procedure is the large gap in between and . This can introduce a systematic steepening of the derived infrared rest spectra for high redshift galaxies as the observed band corresponds to rest where the rest SED can be intrinsically curved. However, none of our results is strongly dependent upon this extrapolation.)
These SEDs are listed in Table 1 and are exhibited for a selection of galaxies in the redshift sample in Figure 4. There are some striking (though not unexpected) regularities. The absorption line galaxy SEDs exhibit quite red infrared and ultraviolet spectra. For convenience we define two spectral indices in the rest frame. is the spectral index, , measured between the rest and bands and is the corresponding quantity between the and bands. (Again our results are quite robust to this choice, which maximizes the tightness of the correlations which follow.) If we restrict our attention to “” galaxies with high quality redshifts as defined in Cohen et al. (1998) and with , then nearly all the galaxies are located in the region defined by and almost all of “” galaxies with high quality redshifts lie outside this region (Figure 5). (The association of a hard ultraviolet continuum with emission lines is not, of course, a surprise. However, this correlation does demonstrate that internal reddening to be discussed in §3.4 is not a big factor in these galaxies.) We can then use this correlation to define two SED classes for the whole redshift sample, including the “” spectral class, which cover the whole two-color plane, and those of low quality (mostly “” class). We call these classes “old” () and “young”, although the latter may also be rejuvenated, consisting of an older population plus a recent starburst.
The correlation of with is shown in Figure 6 for the same set of galaxies with high quality redshifts that are displayed in Figure 5. A strong correlation between and is apparent; the most luminous galaxies have redder spectral indices. There is also a clear separation with galaxy spectral type. More luminous galaxies tend to be of “” spectral class, while the least luminous ones are those that show strong signs of recent star formation (the “” galaxies).
The tight correlation between galaxy SED shapes (defined from 2400Å to 2.2 in the rest frame) and galaxy spectral classes assigned on the basis of the presence or absence of key diagnostic features ([OII]3727, H+K, [OIII]5007, etc) is one reason why photometric redshift techniques such as that of Connolly et al. (1995) works reasonably well at least out to for high precision photometric data sets.
3.2 Luminosity – Volume Diagram
In order to compare galaxies at different redshifts (and also with galaxies studied in other surveys), it is necessary to define a fiducial luminosity (or absolute magnitude). We again follow convention and label the galaxies by their rest luminosities. We do this in a slightly non-standard way, eschewing tabulated k-corrections and models of galaxy evolution. Instead, for each galaxy, we compute the spectral energy distribution (SED) of the luminosity per , , as a function of rest frequency and extrapolate to the rest frequency, (nominally ), from the red so as to define a rest luminosity . We do this because of the presence of variable 4000Å breaks just to the blue of the band.
We normalize the galaxy luminosity to the local, fiducial luminosity W, or mag, or (Bingelli, Sandage, & Tammann (1988)) in our cosmography. (Note that mag, (Mobasher, Sharples, & Ellis (1993)); Cowie et al. (1996) and so a median galaxy should have , somewhat bluer than our median galaxy, just as might be expected from a -selected sample.) We also estimate the total luminosity in the wavelength interval , which is probably a fair measure of the bolometric luminosity, by assuming a power law fit to the SED so that , where respectively. For most of the galaxies in our sample, .
Figure 7 shows the luminosity for each galaxy in our redshift sample as a function of both comoving volume and redshift separated by spectral class. It is immediately apparent that the luminosity function does not evolve strongly out to and that there is a serious deficit of galaxies with , an issue to which we turn next.
3.3 Galaxies without Redshifts
The sample contains 32 objects believed to be galaxies for which we cannot assign redshifts. However, we are fairly confident that these are not normal galaxies with because normal galaxies with strong emission lines in that redshift range are detected with identifiable line(s) all the way up to the survey limit. While faint absorption line galaxies in this regime are more problematic, the characteristic shape of the 4000Å break is still visible for such galaxies with , at least to mag, corresponding to mag at the survey limit. Although it is possible that we could be dealing with a new population of galaxies that exhibit neither emission nor absorption lines, similar to BL Lac objects, we regard this as quite unlikely because this population would have to be spectrally heterogeneous and to have maximum luminosity at a given redshift that evolved so as to track our survey limit. Conversely, if these galaxies are at high redshift (), they would be anomalously luminous. Their median luminosity at would be , requiring a discontinuous jump in the luminosity function. The most plausible explanation is that most of these galaxies have .
3.4 Ultraviolet Extinction
The amount of absorption in the ultraviolet suffered by the Lyman-break galaxies that are found by Steidel et al. (1996) and others is a matter of great current interest and debate. It affects the inferred luminosities of these objects as well as parameters calculated from these luminosities, such as the rate of star formation and the metallicity in the Universe as a function of cosmic time deduced by Madau, Pozzetti & Dickenson (1998). Meurer et al. (1997) and Sawicki & Yee (1998) claim a mean extinction at 1500Å for galaxies, while Trager et al. (1997) advocate a much smaller value. The results from the first searches at sub-mm wavelengths (Blain et al. (1998), Barger et al. 1998b , Eales et al. (1998)) have been used to suggest that there is a substantial population of dust enshrouded star forming galaxies at high redshift. At low redshifts () the mean UV extinction from dust at mid-UV wavelengths appears to less than a factor of 2 from analysis of H emission line strengths (Tresse & Maddox 1998), while Heckman et al. (1998) have used IUE spectra to study the UV continuum of local starburst galaxies to conclude that their average extinction is a factor of 10 in the UV for a solar metallicity galaxy, with extinction decreasing in galaxies that are more metal poor.
The closest analogs to the high- galaxies in our sample are the galaxies with strong emission lines. We attempt to use our SEDs, with their very broad wavelength coverage, to constrain the extinction within “ ”galaxies at , and then argue that dust should build up with time as star formation and metal formation proceeds, and hence any limit we obtain should apply even more rigorously at higher .
We obtain a limit on UV extinction through comparing the index of the power law fit to the UV SED () to that of the UV continuum observed for nearby starburst galaxies and that predicted by models of starburst galaxies such as those of Leitherer & Heckman (1995). Since our definition of is the power law index between rest frame and (2380Å), and there may be substantial contribution from older stars at , we use the power law index defined from our rest frame SEDs between and instead. The median index for the 10 such galaxies with high quality redshifts in our sample with strong emission lines in that redshift range is 1.3. The power law fit for extreme unreddened starbursts is (Calzetti, Kinney & Storchi-Bergmann (1994), Leitherer & Heckman (1995)) (in , while we are using ) over the regime from 1200 to 3000Å, and corresponds to a very young burst with O stars dominating the UV flux. This difference in the power law index, if attributed completely to extinction, implies a median extinction at 2380Å of a factor of 1.8. The actual value must be smaller as at least some of the flux is coming from the older stellar population in these galaxies at ; their infrared colors indicate the presence of a substantial population of stars older than O stars.
We transform the extinction at 2380Å to a value at the region of interest, 1500Å. There are a variety of extinction laws in use reviewed by Calzetti, Kinney & Storchi-Bergmann (1994) and Calzetti (1997) as the wavelength dependence of the extinction in the UV appears to depend on environment. These are essentially identical at wavelengths redder than 2400Å, but differ in “grayness” at shorter wavelengths. Thus our median extinction at 2380Å of a factor of 1.8 converts to a median extinction at 1500Å of between a factor of 2 and 3, assuming no change in the dust properties of galaxies between and . If anything, we expect the dust content to be lower at .
Because the sample of galaxies from which this value was obtained is selected at , there can be essentially no highly reddened objects with strong emission lines in this redshift range that are not included in the sample. Furthermore because the spectroscopy is reasonably complete, especially for objects with strong emission lines, there can be no additional heavily reddened starbursts in this redshift range concealed among the objects in the sample.
In conclusion, unless the dust in high redshift galaxies has unprecedented properties, we believe that searches based on flux in the rest frame UV of high redshift galaxies do not suffer substantial selection effects due to large amounts of UV extinction. We suggest the presence of modest mean UV extinctions, a factor of 3 at 1500Å. This is in good agreement with a preliminary determination by Pettini et al. (1998) using similar techniques applied to a small sample of galaxies themselves of 1 – 2 mag at 1500 Å.
3.5 Age estimation
Estimation of the ages of galaxies in the sample is important for understanding their evolution, especially since, as will be shown below, the galaxies thought to be physically associated because they lie in the same peak in the redshift distribution show evidence for having similar ages. In addition, at the highest redshifts in the sample, age determinations put constraints on the cosmological world model, or at least on the earliest epochs of galaxy formation. Recently, such constraints have been derived from a very red galaxy selected by its radio emission (Dunlop et al. (1996); Spinrad et al. (1997); Heap (1998). However, such objects may be atypical in important ways since they contain active nuclei which may affect interstellar media, stellar initial mass functions (IMFs), and SEDs. The redshift sample presented here contains a significant number of sources, not because magnitude selection is efficient for this, but merely because the sample is fairly complete. For this reason, we also expect this galaxy sample to be typical, or at least more typical than a radio-selected sample.
The standard method for age-dating a (fairly) young galaxy involves assuming that the near ultraviolet spectral energy distribution is not severely affected by extinction (see §3.4) and is dominated by stars near the main-sequence turnoff of the most recent significant burst of star formation. Because there is the possibility of earlier bursts, the age so derived is only a lower limit.
This age-dating technique can, in principle, be performed by comparing the near-ultraviolet spectral index (as defined above) of the galaxies in the sample to those of hot stars. Conversion of observed blue colors into a rest-frame near-ultraviolet spectral index (i.e., the equivalent of the k-correction) requires absolute calibrations of near-ultraviolet band-passes. These calibrations are obtained here by assuming that an average O3-6 stellar spectrum of Fanelli et al. (1992) approximates a K blackbody (Allen 1973) in the 2400–3000 Å region, a crude assumption. Under this assumption, O stars have , while F stars have and G stars have (Fanelli et al. (1992)). Even the galaxies in the sample with spectral class “” have (Figure 6), suggesting that they contain a significant number of main-sequence F stars, which appears to be consistent with the expected turnoff for a very old population seen at (Bertelli et al. 1994).
An alternative to the near-ultraviolet age dating technique is to perform a more sophisticated population synthesis based on the entire observed spectral energy distribution of each galaxy. In principle this technique ought to be more sensitive to each galaxy’s entire star formation history, and less sensitive to reddening or the details of the most recent burst of star formation activity. On the other hand, as discussed by Van Dokkum et al. (1998) it is much more model-dependent, being affected by the details of the choice of stellar initial mass function, accurate models of stellar spectra over a broad range of stellar types, and the adopted possible star formation histories. Bruzual & Charlot (1996) compute broad-band colors for single-burst populations as a function of age; they find a roughly power-law rise in (as defined above in terms of the rest-frame and fluxes) from at Gyr to at Gyr (for a Salpeter mass function, solar metallicity, and no reddening by dust). A continuous star formation model rises from to over the same time period (for the same mass function and metallicity). A significant fraction of the galaxies are somewhat redder in than either model predicts, (Figure 5). For example, the “” galaxies in Group 3, which are observed at a cosmic time Gyr, have a nominal age based upon their infrared spectral slope of Gyr, even assuming a single burst of star formation. This discrepancy between the estimated stellar ages and the age of the Universe is a matter of concern, but at the very least, it does suggest that the “” galaxies were formed in the early Universe and long before the “” galaxies.
The UV spectral index becomes bluer as increases, again in all spectral classes, but most prominently in “” galaxies. This is not unexpected because we know that there is a pronounced evolution in the OII luminosity function (Hogg et al. (1998) and references therein). However most of evolution in the OII luminosity density is due to the increase in the mean luminosity of “” galaxies with .
4 Redshift and Spatial Clustering
4.1 Groups
As discussed in Cohen et al. (1996a), and references cited therein, roughly half the galaxies in deep, pencil beam surveys out to are found in groupings with local velocity dispersions km s-1. Our re-analysis of this field essentially corroborates our earlier results. The clustering in redshift space is readily apparent in Figure 1a,b,c.
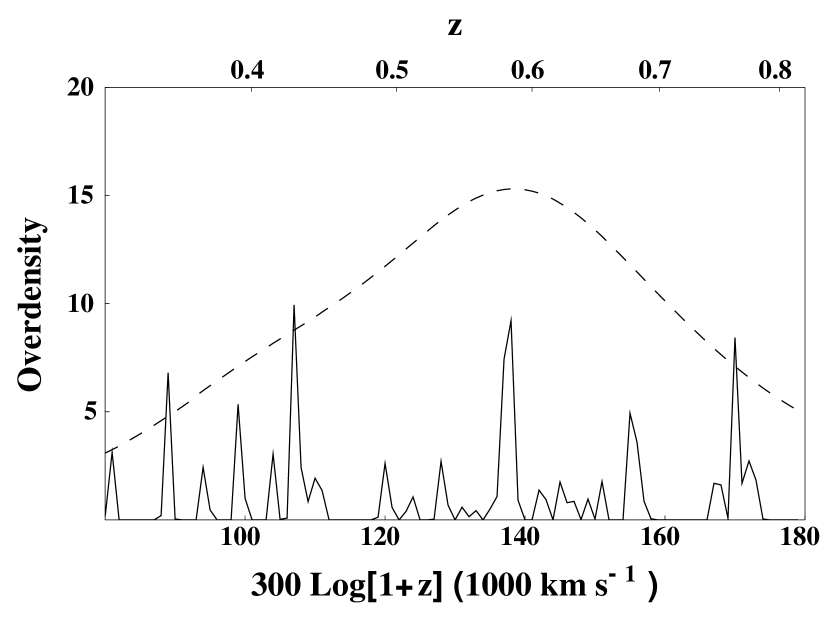
There are two complementary approaches to analyzing this distribution. The first, which we shall adopt in a forthcoming analysis of a larger sample, is to estimate the two point correlation function and its Fourier transform. Here, we confine our attention to identifying discrete groups by smoothing the distribution in local velocity space with a velocity width of 15,000 km s-1 to give the overall distribution in redshift which peaks at . We then smooth with a width of 300 km s-1 and measure the relative overdensity with respect to the overall distribution. Peak overdensities in excess of 5 are designated as groups and limited by gaps in the redshift distribution (Figure 8).
Although this procedure is somewhat subjective, it turns out to be quite instructive. We identify five distinct groups, labeled 1-5 in the interval defined by the gaps in the redshift distribution with overdensities of 5, 10, 13, 7 and 8 respectively. These are the same groups as those we found earlier and are listed in Table 2 and their angular distributions are exhibited in Figures 9. We characterize each of the groups in turn.
4.1.1 Group 1.
This group is only marginally overdense and consists of three “” galaxies with similar SEDs concentrated around a single, luminous “” red galaxy.
4.1.2 Group 2.
This group comprises five galaxies classified spectroscopically as “” and five more classified as “”, the former class exhibiting steeper UV spectra than the latter class, as expected. The luminosities range from to , which is close to the survey limit. There are no “” galaxies. This is a diffuse group with no clear center that may extend beyond our field.
4.1.3 Group 3.
In this group there are 16 galaxies that were classified spectroscopically as “”, one as “” and 12 galaxies that were classified as “”. Again, the latter have bluer UV spectra. There are several galaxies with redshifts close to the range we used to define Group 3 which we rejected as non-members on the basis of their being several separated in redshift. What is striking is how similar are the shapes of the SEDs, especially for the “” galaxies (Figure 4c). Examining the SEDs, we find only one anomaly; D0K111, classified as “”, has a SED more typical of an “” galaxy. Ignoring this galaxy, the SEDs are remarkably uniform in shape within the “” and within the “” members of this peak.
Another interesting point is that there are no “” galaxies in this peak fainter than a minimum luminosity which is brighter than our survey cutoff. This suggests that the “” galaxy luminosity function falls off at the faint end relative to that of “” and “” galaxies, as it does in the local Universe (Bingelli, Sandage & Tammann 1988).
Turning to the sky distribution, we see a “core” of four bright galaxies, all of which were classified as spectral class “”, surrounded by many fainter galaxies which do not appear to show much central concentration, except that there are no galaxies in this peak in the top (Northern) 20% of the field. In this group, the brightest galaxy at (D0K13) is in fact the “” galaxy located at the southern edge of the field, far from the apparent “core”, but the most luminous galaxy is D0K08, an “” galaxy in the central core.
4.1.4 Group 4.
Here there are seven “” galaxies, one “” galaxy (which is the one of the two brightest galaxies in this group) and one “” galaxy surrounding a luminous AGN. There are no “” galaxies. The UV spectra are correspondingly bluer than for Group 3.
4.1.5 Group 5.
This group contains six “” and three “” galaxies, mixed between two separate velocity subgroups.
4.2 Spectral properties of group galaxies
The “” galaxies avoid the groups while the “”galaxies are under-represented outside the groups, (Figure 7). Again this effect has been seen before, particularly in studies of clusters of galaxies. Fisher et al. (1998) suggest, in their study of a rich galaxy cluster at , that the emission line galaxies have a higher velocity dispersion than do the absorption line systems and are still accreting into the cluster, an idea dating back to the seminal work of Gunn & Gott (1972). Lin et al. (1996b) analyzed the LCRS (Shectman et al. 1996) to show that the non-emission line galaxies show more clustering power over a wide range of scales than do the emission line galaxies. In very local surveys, Salzer (1989) and Rosenberg, Salzer & Moody (1994) have shown that emission line galaxies are more isolated (less clustered) than earlier type galaxies, while Benoist et al. (1996) claim to detect a strong dependence of clustering on galaxy luminosity in the SSRS2 sample.
At higher redshift, Phillips et al. (1997) studied a sample of compact galaxies in the HDF, most of which are galaxies with strong emission lines and high rates of star formation. They suggested that their sample tends to be less concentrated within the strong redshift peaks in the HDF than is the total HDF sample, in agreement with what we have found. This follows from comparing the redshifts of their HDF sample of blue compact galaxies to the redshift peaks found in the sample of Cohen et al. (1996b). Deep galaxy counts by Roche et al. (1996) suggest an angular correlation function which has higher amplitude for red galaxies than for blue galaxies. Lacking redshifts, they ascribe this to the much wider redshift range for faint blue galaxies.
These differences in the behavior of galaxies of various spectral types, in terms of the shape of their luminosity function, their maximum luminosity, their tendency to occur in groups, and their clustering properties, are of great importance in the design and interpretation of future redshift surveys where sparse sampling will be utilized.
Figures 4,5,6 show that the independently determined spectroscopic and SED classifications for galaxies in our sample are strongly correlated. The presence of emission lines is directly associated with bluer UV spectra and, indirectly, with bluer IR spectra. Furthermore there is weaker evidence for a differential effect within groups. If we ignore D0K111, we find that diminishes as the luminosity increases and that becomes redder. Figure 4 shows this for the group.
The ultraviolet extinction for the “” galaxies was discussed in §3.4. The similarity of the spectral indices among the galaxies in a given group found here confirms that the variation in UV extinction among the “” and “” sample galaxies is a function of spectral type with small scatter; we suspect that the reddening itself must be small.
4.3 Dynamics of Groups
It appears that the groups are mostly dynamically evolved structures. All of the five groups show strong evidence of non-uniformity on the sky and three of the five show an apparent central concentration, suggesting that some dynamical relaxation has taken place. Group 1, with only four members, is too small to make any statement and the field is too small to cover all of group 2. We can characterize these groups by their measured velocity dispersions (Table 2). We do this assuming that a 4.7Å instrumental uncertainty corresponding to has been removed in quadrature. (The dispersions are slightly smaller than those in Table 2 of Cohen et al. (1996a) due in part to re-reduction of one slitmask for which an erroneous wavelength scale was used in the preliminary reduction, and in part to the removal of the instrumental contribution.)
Note that both groups 3 and 5 show substructure with lower dispersions. In the case of group 3, a special effort was made to determine more accurately in the “core” of galaxies in the peak at . A template was prepared by summing up the spectra of the brightest absorption line galaxies in this peak, and then a cross correlation analysis was carried out using the wavelength region 5730 to 6896Å, which covers 3625 to 4360Å in the rest frame. for the four galaxies in the “core” is 180 km s-1. This value fluctuates between 150 and 200 km s-1 as the next three galaxies nearest the core are added.333In this special case, where all the galaxies are bright with high quality spectra, no observational error at all was removed.
If one believes that these are bound systems, and the group crossing times are Gyr so this is quite likely to be the case, one can calculate the dynamical masses and hence the mass-to-light ratios. In the present case, this procedure presents extra difficulties because some of the groups probably continue off the field. Nonetheless, if we assume that galaxies are point particles moving in a dark matter background, then we can define a geometrical and velocity center for each group and average to obtain a dynamical mass estimate (cf Bahcall & Tremaine 1981). The details of this procedure are quite model-dependent, even given complete sampling. (We choose to assume that the groups are spatially spherically symmetric, that the velocity distributions are locally isotropic and that the radial structure is quasi-isothermal.) On this basis, we compute maximum likelihood mass estimates out to the extremities of the observed galaxy distribution for groups 2,3,4,5 given in Table 2. (Group 1 is too small to carry out this procedure.) The associated densities in units of the current, mean cosmological density and the magnitude mass to light ratios are also given in Table 2. If we treat group 5 as two subgroups, the mass to light ratios are much closer to the other three estimates. These estimates are consonant with values obtained by other methods. Ramella et al. (1997) obtained a mean value for their sample of groups of M⊙/L⊙, while the CNOC survey has measured 295 M⊙/L⊙ (using the k-corrected R band luminosities; Carlberg et al. (1996)).
Furthermore, despite the large errors and uncertain cosmological calibration, it seems reasonable to conclude from the mass density measurement that group 3 formed before groups 2 and 4. (The age of the Universe at the time of emission are 8.7, 8.4, 7.4, 6.9, 6.5 Gyr for groups 1,2,3,4,5 respectively.) If we take the density measurements literally, we conclude that the Universe doubled in age over the time that groups first formed. Clearly, a larger database and numerical simulation will be necessary to improve upon these rough estimates.
4.4 Isolated galaxies
Let us now contrast the 62 galaxies in the five major groups with the 45 galaxies found outside groups with . It is apparent that the isolated galaxies are systematically less luminous than those in groups. KS tests show that the distributions in both observed magnitudes and inferred rest luminosities are significantly different. (Representative luminosity functions are presented below.) Our results suggest that a luminosity-density relation exists for galaxies in low density regions.
Also there is a higher proportion of “” galaxies in the field. The ratio of “” to “” galaxies is 13 : 8 as opposed to 4 : 26 for the group galaxies (of which 3 of the 4 galaxies are in group 1), with a similar conclusion if we classify the galaxies purely by their SEDs. In addition, there is an excess of “” galaxies with with . This may be a manifestation of large fluctuations caused by having only a few groups. (The properties of these “” galaxies are in contrast to what is observed at high redshift, where the strong emission line galaxies are very luminous. Cowie et al. (1996) first pointed out the change in the behavior with galaxy luminosity of the 3727Å [O II] emission; this is also related to the evolution of the 3727Å [O II] luminosity function with redshift found by Hogg et al. (1998) in the HDF.) Inspecting the sky distribution of these galaxies, we find no strong clustering beyond occasional pairs.
Most of the apparently isolated galaxies outside the 5 major redshift peaks are actually members of even smaller structures in redshift space or of pairs. The existence of “isolated” local field galaxies was discussed by Vettolani et al. (1986), who concluded that such objects are quite rare. We reach the same conclusion for the galaxies in this field at . This can be viewed as a manifestation of the highly correlated spatial distribution of galaxies.
4.5 Interpretation of the Groups
Table 2 gives some of the characteristics of the population of each of the redshift peaks. The total population of the group, its total luminosity, the number of galaxies with (calculated at ), the value of at which the galaxy (assuming it is an Sa) falls out of a mag sample, and the spectral type assigned to the brightest galaxy are given for each of the five major groups.
Cohen et al. (1996a) showed that the strong redshift peaks do not resemble distant galaxy clusters as rich as Virgo or richer. The velocity dispersion for the early-type galaxies in the relatively sparse Virgo cluster is 570 km s-1 (Bingelli, Tammann, & Sandage (1987)), significantly larger than that seen in most of the redshift peaks. The projected surface density of galaxies in the redshift peaks is much smaller than that in the cores of typical rich clusters, although it is probably not very different when compared to the peripheral regions. Furthermore, the Palomar Deep Cluster Survey (Postman et al. (1996)) finds only seven clusters of galaxies per square degree out to with richness class . Assuming a radius of 1 Mpc for each cluster, we calculate a probability of of intersecting such a rich cluster for . Thus the probability of producing multiple redshift peaks using clusters of galaxies is too small.
Zabludoff & Mulchaey (1998) have studied nearby poor groups of galaxies, poor being defined as having members with . These groups are, however, considerably more populous and more massive than the Local Group, but less concentrated than Hickson’s (1997) compact groups. They find groups with 20 – 50 members down to mag whose velocity dispersions are 190 to 460 km s-1 and with typical size of Mpc. Many of these show a central concentration of early type galaxies. The latest effort to catalog and search for groups in the CfA survey has been carried out by Ramella et al. (1997). The median velocity dispersion of the 406 groups they found is 190 km s-1. Our results show consistency with these findings extending to .
Such groups are much more common than rich clusters of galaxies in the local Universe. Ramella et al. (1997) found 406 groups, 149 of which contain 5 or more members, in the CfA catalog, while there are only 15 clusters within this sample of richness class 1 or greater. Thus the probability that a line of sight to will intersect a suitable number of groups so as to produce the observed redshift peaks seems reasonably high. Of course this requires that such groups already exist at . They must be stable old structures, not ones that collapsed and formed relatively recently.
Group 3 is clearly a structure one might call a poor cluster of galaxies. The predominance of absorption line galaxies, the large number of members, the central concentration, and the apparent virialization contrast strongly with the other looser, less populous redshift peaks dominated by galaxies of spectral type “C” which might properly be called groups. In Abell’s (1958) classification, Group 3, with members down to mag, would fall just below his adopted cutoff for richness class 0, the poorest class of cluster he considers.
How extended perpendicular to the line-of-sight might these strong redshift peaks be? We have obtained 500 spectra for a sample of galaxies in fields separated by up to 1 degree from this field. Although the analysis is incomplete, the data suggest the existence of correlated tructure over an angular scale of 1 degree (corresponding to a length scale of 10 Mpc for ), at least out to (Cohen et al. 1999b ). However, if this structure is present, it does not preclude essentially isolated and autonomous, virialized groups and clusters. Indeed it would be very surprising, on theoretical grounds, if large, sheet-like structures did not fragment in this manner (Bertschinger (1985)).
We have used this much larger sample to estimate the frequency of “poor clusters”, and find it reasonably close to that obtained by extrapolating to less populous clusters the frequency of Abell richness class 1 clusters. Further discussion of this is deferred to a future paper.
We now turn to the spectroscopy. Roughly 30% of the brightest galaxies in the peaks have been assigned a spectral type of “” rather than of “”, and the spectral class of the brightest galaxy itself switches from “” to “” (see Table 2) in the higher redshift peaks. This may well be a manifestation in galaxies in the field or groups of the Butcher-Oemler effect, which was initially associated with galaxy colors. Butcher & Oemler (1984) found that the bright galaxies in clusters of galaxies at have much bluer colors than normal elliptical galaxies, with the fraction of blue galaxies reaching 80% at (Rakos & Schombert (1995)). The “blue galaxies” have been studied spectroscopically in rich galaxy clusters by, e.g., Lavery & Henry (1988), Dressler & Gunn (1992), Caldwell & Rose (1997), and their spectra of such objects in rich galaxy clusters look much like ours for field galaxies.
We hypothesize, perhaps simplistically, that the differences among the redshift peaks are due purely to the amplitude of the initial perturbation, that this amplitude for the proto-Group 3 was larger than for any of the other redshift structures, and that this in itself produced a structure that collapsed earlier with stronger virialization and more rapid exhaustion of gas, thus leading to the differences we see today among the redshift peaks. In our view there is no sudden change in any initial property that marks a boundary between a poor cluster and a rich group, although their appearance at the current epoch is quite different.
We have marshalled the evidence which shows quite clearly that, (for ), the group galaxies are more luminous and have weaker UV emission than their counterparts in the field. The striking similarities of the SEDs within a group leads us to hypothesize that the galaxies within a group are coeval although different groups did not form simultaneously. The groups are then somewhat analogous to globular clusters where one can observe the contemporaneous evolution of stars of different mass. It is then, in turn, reasonable to suppose that the extreme paucity of “” galaxies in these groups (excepting Group 1) is a reflection of their age and is analogous to the presence of a main sequence turnoff in a globular cluster. On this basis, we argue that, at the emission epoch, group 3 is the oldest structure, followed by groups 5, 2, 4, and 1 in that order. It is re-assuring that this order is consonant with that obtained on dynamical grounds.
It appears that these galaxy groups are higher density regions where the morphology-density relation (Dressler (1980); Dressler et al. (1997)), extended to even lower galaxy density than the rich clusters where it was originally found, biases the morphological mix towards ellipticals and S0 galaxies. Furthermore our results strongly suggest that high luminosity galaxies, which presumably are high mass galaxies, form most readily and almost exclusively in regions of higher galaxy density. As a group ages, the incidence of star formation within its constituent galaxies diminishes. However, it is necessary to understand the stellar evolution chronometrically in order to decide whether or not the star formation rate declines secularly or is intermittent with decreasing duty cycle.
5 Evolution of the Luminosity Function and SEDs
5.1 Luminosity Functions for
We have argued that our sample is quite complete and with a uniform selection criterion , out to , at least. However, we have uncovered dramatic inhomogeneity in the galaxy types. As this variation is associated with comparatively few structures along a single pencil beam, we are subject to strong Poissonian fluctuations and it is not possible to explore evolution in detail using this sample alone. In spite of this, we can use the data set to compute volume-averaged luminosity functions out to .
Our procedure is to split the data into a few subsets and to fit Schechter luminosity functions to the shape of these distributions for each subset, solving for the conventional parameters using maximum likelihood estimators (cf Hogg 1998). We then used the observed galaxies to normalize the distributions to obtain estimators of . After some experimentation, we find that the minimum number of subsets that is necessary is three; isolated galaxies, “” galaxies in groups and “” galaxies (plus the single “” galaxy in a group) in groups. (Group 1 is excluded.) (Additional partitioning of the sample does not produce any more significant results and dividing the galaxies on the basis of their SEDs rather than their spectroscopy gives similar conclusions as might be expected.) This procedure takes into account the selection at of the sample, the correlation between and shown in Figure 6, and the differences among the subsets used of their luminosity functions. The results for constant with are given in Table 3 and the composite luminosity function is shown in Figure 10. Calculations with increasing slightly with show a strong covariance between and . A reasonable fit can be obtained with , but much larger increases in can be ruled out. For that evolution of , which corresponds well with passive evolution in some galaxy models, we find (see Table 3) and for the entire sample of 108 galaxies out to , a good match with local values.
The two most striking features of this analysis are the smaller value of for the isolated galaxies and the larger value of (flatter luminosity function at the faint end) for the “” galaxies in the groups. Both conclusions are apparent from Figures 1 and 5, the former from the shortage of galaxies outside of groups and the latter from the paucity of group galaxies close to the selection limit. Again, neither result is without precedent. We know from the work of Ellis (1997) and references cited therein that there is a relatively local population of low luminosity galaxies. What we are demonstrating is that these are found preferentially in low density regions. Furthermore, Bingelli, Sandage & Tammann (1988) argued that, in clusters, the traditional Schechter form with was actually a superposition of luminosity functions each more strongly localized in . A similar result has also obtained from the LCRS, a sample dominated by field galaxies, by Lin et al. (1996a). They demonstrate that the faint end of the LF in their sample is dominated by emission line galaxies.
We have found that this is also true of lower density groups, and have extended the regime over which this effect is seen out to .
5.2 Density Evolution
With this prescription in hand we can now use the “low” redshift luminosity functions to predict the number of galaxies expected in the redshift interval on the hypothesis that there is no density evolution. These results are given in Table 3 and are not very sensitive to the assumed cosmological model, as changing the run of comoving volume with redshift invariably leads to a compensatory change in the luminosity. We find that in the no evolution model, 43 galaxies are predicted to have and 69 galaxies are expected under the passive evolution model, whereas, excluding two AGN, only 24 galaxies have redshifts in this interval. We hypothesize that a large fraction of the 32 galaxies in the galaxy sample without redshifts make up the deficit (see §3.3) and that no strong evolution in cosmological density is required. We see no evidence for extensive merging among the members of this sample out to .
We use the SEDs of the galaxies without redshifts to support our assertion of §3.3 that most of the objects without redshifts are galaxies with . Figure 11 shows the rest frame SEDs for the selection of these assuming , with the changes in luminosity and flux as varies from 0.5 to 1.5 indicated by the tilted scaled line. It can be seen that, in many cases, the choice of leads to plausible SEDs. Conversely, these galaxies would have unprecedented SEDs at much lower redshifts and would be far more luminous than any galaxy population for which we have evidence if their redshifts were .
Our hypothesis advanced in §3.3 that many of the galaxies without measured redshifts are at is crucial to our statements regarding the absence of mergers. It is at variance with the conclusion of Kauffmann & Charlot (1998), based upon analysis of -selected redshift surveys to brighter limiting magnitude. It may be possible to test our hypothesis in a few cases by integrating longer on a few of these galaxies. Also relevant in setting constraints on the merger rate is an analysis of the very close pairs, an issue we defer to a future paper.
6 Galaxy Morphology
Morphological classifications on the basis of HST images have been provided for some of the galaxies in this sample by Driver, Windhorst, & Griffiths (1995). They classify 25 objects in this field as elliptical galaxies, various types of spirals or irregular galaxies. Nineteen galaxies are in common between the two samples; the remaining six are just outside the spatial boundary of our sample. Although Driver et al. state that “no attempt has been made to separate stars from compact ellipticals”, it is interesting to note that both of the objects in common classified on the basis of morphology as elliptical galaxies are spectroscopically confirmed galactic stars. Examination of the HST images from the STScI archive shows that both of these objects appear stellar.
The latest type galaxy in common (D0K105) was classified by Driver et al. as an irregular. Its spectrum shows very strong emission at 3727, and also shows emission at 4959Å, H and 5007Å. Ignoring the stars, the correlation between the morphological classes and the spectroscopic classes for the galaxies in common is reasonable. More precise spectral classes for the galaxies and/or a larger sample with spectroscopy, SEDs, and morphological classifications are required to strengthen this statement.
In general, we expect these spectral classes and SEDs to be strongly correlated with galaxy morphology and this will be testable using a similar survey in the Hubble Deep Field, currently in preparation (Cohen et al. 1999a ).
7 Discussion
A deep galaxy redshift survey has been performed on a single 15 sq arcmin field with the Keck Telescope. Our sample is carefully selected at infrared wavelengths where the luminosity should be a good tracer of the stellar mass (Tegmark & Peebles 1998) and the cosmological corrections to the spectra should be minimized. To a magnitude limit of , the sample contains 195 objects, including 24 spectroscopically confirmed Galactic stars. The remaining 171 objects appear to be galaxies and redshifts have been measured for 139 of these. 109 of these galaxies have redshifts and we argue on observational grounds that our survey is more than 90 percent complete to this redshift. The remaining 30 redshifts lie in the interval and contain a higher proportion of uncertain values. The spectra of the 139 galaxies with redshifts have been distributed into four classes, “” (emission), “” (composite), “” (absorption) and “” (AGN). In addition we compute rest frame SEDs using our six band () photometry. The galaxy redshift distribution shows that 60 percent of the galaxies are found in five compact groups in velocity space, the largest of which has 29 members.
We have discovered three strong correlations:
-
1.
The SEDs are closely related to the spectral type assigned on the basis of the presence or absence of key diagnostic features ([OII]3727, H+K, [OIII]5007, etc), in the sense that “” galaxies have redder UV and IR spectra, whereas “” galaxies have bluer spectra. The association of a hard ultraviolet continuum with emission lines is unsurprising, (although it does limit the presence of dust), but the correlation of the infrared slope is of interest and implies that galaxies are more similar in (rest frame) optical luminosity than infrared luminosity, even when selected at infrared wavelengths.
This regularity in the behavior of galaxy SEDs, extending over all galaxy spectral types, across our broad wavelength coverage and up to is one reason why photometric redshift techniques work reasonably well at least out to for high precision photometric data sets.
-
2.
The spectra and SEDs are correlated with galaxy luminosity, most strikingly with the infrared luminosity. The “” galaxies are more luminous than the “” galaxies and, consequently, have redder infrared spectra.
-
3.
The luminous, red, “” galaxies exhibit a strong preference for the groups; their “” counterparts inhabit the isolated regions between groups.
In many respects, these luminosity-density-spectrum correlations extend results for rich clusters of galaxies to lower density environments.
In addition to discovering these correlations, we confirm that the global luminosity function out to , at least, exhibits no more than mild luminosity evolution and only modest density evolution and is consistent with the Schechter form. If we assume passive evolution, consistent with magnitude dimming since , our derived local luminosity function matches the standard one in shape and in the derived value of . However, it appears to be a sum of separate and distinguishable components with different shapes. The galaxies in the low density regions (which are bluer and more frequently “” type) have steeper low luminosity slopes; the luminosity function of the redder “” group galaxies has a much flatter low luminosity slope.
Turning to the interval, we verify that the “” galaxies are more luminous than their low redshift counterparts. Apart from this, and taking into account the spectroscopic selection effects, there is no evidence for strong evolution in the galaxies in our sample. Although we have found fewer galaxies in this redshift range than we expect by projecting the low z luminosity function backward in time, we argue, on quantitative and spectral grounds, that this deficit is made up by a large fraction of the 32 galaxies in our galaxy sample for which redshifts were not assigned. In particular, the very red galaxies, most of which are do not have measured redshifts, are probably the progenitors of the local high luminosity ellipticals. If so, they must already be quite old at these epochs.
In order to interpret these findings, we turn first to the groups. Although many of these features may have a much larger lateral coherence than the field width, it is apparent that they are typically inhomogeneous on smaller scales. A crude estimate of the associated masses furnishes core densities ranging from times the current cosmological density (assuming our cosmology.) The apparent crossing times are sufficiently short compared with the age of the Universe that these structures ought to be partially relaxed dynamically, even at redshifts . Although the chronology is uncertain, we argue that our richest and densest group (Group 3), which might properly be called a “poor cluster”, separated out from the overall expansion of the Universe first and on dynamical grounds should contain the oldest galaxies. This is consistent with an analysis of the stellar evolutionary history of the SEDs which argues for the presence of stars with ages Gyr in the reddest galaxies. (Our color-redshift distributions appear to be quite inconsistent with some published evolutionary models, especially those that postulate an active star formation history.)
We are only able to trace clustering out to , but the distribution on the sky of higher redshift galaxies found by Steidel et al. (1998) suggests that it originated at earlier times. The isolated galaxies in low density regions show evidence for recent star formation. It is hard to decide whether or not these galaxies are genuinely young, or rejuvenated by recent mergers (e.g. Babul & Rees 1992). On the one hand, the bluer infrared continuum slopes argue for a deficit of old stars; on the other, the low luminosities of the “” galaxies mean that they are more susceptible to large spectral changes when they interact with modest-sized companions. We do note, though, that our sample, like others that preceded it, shows scant evidence for merging of mature galaxies being a large factor in global galaxy evolution.
In this paper, we have reported upon some surprisingly strong correlations in the observed properties of galaxies. If these are confirmed in other fields and shown to be part of a larger pattern by morphological studies and investigations of large scale structure, then there should be optimism that our understanding of the evolution of galaxies will, one day, be placed on as firm a physical foundation as the corresponding theory of stars.
| ID | bb and | |||||||
|---|---|---|---|---|---|---|---|---|
| Log() | (14.14) | (14.54) | (14.66) | (14.74) | (14.83) | (14.91) | (15.00) | (15.10) |
| 18 | 0.69 | 0.49 | 0.46 | 0.47 | 0.49 | 0.74 | 1.02 | 1.34 |
| 104 | 1.48 | 1.21 | 1.14 | 1.11 | 1.17 | 1.20 | 1.24 | 1.27 |
| 88 | 1.34 | 1.09 | 1.04 | 1.04 | 1.06 | 1.29 | 1.62 | 1.98 |
| 54 | 0.92 | 0.91 | 0.94 | 0..99 | 0.95 | 1.14 | 1.47 | 1.83 |
| 71 | 1.15 | 0.90 | 0.86 | 0.87 | 0.90 | 1.08 | 1.33 | 1.62 |
| 149 | 1.32 | 1.04 | 0.96 | 0.91 | 0.68 | 0.99 | 1.13 | 1.29 |
| 25 | 0.31 | 0.16 | 0.12 | 0.11 | 0.09 | 0.26 | 0.45 | 0.64 |
| 187 | 1.32 | 0.93 | 0.81 | 0.83 | 0.86 | 0.98 | 1.15 | 1.28 |
| 171 | 1.16 | 0.99 | 0.94 | 0.94 | 0.94 | 1.14 | 1.35 | 1.58 |
| 11 | 0.23 | 0.07 | 0.16 | 0.22 | 0.28 | 0.62 | 1.20 | 1.91 |
| 57 | 0.46 | 0.43 | 0.42 | 0.42 | 0.43 | 0.54 | 0.68 | 0.70 |
| 144 | 0.95 | 0.91 | 0.90 | 0.89 | 0.89 | 1.02 | 1.15 | 1.32 |
| 110 | 0.85 | 0.54 | 0.45 | 0.42 | 0.41 | 0.52 | 0.66 | 0.83 |
| 132 | 0.94 | 0.60 | 0.50 | 0.47 | 0.46 | 0.57 | 0.73 | 0.75 |
| 17 | 0.16 | 0.09 | 0.06 | 0.01 | 0.08 | 0.48 | 1.02 | 1.88 |
| 159 | 1.01 | 0.81 | 0.75 | 0.71 | 0.65 | 0.69 | 0.76 | 0.74 |
| 81 | 0.59 | 0.40 | 0.34 | 0.32 | 0.29 | 0.47 | 0.55 | 0.78 |
| 147 | 0.80 | 0.88 | 0.90 | 0.96 | 1.07 | 1.13 | 1.42 | 1.43 |
| 6 | 0.81 | 0.62 | 0.57 | 0.50 | 0.41 | 0.02 | 0.47 | 1.43 |
| 14 | 0.31 | 0.19 | 0.15 | 0.09 | 0.01 | 0.39 | 0.95 | 1.64 |
| 35 | 0.02 | 0.02 | 0.02 | 0.06 | 0.14 | 0.39 | 0.75 | 1.07 |
| 138 | 0.78 | 0.73 | 0.71 | 0.74 | 0.81 | 1.02 | 1.33 | 1.61 |
| 33 | 0.05 | 0.10 | 0.15 | 0.22 | 0.33 | 0.71 | 1.15 | 1.64 |
| 83 | 0.45 | 0.60 | 0.65 | 0.72 | 0.85 | 1.03 | 1.36 | 1.79 |
| 31 | 0.03 | 0.06 | 0.08 | 0.14 | 0.24 | 0.60 | 1.11 | 1.92 |
| 16 | 0.28 | 0.14 | 0.10 | 0.06 | 0.01 | 0.31 | 0.63 | 1.01 |
| 55 | 0.21 | 0.26 | 0.28 | 0.32 | 0.39 | 0.59 | 0.88 | 1.17 |
| 161 | 0.85 | 0.88 | 0.89 | 0.92 | 0.98 | 1.19 | 1.35 | 1.65 |
| 87 | 0.53 | 0.42 | 0.39 | 0.38 | 0.37 | 0.50 | 0.63 | 0.68 |
| 9 | 0.61 | 0.39 | 0.32 | 0.26 | 0.16 | 0.14 | 0.49 | 0.94 |
| 167 | 0.96 | 0.70 | 0.63 | 0.62 | 0.66 | 0.79 | 0.95 | 1.05 |
| 102 | 0.43 | 0.74 | 0.83 | 0.95 | 1.15 | 1.21 | 1.31 | 1.42 |
| 189 | 0.68 | 1.07 | 1.19 | 1.30 | 1.36 | 1.65 | 1.84 | 2.05 |
| 151 | 0.65 | 0.70 | 0.71 | 0.75 | 0.74 | 1.06 | 1.25 | 1.46 |
| 73 | 0.39 | 0.14 | 0.06 | 0.03 | 0.04 | 0.17 | 0.36 | 0.38 |
| 153 | 0.70 | 0.67 | 0.66 | 0.67 | 0.65 | 0.85 | 1.09 | 1.21 |
| 58 | 0.16 | 0.10 | 0.08 | 0.08 | 0.06 | 0.31 | 0.49 | 0.69 |
| 90 | 0.32 | 0.40 | 0.43 | 0.46 | 0.46 | 0.64 | 0.78 | 0.79 |
| 97 | 0.15 | 0.00 | 0.59 | 0.72 | 0.82 | 0.91 | 1.04 | 0.99 |
| 79 | 0.23 | 0.27 | 0.28 | 0.31 | 0.30 | 0.64 | 0.99 | 1.11 |
| 170 | 0.82 | 0.51 | 0.42 | 0.37 | 0.29 | 0.49 | 0.62 | 0.69 |
| 63 | 0.05 | 0.17 | 0.21 | 0.25 | 0.26 | 0.52 | 0.69 | 0.82 |
| 157 | 0.69 | 0.55 | 0.50 | 0.49 | 0.44 | 0.67 | 0.91 | 0.93 |
| 86 | 0.37 | 0.15 | 0.09 | 0.05 | 0.01 | 0.14 | 0.21 | 0.30 |
| 127 | 0.62 | 0.28 | 0.18 | 0.12 | 0.03 | 0.21 | 0.21 | 0.25 |
| 122 | 0.50 | 0.36 | 0.32 | 0.29 | 0.26 | 0.56 | 0.70 | 0.79 |
| 139 | 0.24 | 0.70 | 0.84 | 0.93 | 1.04 | 1.09 | 1.05 | 1.11 |
| 27 | 0.44 | 0.22 | 0.15 | 0.11 | 0.06 | 0.32 | 0.63 | 0.98 |
| 32 | 0.44 | 0.14 | 0.05 | 0.01 | 0.09 | 0.45 | 0.85 | 1.25 |
| 48 | 0.23 | 0.01 | 0.08 | 0.13 | 0.19 | 0.39 | 0.63 | 0.88 |
| 101 | 0.25 | 0.34 | 0.36 | 0.38 | 0.41 | 0.76 | 1.04 | 1.31 |
| 8 | 0.93 | 0.66 | 0.58 | 0.53 | 0.47 | 0.03 | 0.51 | 1.16 |
| 131 | 0.38 | 0.49 | 0.52 | 0.54 | 0.56 | 0.92 | 1.24 | 1.60 |
| 163 | 0.52 | 0.65 | 0.68 | 0.71 | 0.74 | 1.15 | 1.66 | 2.24 |
| 22 | 0.56 | 0.36 | 0.30 | 0.26 | 0.22 | 0.23 | 0.71 | 1.30 |
| 45 | 0.25 | 0.07 | 0.02 | 0.02 | 0.07 | 0.51 | 0.89 | 1.34 |
| 70 | 0.02 | 0.19 | 0.24 | 0.27 | 0.31 | 0.68 | 1.06 | 1.48 |
| 89 | 0.15 | 0.31 | 0.36 | 0.39 | 0.43 | 0.86 | 1.29 | 1.77 |
| 145 | 0.49 | 0.50 | 0.50 | 0.50 | 0.50 | 0.77 | 0.96 | 1.18 |
| 165 | 0.52 | 0.65 | 0.68 | 0.71 | 0.74 | 1.20 | 1.70 | 2.27 |
| 19 | 0.59 | 0.42 | 0.37 | 0.34 | 0.30 | 0.14 | 0.63 | 1.24 |
| 28 | 0.42 | 0.25 | 0.20 | 0.17 | 0.13 | 0.29 | 0.79 | 1.41 |
| 29 | 0.44 | 0.24 | 0.18 | 0.14 | 0.10 | 0.30 | 0.81 | 1.44 |
| 40 | 0.26 | 0.13 | 0.10 | 0.07 | 0.05 | 0.36 | 0.88 | 1.54 |
| 47 | 0.21 | 0.02 | 0.03 | 0.07 | 0.11 | 0.42 | 0.73 | 0.99 |
| 111 | 0.29 | 0.41 | 0.45 | 0.47 | 0.50 | 1.00 | 1.61 | 2.29 |
| 133 | 0.47 | 0.40 | 0.38 | 0.37 | 0.36 | 0.48 | 0.56 | 0.65 |
| 39 | 0.35 | 0.09 | 0.01 | 0.04 | 0.10 | 0.45 | 0.86 | 1.36 |
| 114 | 0.39 | 0.34 | 0.33 | 0.32 | 0.31 | 0.51 | 0.73 | 0.86 |
| 49 | 0.15 | 0.04 | 0.01 | 0.01 | 0.03 | 0.30 | 0.60 | 0.75 |
| 62 | 0.05 | 0.09 | 0.13 | 0.16 | 0.20 | 0.49 | 0.76 | 0.94 |
| 67 | 0.04 | 0.17 | 0.23 | 0.27 | 0.32 | 0.72 | 1.16 | 1.65 |
| 116 | 0.30 | 0.46 | 0.51 | 0.54 | 0.58 | 0.91 | 1.27 | 1.67 |
| 80 | 0.04 | 0.30 | 0.38 | 0.43 | 0.49 | 0.69 | 0.74 | 1.10 |
| 164 | 0.58 | 0.55 | 0.54 | 0.53 | 0.52 | 0.72 | 0.90 | 1.10 |
| 13 | 0.68 | 0.51 | 0.45 | 0.42 | 0.38 | 0.14 | 0.03 | 0.18 |
| 36 | 0.53 | 0.13 | 0.01 | 0.07 | 0.16 | 0.41 | 0.73 | 1.07 |
| 103 | 0.36 | 0.15 | 0.09 | 0.04 | 0.00 | 0.16 | 0.24 | 0.37 |
| 166 | 0.57 | 0.49 | 0.47 | 0.45 | 0.44 | 0.58 | 0.72 | 0.79 |
| 30 | 0.47 | 0.28 | 0.22 | 0.18 | 0.14 | 0.17 | 0.49 | 0.76 |
| 184 | 0.69 | 0.49 | 0.43 | 0.39 | 0.34 | 0.50 | 0.65 | 0.69 |
| 85 | 0.10 | 0.15 | 0.17 | 0.18 | 0.19 | 0.38 | 0.51 | 0.62 |
| 78 | 0.10 | 0.03 | 0.01 | 0.01 | 0.03 | 0.06 | 0.12 | 0.19 |
| 162 | 0.49 | 0.46 | 0.45 | 0.44 | 0.44 | 0.54 | 0.68 | 0.77 |
| 44 | 0.37 | 0.21 | 0.16 | 0.13 | 0.09 | 0.15 | 0.37 | 0.57 |
| 41 | 0.43 | 0.21 | 0.14 | 0.10 | 0.05 | 0.34 | 0.73 | 1.15 |
| 74 | 0.27 | 0.16 | 0.29 | 0.37 | 0.47 | 0.80 | 1.20 | 1.65 |
| 51 | 0.39 | 0.12 | 0.04 | 0.01 | 0.08 | 0.44 | 0.77 | 1.13 |
| 96 | 0.10 | 0.25 | 0.36 | 0.43 | 0.51 | 0.67 | 0.92 | 1.19 |
| 84 | 0.06 | 0.04 | 0.04 | 0.03 | 0.03 | 0.21 | 0.34 | 0.47 |
| 24 | 0.77 | 0.38 | 0.26 | 0.18 | 0.10 | 0.19 | 0.58 | 0.92 |
| 34 | 0.55 | 0.38 | 0.32 | 0.29 | 0.25 | 0.13 | 0.48 | 0.86 |
| 52 | 0.30 | 0.19 | 0.16 | 0.14 | 0.11 | 0.11 | 0.31 | 0.52 |
| 100 | 0.09 | 0.29 | 0.40 | 0.48 | 0.56 | 0.84 | 1.13 | 1.46 |
| 12 | 0.65 | 0.88 | 0.95 | 1.00 | 1.05 | 1.01 | 0.96 | 1.02 |
| 105 | 0.15 | 0.13 | 0.13 | 0.12 | 0.11 | 0.20 | 0.26 | 0.26 |
| 56 | 0.41 | 0.01 | 0.11 | 0.19 | 0.29 | 0.55 | 0.71 | 0.69 |
| 178 | 0.58 | 0.25 | 0.15 | 0.08 | 0.01 | 0.18 | 0.42 | 0.54 |
| 143 | 0.03 | 0.32 | 0.41 | 0.47 | 0.53 | 0.90 | 1.07 | 1.26 |
| 142 | 0.04 | 0.28 | 0.35 | 0.40 | 0.46 | 0.73 | 1.05 | 1.40 |
| 38 | 0.64 | 0.42 | 0.35 | 0.31 | 0.25 | 0.03 | 0.32 | 0.65 |
| 46 | 0.42 | 0.43 | 0.44 | 0.44 | 0.44 | 0.28 | 0.16 | 0.11 |
| 75 | 0.17 | 0.16 | 0.15 | 0.15 | 0.15 | 0.03 | 0.15 | 0.24 |
| 179 | 0.30 | 0.40 | 0.43 | 0.45 | 0.47 | 0.69 | 0.88 | 1.09 |
| 59 | 0.48 | 0.17 | 0.08 | 0.02 | 0.05 | 0.28 | 0.36 | 0.65 |
| 66 | 0.58 | 0.00 | 0.17 | 0.29 | 0.42 | 0.63 | 1.01 | 1.44 |
| 37 | 0.73 | 0.40 | 0.31 | 0.24 | 0.16 | 0.19 | 0.51 | 0.87 |
| 140 | 0.15 | 0.18 | 0.19 | 0.20 | 0.20 | 0.39 | 0.64 | 0.76 |
| 60 | 0.78 | 0.01 | 0.22 | 0.37 | 0.55 | 0.85 | 1.13 | 1.45 |
| 150 | 0.02 | 0.12 | 0.15 | 0.17 | 0.19 | 0.38 | 0.46 | 0.51 |
| 137 | 0.12 | 0.01 | 0.05 | 0.08 | 0.10 | 0.02 | 0.08 | 0.02 |
| 183 | 0.14 | 0.18 | 0.19 | 0.20 | 0.22 | 0.35 | 0.50 | 0.41 |
| 175 | 0.10 | 0.13 | 0.14 | 0.14 | 0.15 | 0.31 | 0.41 | 0.36 |
| 121 | 0.08 | 0.12 | 0.13 | 0.14 | 0.15 | 0.02 | 0.04 | 0.09 |
| 174 | 0.37 | 0.24 | 0.42 | 0.54 | 0.68 | 0.73 | 0.79 | 0.85 |
| 172 | 0.02 | 0.06 | 0.07 | 0.08 | 0.09 | 0.15 | 0.29 | 0.52 |
| 185 | 0.10 | 0.12 | 0.12 | 0.13 | 0.13 | 0.17 | 0.19 | 0.19 |
| 507 | 0.25 | 0.23 | 0.22 | 0.22 | 0.23 | 0.08 | 0.07 | 0.22 |
| 125 | 0.28 | 0.13 | 0.09 | 0.06 | 0.03 | 0.12 | 0.25 | 0.34 |
| 108 | 0.31 | 0.22 | 0.19 | 0.17 | 0.15 | 0.06 | 0.04 | 0.10 |
| 181 | 0.18 | 0.11 | 0.19 | 0.25 | 0.31 | 0.35 | 0.45 | 0.75 |
| 93 | 0.29 | 0.39 | 0.42 | 0.44 | 0.50 | 0.40 | 0.23 | 0.09 |
| 64 | 1.10 | 0.40 | 0.19 | 0.05 | 0.10 | 0.30 | 0.55 | 0.82 |
| 152 | 0.42 | 0.07 | 0.04 | 0.11 | 0.22 | 0.21 | 0.23 | 0.25 |
| 26 | 1.26 | 0.96 | 0.87 | 0.81 | 0.75 | 0.69 | 0.64 | 0.60 |
| 42 | 1.34 | 0.79 | 0.63 | 0.52 | 0.40 | 0.22 | 0.05 | 0.27 |
| 182 | 0.25 | 0.01 | 0.06 | 0.11 | 0.16 | 0.18 | 0.20 | 0.41 |
| 76 | 0.75 | 0.55 | 0.49 | 0.45 | 0.40 | 0.28 | 0.03 | 0.12 |
| 188 | 0.07 | 0.11 | 0.12 | 0.13 | 0.15 | 0.14 | 0.12 | 0.16 |
| 135 | 0.57 | 0.30 | 0.22 | 0.17 | 0.11 | 0.00 | 0.29 | 0.60 |
| 65 | 1.28 | 0.65 | 0.46 | 0.33 | 0.19 | 0.06 | 0.10 | 0.29 |
| 113 | 1.00 | 0.39 | 0.21 | 0.09 | 0.05 | 0.14 | 0.06 | 0.13 |
| 112 | 0.68 | 0.47 | 0.41 | 0.36 | 0.32 | 0.27 | 0.18 | 0.15 |
| 126 | 0.45 | 0.44 | 0.43 | 0.43 | 0.39 | 0.42 | 0.42 | 0.37 |
| 158 | 0.49 | 0.29 | 0.23 | 0.19 | 0.15 | 0.10 | 0.00 | 0.10 |
| 128 | 0.55 | 0.43 | 0.39 | 0.37 | 0.34 | 0.30 | 0.10 | 0.04 |
| 69 | 1.23 | 0.75 | 0.61 | 0.51 | 0.40 | 0.31 | 0.12 | 0.10 |
| 68 | 1.08 | 0.85 | 0.78 | 0.73 | 0.83 | 0.64 | 0.44 | 0.12 |
| 123 | 0.85 | 0.55 | 0.46 | 0.40 | 0.34 | 0.27 | 0.25 | 0.26 |
.
| range | N | Total | spectral type | ccAn observational error of 175 km s-1 has been removed in quadrature. | ||||
|---|---|---|---|---|---|---|---|---|
| ( | () | (for mag) | of brightest | (km s-1) | (at ) | |||
| galaxy | (Rest Frame) | |||||||
| 0.391 – 0.394 | 4 | 0 | 2 | 0.05 | 250 | … | … | |
| 0.428 – 0.432 | 10 | 1 | 7 | 0.06 | 300 | 300 | 250 | |
| 0.577 – 0.588 | 29 | 8 | 25 | 0.12 | 495 | 165 | 665 | |
| 0.676 – 0.681 | 10 | 4aaIncludes one QSO | 19 | 0.16 | bbExcluding the QSO | 260 | 100 | 180 |
| 0.761 – 0.772 | 9 | 4 | 10 | 0.21 | 785 | 1500 | 480 |
| Galaxy Set | |||||
|---|---|---|---|---|---|
| ( at | () | () | |||
| No evolutionaa is assumed to be constant to . | |||||
| Isolated | 51 | 0.96 | 1.75 | 2.93 | 11 |
| Group bbIncludes one “” galaxy as well. | 33 | 1.34 | 1.32 | 2.11 | 14 |
| Group | 24 | 0.96 | 0.34 | 3.31 | 18 |
| All | 108 | 1.61 | 1.52 | 4.71 | 42 |
| Passive evolutioncc. | |||||
| Isolated | 51 | 0.63 | 1.71 | 5.33 | 8 |
| Group bbIncludes one “” galaxy as well. | 33 | 0.78 | 1.25 | 3.04 | 10 |
| Group | 24 | 0.66 | 0.36 | 5.45 | 19 |
| All | 108 | 1.00 | 1.47 | 5.62 | 69 |
References
- Abell (1958) Abell, G.O., 1958, ApJS, 3, 211
- Abraham et al. (1996) Abraham, R. G., Tanvir, N. R., Santiago, B. X., Ellis, R. S., Glazebrook, K., & van den Bergh, S. 1996, MNRAS, 279, L47
- Allen (1973) Allen, C.W. 1973, Astrophysical Quantities, Atholone Press, London
- Aragón–Salamanca et al. (1993) Aragón–Salamanca, A., Ellis, R.S., Couch, W. J., & Carter, D. 1993, MNRAS, 262, 764
- Babul & Rees (1992) Babul, A. & Rees, M. J. 1992, MNRAS, 255, 346
- Bahcall & Tremaine (1981) Bahcall, J. N. & Tremaine, S. 1981, ApJ, 244, 805
- (7) Barger, A. J., Aragon-Salamanca, A., Smail, I., Ellis, R. S., Couch, W. J., Dressler, A., Oemler, A., Jr., Poggianti, B. M., & Sharples, R. M. 1998, ApJ, 501, 522
- (8) Barger, A. J., Cowie, L. L., Sanders, D. B., Fulton, E., Taniguchi, Y., Sato, Y., Kawara, K. & Okuda, H., 1999, Nature, in press (Astro-ph/9806317)
- Benoist et al. (1996) Benoist, C., Maurogordata, S., Da Costa, L. N., Cappi, A. & Schaeffer, R., 1996, ApJ, 472, 452
- Bertelli et al. (1994) Bertelli, G., Bressan, A., Chiosi, c., Fagotto, F. & Nasi, E. 1994, A & A Supplement, 275, 302
- Bertschinger (1985) Bertschinger, E., 1985, ApJ, 295, 1
- Bessell (1979) Bessell, M. J. 1979, PASP, 91, 589
- Bingelli, Tammann, & Sandage (1987) Bingelli, B., Tammann, G. A., & Sandage, A. 1987, AJ, 94, 251
- Bingelli, Sandage, & Tammann (1988) Bingelli, B., Sandage, A., & Tammann, G. A. 1988, ARA&A, 26, 509
- Blain et al. (1998) Blain, A.W., Ivison, R.J. & Smail, I., 1998, MNRAS, 296, L29
- Bruzual & Charlot (1993) Bruzual, G., & Charlot, S. 1993, ApJ, 405, 538
- Bruzual & Charlot (1996) Bruzual, G., & Charlot, S. 1996, in preparation
- Butcher & Oemler (1984) Butcher, H., & Oemler, A., Jr. 1984, ApJ, 439, 47
- Caldwell & Rose (1997) Caldwell, N., & Rose, J. A. 1997, AJ, 113, 492
- Calzetti, Kinney & Storchi-Bergmann (1994) Calzetti, D., Kinney, A.L. & Storchi-Bergmann 1994, ApJ, 429, 582
- Calzetti (1997) Calzetti, D. 1997, in The Ultraviolet Universe at Low and High Redshift: Probing the Progress of Galaxy Evolution, ed. W.H.Waller, M.N.Fanelli, J.E.Hollis & A.C.Danks, AIP Conference Proceedings 408, (New York: Woodbury), 403
- Carlberg et al. (1996) Carlberg, R. G, Yee, H. K. C., Ellingson, E., Abraham, R., Gravel, P., Morris, S., & Pritchet, C. J. 1996, ApJ, 462, 32
- Cohen et al. (1998) Cohen, J. G., Hogg, D.W., Pahre, M.A. Blandford, R., Shopbell, P.L. & Richberg, K.R., 1998, submitted to the ApJS
- (24) Cohen, J. G. et al. 1998a, in preparation
- (25) Cohen, J. G. et al. 1998b, in preparation
- (26) Cohen, J. G., Hogg, D. W., Pahre, M. A., & Blandford, R., 1996a, ApJ, 462, L9
- (27) Cohen, J. G., Cowie, L. L., Hogg, D. W., Songaila, A., Blandford, R., Hu, E. M., & Shopbell, P., 1996b, ApJ, 471, L5
- Connolly et al. (1995) Connolly, A.J., Csabai, I., Szalay, A.S., Koo, D.C., Kron, R.G.. & Munn, J.A. 1995, AJ, 110, 2655
- Couch, Ellis, & Sharples (1994) Couch, W. J., Ellis, R. S., & Sharples, R. M. 1994, ApJ, 430, 121
- Cowie et al. (1994) Cowie, L. L., Gardner, J. P., Hu, E. M., Songaila, A., Hodapp, K.-W., & Wainscoat, R. J. 1994, ApJ, 434, 114
- Cowie et al. (1996) Cowie, L. L., Songaila, A., Hu, E. M., & Cohen, J.G. 1996, AJ, 112, 839
- Crampton et al. (1995) Crampton, D., LeFèvre, O., Lilly, S. J., & Hammer, F. 1995, ApJ, 455, 96
- Dressler (1980) Dressler, A. 1980, ApJ, 236, 351
- Dressler & Gunn (1992) Dressler, A., & Gunn, J. E. 1992, ApJS, 78, 1
- Dressler et al. (1997) Dressler, A., Oemler, A., Jr., Couch, W. J., Smail, I., Ellis, R. S., Barger, A., Butcher, H., Poggianti, B. M., & Sharples, R. M., 1997, ApJ, 490, 577
- Driver, Windhorst, & Griffiths (1995) Driver, S. P., Windhorst, R. A., & Griffiths, R. E. 1995, ApJ, 453, 48
- Dunlop et al. (1996) Dunlop, J., Peacock J., Spinrad H., Dey A., Jimenez R., Stern D. & Windhorst R. 1996, Nature, 381, 581
- Eales et al. (1998) Eales, S., Lilly, S., Gear, W., Dunne, L., Bond, J. R., Hammer, F., Le Fevre, O. & Crampton, D., 1998, submitted to ApJ, Astro-ph/9808040
- Ellis (1997) Ellis, R. S. 1997, ARA&A, 35, 389
- Fanelli et al. (1992) Fanelli, M.N., O’Connell, R.W., Burstein, D. & Wu, C.C., 1992, ApJS, 82, 197
- Fisher et al. (1998) Fisher, D., Fabricant, D., Franx, M. & Van Dokkum, P., 1998, ApJ, 498, 195
- Gardner et al. (1997) Gardner, J. P., Sharples, R. M., Frenk, C. S., Carrasco, B. E. 1997, ApJ, 480, L99
- Glazebrook et al. (1995) Glazebrook, K., Ellis, R., Santiago, B., & Griffiths, R. 1995, MNRAS, 275, L19
- Graham & Dey (1996) Graham, J. R., & Dey, A. 1996, ApJ, 471, 720
- (45) Griffiths, R. E. et al. 1994a, ApJ, 435, L19
- (46) Griffiths, R. E. et al. 1994b, ApJ, 437, 67
- Guhathakurta, Tyson, & Majewski (1990) Guhathakurta, P., Tyson, J. A., & Majewski, S. R. 1990, ApJ, 357, L9
- Gunn & Gott (1972) Gunn, J. E., & Gott, J. R. 1972, ApJ, 176, 1
- Hamilton (1985) Hamilton, D. 1985, ApJ, 297, 371
- Heap (1998) Heap, S. R. 1998, ApJ, 492, L131
- Heckman et al. (1998) Heckman, T. M., Robert, C., Leitherer, C., Garnett, D.R. & van der Rydt, F., 1998, ApJ, 503, 646
- Hickson (1997) Hickson, P. 1997, ARA&A, 35, 357
- Hogg (1998) Hogg, D. W. 1998, Ph.D. Thesis, California Institute of Technology
- Hogg et al. (1998) Hogg, D. W., Cohen, J. G., Blandford, R., & Pahre, M. A. 1998, ApJ, in press
- Hogg et al. (1997) Hogg, D. W., Pahre, M. A., McCarthy, J. K., Cohen, J. G., Blandford, R. D., Smail, I., & Soifer, B. T. 1997, MNRAS, 288, 404
- Kauffmann & Charlot (1998) Kauffmann, G. & Charlot, S. 1998, MNRAS, submitted
- Kelson et al. (1997) Kelson, D. D., van Dokkum, P. G., Franx, M., Illingworth, G. D. & Fabricant, D. 1997, ApJ, 478, L13
- Koo & Kron (1992) Koo, D. C., & Kron, R. G. 1992, ARA&A, 30, 613
- Lavery & Henry (1988) Lavery, R. J., & Henry, J. P. 1988, ApJ, 304, L5
- Lawrence et al. (1995) Lawrence, C. R., Elston, R., Januzzi, B. T. & Turner, E. L. 1995, AJ, 110, 2570
- Leitherer & Heckman (1995) Leitherer, C. & Heckman, T.M. 1995, ApJS, 96, 9
- Leitherer et al. (1996) Leitherer, C., et al. 1996, PASP, 108, 996
- Leggett (1992) Leggett, S. K. 1992, ApJS, 82, 351
- (64) Lin, H., Kirshner, R. P., Shectman, S. A., Landy, S. D., Oemler, A., Jr., Tucker, D. L., & Schechter, P. L. 1996, ApJ, 464, 60
- (65) Lin, H., Kirshner, R. P., Shectman, S. A., Landy, S. D., Oemler, A., Jr., Tucker, D. L., & Schechter, P. L. 1996, ApJ, 471, 617
- Loveday et al. (1992) Loveday, J., Peterson, B. A., Efstathiou, G., & Maddox S. J. 1992, ApJ, 390, 338
- Madau, Pozzetti, & Dickinson (1998) Madau, P., Pozzetti, L., & Dickinson, M. 1998, ApJ, 498, 106
- Marzke, Huchra, & Geller (1994) Marzke, R. O., Huchra, J. P., & Geller, M. J. 1994, ApJ, 428, 43
- Meurer et al. (1997) Meurer, G.R., Heckman, T.M., Lehnert, M.D., Leitherer, C. & Lowenthal, J. 1997, AJ, 114, 54
- Mobasher, Sharples, & Ellis (1993) Mobasher, B., Sharples, R. M., & Ellis, R. S. 1993, MNRAS, 263, 560
- Odewahn et al. (1996) Odewahn, S. C., Windhorst, R. A., Driver, S. P., & Keel, W. C. 1996, ApJ, 472, L130
- Oemler, Dressler, & Butcher (1997) Oemler, A., Jr., Dressler, A., & Butcher, H. R. 1997, ApJ, 474, 561
- Oke et al. (1995) Oke, J. B., Cohen, J. G., Carr, M., Cromer, J., Dingizian, A., Harris, F. H., Labrecque, S., Lucinio, R., Schaal, W., Epps, H., & Miller, J. 1995, PASP, 107, 307
- Oke, Gunn, & Hoessel (1996) Oke, J. B., Gunn, J. E., & Hoessel, J. G. 1996, AJ, 111, 29
- Pahre (1998) Pahre, M. A. 1998a, Ph.D. thesis, California Institute of Technology
- Pahre et al. (1998) Pahre, M. A., et al. 1998, ApJS, submitted
- Persson et al. (1993) Persson, S. E., McCarthy, P. J., Dressler, A., & Matthews, K., 1993, in The Evolution of Galaxies and their Environments, eds. D. Hollenbach, H. Thronson & J. M. Shull, NASA Conference Publication 3190, 69
- Pettini et al. (1998) Pettini, M., Kellogg, M., Steidel, C. C., Dickinson, M., Adelberger, K. L. & Giavalisco, M., 1998, ApJ, in press (Astro-ph/9806219)
- Phillips et al. (1997) Phillips, A.. C., Guzmán, R., Gallego, J., Koo, D. C., Lowenthal, J. D., Vogt, N. P., Faber, S. M. and Illingworth, G. D. 1997, ApJ, 489, 543
- Poggianti (1997) Poggianti, B. M. 1997, A&AS, 122, 399
- Postman et al. (1996) Postman, M. A., Lubin, L. M., Gunn, J. E., Oke, J. B., Hoessel, J. G., Schneider, D. P., Christensen, J. A. 1996, AJ, 111, 615
- Postman, Lubin & Oke (1998) Postman, M. A., Lubin, L. M. & Oke, J.B. 1998, AJ, in press
- Rakos & Schombert (1995) Rakos, K. D., & Schombert, J. M. 1995, ApJ, 439, 47
- Ramella, Pisani, & Geller (1997) Ramella, M., Pisani, A., & Geller, M. J. 1997, AJ, 113, 483
- Ratcliffe et al. (1998) Ratcliffe, A., Shanks, T., Parker, Q. A., & Fong, R. 1998, MNRAS, 293, 197
- Reid et al. (1997) Reid, I. N., Gizis, J. E., Cohen, J. G., Pahre, M. A., Hogg, D. W., Cowie, L., Hu, E., & Songaila, A. 1997, PASP, 109, 735
- Roche et al. (1996) Roche, N., Shanks, T., Metcalfe, N. & Fong, R. 1996, MNRAS, 280, 397
- Rosenberg, Salzer & Moddy, (1994) Rosenberg, J. L., Salzer, J. J. & Moody, J. W., 1994, AJ, 108, 1557
- Salzer (1989) Salzer, J. J., 1989, ApJ, 347, 152
- Sawicki & Yee (1998) Sawicki, M. & Yee, H.K.C. 1998, AJ, 115, 1329
- Schade et al. (1996) Schade, D., Carlberg, R. G., Yee, H. K. C., López–Cruz, O., & Ellingson, E. 1996a, ApJ, 465, L103
- Shectman et al. (1996) Shectman, S.A ., Landy, S. D., Oemler, A., Jr., Tucker, D. L., Lin, H. A., Kirshner, R. P., & Schechter, P. L. 1996, ApJ, 470, 172
- Smail et al. (1995) Smail, I., Hogg, D. W., Yan, L., & Cohen, J. G. 1995, ApJ, 449, L105
- Spinrad et al. (1997) Spinrad H., Dey A., Stern D., Dunlop J., Peacock J., Jimenez R. & Windhorst R. 1997, ApJ, 484, 581
- Steidel et al. (1996) Steidel, C. C., Giavalisco, M., Pettini, M., Dickinson, M., & Adelberger, K. L. 1996, ApJ, 462, L17
- Steidel et al. (1998) Steidel, C. C., Adelberger, K. L., Dickinson, M., Pettini, M. & Kellogg, M., 1998, ApJ, 492, 428
- (97) Tegmark, M. & Peebles, P. J. E. 1998, ApJ, 500, L79
- Trager et al. (1997) Trager, S.C., Faber, S.M., Dressler, A. & Oemler, A. 1997, ApJ, 485, 92
- Tresse et al. (1996) Tresse, L., Rola, C., Hammer, F.., Stasinska, G., LeFèvre, O., Lilly, S. J., & Crampton, D. 1996, MNRAS, 281, 847
- Tresse, L. & Maddox, S.J. (1998) Tresse, L. & Maddox, S.J. 1998, ApJ, 495, 691
- Van Dokkum et al. (1998) Van Dokkum, P. G., Franx, M., Kelson, D.D. & Illingworth, G.D., 1998 ApJ, in press (Astro-ph 9807242)
- Vettolani, de Souza, & Chincarini (1986) Vettolani, G., de Souza, R., & Chincarini, G. 1986, A&A, 154, 343
- Vogt et al. (1996) Vogt, N. P., Forbes, D. A., Phillips, A. C., Gronwall, C., Faber, S. M., Illingworth, G. D., & Koo, D. C. 1996, ApJ, 465, L15
- Vogt et al. (1997) Vogt, N. P., Phillips, A. C., Faber, S. M., Gallego, J., Gronwall, C., Guzmán, R., Illingworth, G. D., Koo, D. C., & Lowenthal, J. D. 1997, ApJ, 479, L121
- Williams et al. (1996) Williams, R. E., et al. 1996, AJ, 112, 1335
- Worthey (1994) Worthey, G. 1994, ApJS, 95, 107
- Zabludoff & Mulchaey (1998) Zabludoff, A. I., & Mulchaey, J. S. 1998, ApJ, 496, 39