HST Observations of the Host Galaxies of BL Lacertae Objects
Abstract
Six BL Lac objects from the complete 1 Jy radio-selected sample of 34 objects were observed in Cycle 5 with the HST WFPC2 camera to an equivalent limiting flux of mag arcsec-2. Here we report results for the second half of this sample, as well as new results for the first three objects, discussed previously by Falomo et al. (1997). In addition, we have analyzed in the same way HST images of three X-ray-selected BL Lacs observed by Jannuzi et al. (1997). The ensemble of 9 BL Lac objects spans the redshift range from to . Host galaxies are clearly detected in seven cases, while the other two, at (redshift highly uncertain) and , are not resolved. The HST images constitute a homogeneous data set with unprecedented morphological information between a few tenths of an arcsecond and several arcseconds from the nucleus, allowing us in 6 of the 7 detected host galaxies to rule out definitively a pure disk light profile. The host galaxies are luminous ellipticals with an average absolute magnitude of mag (with dispersion 0.7 mag), more than a magnitude brighter than and comparable to brightest cluster galaxies. The morphologies are generally smooth and have small ellipticities (). Given such roundness, there is no obvious alignment with the more linear radio structures. In the six cases for which we have HST WFPC2 images in two filters, the derived color profiles show no strong spatial gradients and are as expected for K-corrected passively evolving elliptical galaxies. The host galaxies of the radio-selected and X-ray-selected BL Lacs for this very limited sample are comparable in both morphology and luminosity.
Subject Headings: BL Lacertae objects: individual (0814+425, 0828+493, 1221+245, 1308+326, 1407+595, 1538+149, 1823+568, 2143+070, 2254+074) — galaxies: structure — galaxies: elliptical
1 Introduction
AGN are known to lie in galaxies and indeed both galaxies and AGN have evolved similarly, in terms of number and luminosity, over cosmic time (e.g., Silk & Rees 1998). This suggests a close connection between phenomena associated with black holes and the formation and evolution of ordinary galaxies. Thus it is of considerable interest to understand the properties of AGN host galaxies themselves — their morphology/type, luminosity, color — and to explore their similarities and differences with respect to normal galaxies.
Studies of AGN host galaxies are hampered by the technical difficulty of detecting host galaxy light beneath the bright, seeing-smeared AGN light. The order of magnitude improvement in spatial resolution possible with the Hubble Space Telescope (HST) has made an important difference, providing unique and critical information at subarcsecond scales. HST images provide more detailed information on nearby galaxies, such as the ability to distinguish between elliptical and disk light distributions, and allow more distant host galaxies to be resolved for the first time.
Other HST programs have focused largely on quasars, many at (Bahcall et al. 1997; Disney et al. 1995; McLeod & Rieke 1995; Hooper, Impey & Foltz 1997) and also a number at higher redshift, , with more recent observations filling in the range from to (Best, Longair & Röttgering 1997; Ridgeway & Stockton 1997; Serjeant, Rawlings & Lacy 1997). These include both radio-loud and radio-quiet quasars. A number of radio galaxies have also been observed with HST (McCarthy et al. 1997). The origin of the radio-loudness distinction is still unclear — it could be due to internal properties or to environmental influences or even to selection effects (Blandford 1990, Wilson & Colbert 1995, Smith et al. 1986, Perlman et al. 1998). We have chosen to concentrate on radio-loud AGN, which seem less affected by dense gaseous environments. These are increasingly well understood as a unified family of black-hole-powered AGN with powerful relativistic jets, with subclasses related through orientation and luminosity (Urry & Padovani 1995; Sambruna, Maraschi & Urry 1996; Fossati et al. 1997).
Our HST program111Based on observations made with the NASA/ESA Hubble Space Telescope, obtained at the Space Telescope Science Institute, which is operated by the Association of Universities for Research in Astronomy, Inc., under NASA contract NAS 5-26555. targeted radio-loud AGN with intrinsically lower power radio jets, typical of the Fanaroff-Riley type I radio galaxies, so as to explore the interplay of AGN luminosity and host galaxy properties. According to unified schemes, the aligned version of low-luminosity (FR I-type) radio galaxies are BL Lac objects, while quasars are the aligned version of high-luminosity (FR II-type) radio galaxies (Urry & Padovani 1995). Because of their orientation, BL Lac radiation is beamed toward us, so they can be found easily to much higher redshifts than even quite luminous radio galaxies. Thus our HST observations of BL Lac objects extend host galaxy studies significantly in the plane.
Results for three objects from our Cycle 5 sample of radio-selected BL Lacs were reported previously by Falomo et al. 1997 (hereafter Paper I). Here we report the results for the remaining three objects and give some new results for the first three. We also present a uniform analysis of the HST images of the three X-ray-selected BL Lacs discussed by Jannuzi et al. (1997).
The present sample of 9 objects represents the best data available for BL Lacs with redshifts (i.e., 5 of the present sample of 9 objects, including 4 LBL and 1 HBL).222As is the case for many BL Lac objects, the redshifts of 5 of our 9 targets are somewhat uncertain. For 0814+425, the reported redshift is almost certainly not correct. It is based on weak detection of Mg II and [O II] emission lines (Wills & Wills 1976) which were not seen in a second spectrum by the same authors or in independent published spectra (Dunlop et al. 1989; Stickel, Fried & Kühr 1993). Most recently Lawrence et al. (1996) obtained a very high signal-to-noise spectrum, which shows three weak features at either or 1.25, but in any case not at . The other redshifts are more likely correct but still not firm. The values for 1538+149 (; Stickel et al. 1993) and 1823+568 (; Lawrence et al. 1986) are based on identification of two weak emission lines as Mg II and [O II], and for 0828+493 () a single emission line was identified as O II (Stickel et al. 1993). Finally, the redshift of 1221+245 (; Stocke et al. 1991) depends on Ca II and Mgb features that are of marginal significance and do not line up perfectly (Morris et al. 1991). We concentrate here on the issue of host galaxies as observed with HST. The environments of all 9 BL Lac objects, including the presence (and in some cases, colors) of close companions, will be reported in a separate paper (Pesce et al., in preparation). The observations and data analysis are described in § 2 and the results for individual objects in § 3, along with comparisons to previous measurements of the host galaxy where appropriate. The implications are discussed and conclusions summarized in § 4. Throughout the paper we used H0 = 50 km s-1 kpc-1 and q.
2 Observations and Data Analysis
2.1 The Observed BL Lac Samples
Current samples of BL Lacertae can be divided empirically into two types, “red” or “blue”, depending on their spectral energy distributions. The “red” or low-frequency-peaked BL Lacs (LBL) have peak synchrotron powers at infrared-optical wavelengths and have been found in radio-selected surveys. The “blue” or high-frequency-peaked BL Lacs (HBL) peak at UV-X-ray wavelengths and dominate current X-ray-selected samples. (There is probably a continuous distribution of synchrotron peaks between the IR and X-ray but current selection techniques emphasize the extreme ends of the distribution; Laurent-Muehleisen 1997.) There are significant trends in spectral shape with luminosity, with the “red” objects being systematically higher in luminosity than the “blue” (Sambruna et al. 1996, Fossati et al. 1997). Clearly the range of spectra results from range in jet physics (Ulrich et al. 1997) and therefore represents an interesting diversity of AGN energetics.
Since the “blue” objects in current samples have lower redshifts and so can be relatively well-studied from the ground, our Cycle 5 HST project focused on the higher redshift “red” objects. The targets were taken from the complete 1 Jy sample of 34 BL Lac objects by Stickel et al. (1991) after restricting the redshift range to , since nearer objects are easily resolved from the ground, and to , to ensure detections or useful limits for the host galaxies in 2-orbit exposures.
A similar program in the same Cycle (PI, Buell Jannuzi) observed three “blue” BL Lac objects (HBL), two at and one (Jannuzi et al. 1997, hereafter J97). We included these in our analysis in order to look for systematic differences in the host galaxy properties. The comparison to the results from J97 also offers a useful estimate of the systematic uncertainties in determining galaxy size and luminosity.
2.2 Observations
Observations were carried out as described in Paper I and are only briefly reviewed here. All objects were observed with the HST WFPC2 camera in the F814W filter. To obtain for each target a final image well exposed both in the inner, bright nucleus and in the outer regions where the host galaxy emission dominates, we set up a series of several pairs of exposures with duration ranging from a few tens to 500-1000 seconds.
Each BL Lac object was observed for a total of two orbits, with each orbit consisting of the same run of exposure times. Between orbits, we rolled the telescope by , so that the diffraction spikes rotated relative to the sky. This technique allows us to detect easily any asymmetric emission (e.g., jets, distortions, companions) independent of contamination by the diffracted nuclear light. The dates of the HST observations, total exposure times, number of exposures, and roll angles are given in Table 1. Also reported in this Table are the HST Cycle 6 snapshot observations used to derive color profiles (Urry et al., in preparation). Finally, we include in Table 1 the estimated sky magnitude and rms uncertainty for each Cycle 5 observation, computed from source-free regions over the full PC image. The quantity therefore includes both statistical error and the contribution from large-scale fluctuations in the “sky” background (e.g., variations introduced by imperfect flat fielding).
| Object | z | (a)(a)Galactic HI column density (Stark et al. 1992), which can be translated to interstellar extinction via the relation derived for halo stars, (Shull & Van Steenberg 1985). | Date | Filter(b)(b)Pointed observations in F814W filter; snapshot observations in F702W or F606W. | Exptime | No.Exp. | Roll(c)(c)Telescope roll angle in degrees. | (d)(d)I-band surface brightness (in mag/arcsec2) of sky and rms uncertainty. Value quoted refers to the average of images at two roll angles. Sky values for F702W and F606W snapshot images are given by Urry et al. (1998). |
|---|---|---|---|---|---|---|---|---|
| (cm-2) | (sec) | (∘) | (mag/arcsec2) | |||||
| 0814+425 | (0.25?) | 4.92 | 13 Nov 95 | F814W | 1960 | 6 | 90 | |
| F814W | 1960 | 6 | 110 | |||||
| 0828+493 | 0.548 | 3.94 | 11 Feb 96 | F814W | 2060 | 6 | 330 | |
| F814W | 2060 | 6 | 310 | |||||
| 27 Feb 96 | F702W | 840 | 3 | 316 | ||||
| 1221+245 | 0.218 | 1.74 | 13 Jan 96 | F814W | 1900 | 5 | 92 | |
| 1308+326 | 0.997 | 1.08 | 04 Mar 96 | F814W | 1800 | 6 | 30 | |
| F814W | 1800 | 6 | 50 | |||||
| 1407+595 | 0.495 | 1.55 | 22 Oct 95 | F814W | 4080 | 7 | 182 | |
| 23 May 97 | F606W | 840 | 3 | 334 | ||||
| 1538+149 | 0.605 | 3.23 | 21 Mar 96 | F814W | 1670 | 6 | 100 | |
| F814W | 1670 | 6 | 80 | |||||
| 21 May 96 | F606W | 440 | 4 | 355 | ||||
| 1823+568 | 0.664 | 4.20 | 02 Oct 95 | F814W | 2120 | 6 | 275 | |
| F814W | 2120 | 6 | 255 | |||||
| 30 Dec 96 | F606W | 840 | 3 | 176 | ||||
| 2143+070 | 0.237 | 4.87 | 08 Sep 95 | F814W | 850 | 7 | 303 | |
| 13 May 97 | F606W | 500 | 3 | 76 | ||||
| 2254+074 | 0.19 | 5.39 | 12 Oct 95 | F814W | 1520 | 10 | 260 | |
| F814W | 1520 | 10 | 280 | |||||
| 13 May 97 | F606W | 320 | 4 | 72 |
2.3 Data Reduction
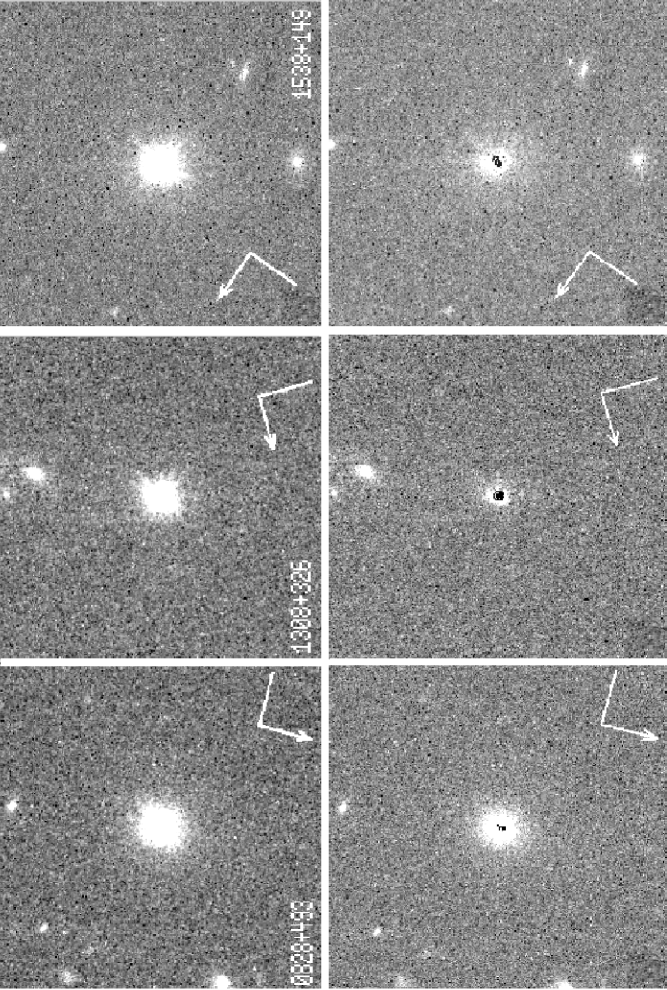
After preliminary reduction (flat–field, dark and bias subtraction, and flux calibration) carried out as part of the standard HST pipeline processing, we combined images at the two telescope roll angles as described in Paper I. The final summed images of the three new “red” BL Lac objects are shown in the upper panel of Figure 1.
The I magnitudes were calibrated using the prescription of Holtzman et al. (1995, their Eq. 8 and Table 7) for the “flight system”:
| (1) |
where is:
| (2) |
The constant 0.1 mag term corrects for the infinite aperture, and GN=2 for gain=7 (our case). The color assumed was for a redshifted elliptical galaxy, interpolated from the values in Fukugita et al. (1995). For a typical elliptical galaxy with rest-frame color , . This calibration is slightly different from that used in Paper I, where no aperture correction (0.1 mag) was applied and a fixed color () was assumed. Because the Cousins I and HST F814W filters are very similar, the dependence on color is always small; for the host galaxies detected here (), the color terms are smaller than mag. To have a complete homogeneous set of results, we report in this paper slightly revised numbers for the three objects discussed in Paper I.
In neither paper do we make reddening corrections for interstellar absorption; in all cases, the column densities are low ( cm-2; see Table 1) so the effect is small, with using the conversion cm-2 mag-1 appropriate at high latitudes (Shull & Van Steenberg 1995). For a total-to-selective extinction of , V-magnitudes for 0814+425, 2143+070, and 2254+074 could be as much as 0.3 mag larger ( mag or less for the rest); the much smaller effect in the I-band is well within our estimated systematic uncertainty of a few tenths of a magnitude (§ 3.7).
2.4 The Point Spread Function Used
To determine if an AGN host galaxy is resolved requires knowing the shape of the HST point spread function (PSF). In general, the PSF is not known precisely because it is a function of position on the CCD, filter used, epoch of observation, telescope focus (including breathing), and so on. The Tiny Tim model (Krist 1995) gives an excellent representation of the PSF shape within arcsec from the center. Outside this range, particularly in the PC chip, there is a substantial contribution due to scattered light, which is not included in the Tiny Tim model.
Since the scattered light has not been modeled analytically we derived an empirical profile from PC images of 3-5 very bright stars in each of three different filters (F814W, F702W, and F606W). The amount of scattered light is roughly constant from image to image and largely insensitive to the star position in the CCD or to the filter used (as found by Krist & Burrows 1994). Figure 2 shows the Tiny Tim and stellar PSFs for the F702W filter, for which the largest number of useful stars were available. The stellar PSF lies systematically above the Tiny Tim model beyond arcsec.

Since the PC images of stars are slightly under-sampled and often saturated (to make the faint wings of the PSF detectable), we constructed a composite PSF using the Tiny Tim model within the first 2 arcsec and the average of the observed stars at larger radii. We find that the excess flux due to scattered light (above the Tiny Tim PSF) can be represented analytically for the F814W filter by:
| (3) |
where is the integrated flux of the Tiny Tim PSF and is the distance from the center in arcsec. This extra term is clearly important for determining whether an object is resolved or not, and also in cases where the PSF wings are an appreciable fraction of the light from the galaxy (e.g., 1308+326 and 1823+568).
2.5 One-Dimensional Profile Fitting
Properties of the BL Lac host galaxies were derived both from azimuthally averaged radial profiles and from two-dimensional surface photometry (isophote fitting, § 2.7). The 1-D radial profiles were determined by averaging the flux over annuli spaced at 1-pixel intervals. The statistical error associated with the source flux in each annulus was computed from the statistical noise, read noise, sky fluctuations, and digitization noise. We then added in quadrature an estimate of the systematic uncertainty in the PSF model, assumed to be 10% of the point source contribution in that annulus. We excluded the central 0.1 arcsec to avoid the effects of undersampling, which can bias the fit strongly at the very center. In some cases we combined annuli at large radii to increase the signal-to-noise ratio.
The radial surface brightness profiles are shown in Figure 3. (Profiles of the other three radio-selected BL Lacs are given in Paper I, and are essentially unchanged by minor differences in the analysis procedure.) We fitted the data with models consisting of PSF plus galaxy, all convolved with the PSF. That is, rather than subtracting the PSF first then analyzing the galaxy light, we allowed the PSF normalization and the galaxy brightness to vary simultaneously and independently, minimizing chi-squared to find the best fit model. This avoids the a priori determination of the PSF normalization, which can introduce systematic bias in the derived galaxy luminosities.

We fitted each BL Lac profile with the PSF alone and with the PSF plus either an exponential disk or a de Vaucouleurs law. To decide whether the host galaxy was resolved we compared, via an F-test, the PSF-only and PSF-plus-galaxy fits; our threshold was that the galaxy is formally detected when the galaxy fit is better at 99% confidence (we also require this to hold when the sky is increased by ). Similarly, we evaluated which of the two galaxy models was preferred using an F-test at the same threshold.
Given that we exclude the central 0.1 arcsec, we needed to bound the fitted point source to avoid unreasonably bright values. By evaluating several unresolved sources, we determined that the point source magnitude should be no more than 0.4 mag brighter than the total flux within the first 0.3 arcsec (where the flux is always dominated by the PSF), and so this limit was imposed on the fits.
The model fits were generally good, with no systematic deviation of points from the assumed model, but chi-squared values were high. Based on similar random but excessive residuals for HST snapshot observations of BL Lac objects (Urry et al., in preparation), we conclude that chi-squared is high not because the model is a poor representation of the data but because the errors are systematically underestimated by . Therefore we multiply the statistical errors by this correction factor, following a procedure developed for IUE data (discussed extensively by Urry et al. 1993). In any case, this correction factor affects only the size of parameter errors determined from the chi-squared contours.
Results from the one-dimensional fitting are given in Table 2 and Figure 3 shows the best-fit model (solid line) for the PSF (dotted line) plus elliptical galaxy (dashed line). In general, the best-fit PSF normalizations (i.e., nuclear magnitudes) differ for the de Vaucouleurs and disk model, the derived value associated with the disk model being systematically brighter since it compensates for a relative lack of galaxy central surface brightness. Only when we can discriminate between the two galaxy models do we have an unambiguous estimate of the point source flux.
We assessed statistical uncertainties in the fit parameters from multi-dimensional chi-squared confidence contours, shown in Figure 4. Quoted in Table 2 are the 68% confidence uncertainties ( for the two parameters of interest, host galaxy magnitude and half-light radius) from the box circumscribing the contour. These represent statistical uncertainties only, while systematic errors actually dominate the uncertainty (see § 3.6). Based on analysis of simulated data, the typical uncertainty in simply measuring the host galaxy magnitude, independent of assumptions about PSF shape or normalization (which increase the total systematic error), is mag when the point source brightness is within 2 mag of the host galaxy.

For the two unresolved BL Lac objects (0814+425, 1308+326), we determined 99% confidence upper limits (statistical errors) to the host galaxy magnitudes ( for one parameter of interest, ), fixing the half-light radius at kpc, slightly larger (to be conservative) than the weighted average for the seven resolved objects.
Published values of K corrections for elliptical galaxies, whether empirical or theoretical, span a wide range of values. For example, recent determinations of B-band K corrections differ by up to 0.1 mag at and by up to mag at , the highest redshift relevant here (Kinney et al. 1996, Fukugita et al. 1995, Frei & Gunn 1994, King & Ellis 1985). Fortunately, the I-band K correction is smaller and so are the uncertainties. Our values, listed in Table 2, were obtained from convolving observed elliptical galaxy spectra (Kinney et al. 1996), redshifted appropriately, with the I-band filter response. Comparing with values summarized in Fukugita et al. (1995) and with Bruzual & Charlot (1993) models convolved with the filter response, we estimate the systematic uncertainties are mag at , mag at , and mag at .
2.6 Color Profiles of Host Galaxies
For six of the nine BL Lac objects, we have HST images in two filters (Table 1). The additional images, either in the F702W (0828+493) or F606W filter (1407+595, 1538+149, 1823+568, 2143+070, 2254+074), are from our Cycle 6 snapshot survey (Urry et al., in preparation). Although they have shorter exposure times and slightly worse signal-to-noise ratios than the pointed observations (and only one roll angle), these data provide useful color information for the host galaxies at the same high spatial resolution.
To compute the host color radial profile we first fitted the observed radial profile with a PSF-plus-de Vaucouleurs model, then subtracted the best-fit PSF model to obtain the galaxy profile in each filter. The difference is then the azimuthally averaged color profile, shown in Figure 5.

In general, there is little variation in color across the host galaxy at this spatial resolution and S/N ratio. The galaxy colors are roughly as expected (horizontal line) for redshifted emission from a passively evolving elliptical galaxy with an old stellar population (rest-frame colors , ). The only marginal deviation from the expected color is for 1538+149, which is slightly bluer than expected; however, the host galaxy of this distant source () is only marginally detected in the F606W snapshot image and therefore this result should be re-evaluated with better V-band data.
The galaxy colors are consistent with our finding that de Vaucouleurs models are generally better fits to the surface brightness profiles than disks. Determining whether there is any significant amount of recent star formation requires bluer images than we have. Based on the present data alone, the host galaxies appear dominated by old stars and show no evidence of being strongly affected by the presence of a luminous active nucleus.
2.7 Two-Dimensional Surface Photometry
We also did 2-dimensional surface photometry to probe the ellipticity, isophotal twists, and point-source centering with respect to the host galaxy. The 2-dimensional analysis was done as in Paper I, using an interactive numerical mapping package to derive isophotes (AIAP; Fasano 1994), which were fitted with ellipses down to = 25 mag arcsec-2 for each resolved object. There are four free parameters per isophote — intensity, center position, ellipticity, and position angle — which allow us to characterize the morphological and the photometric properties of the galaxy. We performed the surface photometry both on the full images and after subtraction of a PSF scaled to match the flux in an annulus from 2 to 5 pixels, where the point source dominates but effects of undersampling are reduced. The results are consistent for the outer isophotes, where the galaxy is dominant.
The derived ellipticities are in general very small, (Table 3), reflecting the obvious roundness of the images (Fig. 1) and justifying our 1-dimensional approach. Averaging over annuli maximizes the signal-to-noise ratio, allowing us to go deeper in the outer regions of the galaxy, and is computationally simpler than 2-D surface photometry, which is important for determining errors because of the many convolutions involved. The radial surface brightness profiles obtained from the 2-D analysis are in excellent agreement with those derived from the azimuthally averaged profiles taking into account the ellipticities.
We have investigated possible offsets of the galaxy isophotes, which can be indicative of recent mergers or tidal interactions. In Table 3 we give the normalized displacement , where are the centers of isophotal ellipses, is the center of the innermost PSF-subtracted isophote, and is the radial distance to the particular elliptical isophote; represents the variation of the position of the center of each isophote with respect to the innermost. A systematic trend of increasing was found for 1407+594, indicating that this galaxy may have suffered some sort of interaction in the recent past. In any case, the small displacement of isophotal centers in these host galaxies is consistent with that found in normal ellipticals (e.g., Sparks et al. 1991; see also Colina & De Juan 1995).
The comparison of the central point source position with respect to the host galaxy is relevant for the microlensing hypothesis (Ostriker & Vietri 1985). We therefore compared the point source location to the galaxy center, defined by averaging the centers of all isophotes unaffected by the central point source but bright enough to be unaffected by strong statistical errors. In all cases we can place a strong upper limit to any off-centering of less than 1 pixel ( arcsec), which argues against microlensing playing an important role in this BL Lac sample.
| Object | Ellipticity | PA(a)(a)Position angle from north toward east. | De-Center | |
|---|---|---|---|---|
| () | (arcsec) | |||
| 0828+493 | 0.1 | 170 | 0.03 | |
| 1221+245 | 0.1 | 165 | 0.03 | |
| 1407+594 | 0.1-0.2 | 30 | 0.08(b) | |
| 1538+149 | 0.1 | 120 | 0.05 | |
| 1823+568 | 0.1 | 0.05 | ||
| 2143+070 | 0.2-0.3 | 56 | 0.01 | |
| 2254+074 | 0.02(c)(c)Ellipticity = 0.1 at arcsec. | 0.02 |
3 HST Results and Comparison with Previous Analyses and Ground-Based Imaging
3.1 Properties of the BL Lac Host Galaxies
Host galaxies are detected in seven of the nine BL Lac objects. They are generally very luminous and have surface brightness profiles consistent with a de Vaucouleurs model, which is preferred over a disk model in 6 of the 7 cases (and the seventh is indeterminate). The average absolute magnitude is mag (rms dispersion). Values of point source magnitude, host galaxy magnitude, and half-light radius are given in Table 2. For comparison, the brightest ellipticals in the nearby well-studied clusters Virgo (Caon, Capaccioli & D’Onofrio 1994) and Coma (Jorgensen & Franx 1994) have similar or slightly brighter absolute magnitudes, with mag (for km s-1 Mpc-1 and typical elliptical color ).
The objects with detected host galaxies, in addition to 1823+568 and 2254+074 of Paper I, are the “red” BL Lacs 0828+493 () and 1538+149 (), and all three “blue” BL Lacs 1221+245 (), 1407+595 (), and 2143+070 (). Two radio-selected objects, 0814+425 ( or ?, Paper I) and 1308+326 () remain unresolved even at HST resolution. The images in the lower panel in Figure 1 show the three new radio-selected BL Lac objects with the best-fit point source subtracted.
Our results (Tables 2 and 3) are largely in agreement with previous surveys of BL Lac objects, which found that with a few exceptions, the host galaxies are luminous, round ellipticals (Abraham, McHardy & Crawford 1991; Stickel et al. 1993; Wurtz, Stocke & Yee 1996, hereafter WSY; Falomo 1996). Because we probe higher redshifts on average than these ground-based surveys, it is not surprising that the detected host galaxies are also more luminous on average, with I-band luminosities and sizes comparable to brightest cluster galaxies (Taylor et al. 1996; WSY) and to Fanaroff-Riley type I radio galaxies (Ledlow & Owen 1996; Urry et al., in preparation; cf. WSY). Like WSY, we see no significant difference in the host galaxies of “red” or “blue” BL Lacs, although the present sample is quite small.
The colors of the host galaxies are typical of the old stellar populations in ellipticals (Fukugita et al 1995; Bressan et al. 1994). Figure 6 shows the observed colors of the five host galaxies with HST images in both the F606W and F814W filters. A sixth galaxy observed in F702W and F814W is also plotted (triangle) assuming mag (valid for an elliptical at z=0.5; Fukugita et al. 1995). Redder and/or bluer images would greatly improve our constraints on the stellar populations; in particular, we have no constraints on very recent star formation from these red images.

Below we discuss individual objects in more detail.
3.2 0828+493 (z=0.548)
The host galaxy is clearly detected in the HST image and is well centered on the point source. The nebulosity shows slightly elongated isophotes, with and P.A. (E of N). The luminosity profile is significantly better fitted by a de Vaucouleurs law than by an exponential disk. The best-fit host galaxy has a K corrected absolute I-band magnitude of mag and a half-light radius of kpc. The color profile of 0828+493 (Fig. 5) is basically flat and consistent with the expected color of an elliptical galaxy at this redshift, mag.
The host galaxy was marginally resolved from the ground by WSY, who report for a de Vaucouleurs law fit a galaxy magnitude (Gunn system) of mag, which corresponds to mag,333We assume an intrinsic color , a value that is correct to within 0.1 mag at all redshifts considered here (Fukugita et al. 1995). fully consistent with our determination, as is their half-light radius, arcsec (compared to arcsec). The WSY data were insufficient to distinguish between an exponential disk or de Vaucouleurs profile.
3.3 1308+326 (z=0.997)
The host galaxy of this high redshift object is not resolved in our WFPC2 image even though Stickel et al. (1993) reported detection of extended isophotes in a ground-based R-band image, specifically from radii to arcsec, at surface brightnesses from -29 mag arcsec-2 (Stickel 1990). The total integration time for the HST I-band image is three times that of the Stickel et al. R-band image, and we also have a deeper R-band image taken with the NOT in 0.8-arcsec seeing (Falomo et al. 1996). We do detect clearly the galaxy Stickel et al. saw arcsec to the southwest but no significant extension in the outer isophotes. Any nebulosity surrounding the BL Lac nucleus must be fainter than mag arcsec-2, and the host galaxy fainter than mag, or mag. Due to its high redshift, this object has been suggested as a case of microlensing by stars in a foreground galaxy.
3.4 1538+149 (z=0.605)
The host galaxy of this object is resolved with HST but the surface brightness is low and it is the only one of the seven for which we can not uniquely determine its morphology. The luminosity profile is equally well fitted with an exponential disk or a de Vaucouleurs law. For a de Vaucouleurs model, the galaxy has mag and kpc (with large uncertainties), indicating the host is both large and luminous. The color profile (Fig. 5) is essentially flat and roughly consistent with the expected color, , of an aging elliptical galaxy at this redshift. The galaxy is relatively round, with ellipticity , and well centered on the point source.
There are several faint galaxies within 50 kpc of the BL Lac. Based on their sizes and magnitudes, these are consistent with galaxies at the redshift of the BL Lac object. Unfortunately, we are unable to determine their colors since they are not visible in the shorter F702W snapshot observation.
This BL Lac object was marginally resolved by WSY, who reported a galaxy magnitude of mag, corresponding to mag, 2.5 sigma brighter than our best fit. Their half-light radius, arcsec, is consistent with ours within the uncertainties.
3.5 Reanalysis of HST Data for 0814+425, 1823+568, and 2254+074
We have reanalyzed the three sources reported in Paper I (0814+425, 1823+568, 2254+074), using the modified PSF and flux calibration. This yields consistent results for 0814+425 and 2254+074 when the slight offset (0.1 mag) in the zero point of the calibration (Eq. 2) is taken into account. For 1823+568, the revised host galaxy magnitude is 0.5 mag fainter than previously reported, primarily due to the new PSF adopted (also to slightly modified sky background, calibration, and fitting procedure). This galaxy was detected well above the PSF, suggesting that the effect on the derived magnitude could be much larger for fainter host galaxies. Comparisons to other measurements of these three BL Lac objects were given in Paper I.
3.6 Reanalysis of HST Data for X-Ray Selected BL Lacs (1221+245, 1407+595, 2143+070)
We retrieved from the HST archive the WFPC2 images of 1221+245, 1407+595, and 2143+070, three “blue” BL Lac objects from the Cycle 5 program of J97. Their observations and ours were designed to be similar in filter and depth so that the two data sets could be compared easily. J97 used a different flux calibration and followed a different analysis procedure, first subtracting the PSF with a normalization value based on visual inspection of the residuals, and then fitting the residual light with a galaxy model. In our analysis, the two components (PSF and galaxy) are fitted simultaneously.
The results reported here (Table 2) differ slightly from those given by J97. In all cases we confirm that the host is clearly resolved and that a disk model for the host is ruled out but the values for the galaxy magnitudes are in two cases slightly discrepant. These differences stem from slightly different analysis procedures; because neither approach can be deemed better than the other, this allows us to estimate the systematic uncertainty in the reported values.
For 2143+070 the agreement is excellent: our values are mag and arcsec, compared to and arcsec from J97. However, for 1407+595 we found mag and arcsec, compared to mag and arcsec; the difference of mag is well outside our estimated statistical uncertainty.
For 1221+245 the difference is even larger: we obtained mag and arcsec while J97 found and arcsec, a difference of mag. In this case we note that the best-fit galaxy reported by J97 appears to be systematically brighter than the observed data points after subtraction of the PSF. This, together with the presence of a residual PSF modulation in the PSF-subtracted profile (see their Fig. 5), suggest that their galaxy luminosity is slightly overestimated. This object was also marginally resolved by WSY from the ground; using a procedure similar to ours they found mag, corresponding to mag, a value consistent with ours.
Larger discrepancies are found between the derived magnitudes of the point sources, with our values being systematically brighter (by 0.4 to 0.9 mag) than those reported by J97. This is due in part to our excluding the central 0.1 arcsec, so that our constraints are weaker and the associated uncertainties larger (Table 2). (We deliberately use loose constraints on the fitted PSF because the model is not perfect.) Also, the point sources in these objects are weak compared to the galaxy, much more so than for the “red” BL Lac objects, so one would expect relatively larger uncertainties in their measured magnitudes.
3.7 Systematic Errors
The above comparison indicates that measurements of the host galaxy magnitudes can be uncertain by 0.2-0.3 mag, even for bright, easily detected elliptical galaxies like 1221+245. One obvious source of systematic error is uncertainty in the PSF, which we incorporated in the statistical error in an ad hoc way (§ 2.5). It is this uncertainty, combined with variations in how the PSF normalization is estimated and how PSF wings are described, that leads to the systematic discrepancies of up to mag in the fitted host galaxy magnitudes described in the previous two sections.
Another source of systematic error is the uncertainty in the sky background, which affects the surface brightness profile most strongly in the outer regions of the host galaxy. This is usually not critical, as the profile is not weighted heavily there and the signal is averaged over a large area, repressing all but the largest scale fluctuations. When the galaxy is only marginally resolved, however, the sky fluctuation can be a much more significant source of error. Overestimating the sky by 0.5 can change the derived host galaxy magnitude by up to +0.2 mag and reduce the half-light radius by 0.4 arcsec; underestimating by has a larger effect, changing by up to -0.4 mag and increasing the half-light radius by up to 2 arcsec. Under-subtracting the background, however, leaves a characteristic signature whereby the outer radial surface brightness profile is parallel to the sky level, so we are unlikely to have made an error of this magnitude.
In addition, conversion to absolute magnitude introduces a systematic error because the K correction is not precisely known. The K corrections in the literature vary widely; for elliptical galaxies, published B-band values differ by 0.1 mag at and as much as 0.5 mag at (§ 2.5). The range of values for spiral galaxies is even larger. The difference between the K corrections for E-type and Sb-type spectra is of course still larger (as much as 2 mag at ). Even if the adopted galaxy type is correct, published values of absolute magnitudes of host galaxies can differ because different K corrections were applied. We used the best available data for elliptical galaxy spectra (Kinney et al. 1996) and estimated uncertainties by comparing to a widely used recent model (Bruzual & Charlot 1993). The K corrections we used are given in Table 2.
Finally, even starting from the same HST data, derived galaxy properties in the literature can differ mainly because of different fitting assumptions, but also because of different calibrations, different aperture sizes for photometry, as well as the usual differences in cosmology. It is not trivial to compare final absolute magnitudes of host galaxies from different authors.
4 Discussion and Conclusions
We have shown that with HST it is easy to detect and characterize the host galaxies of low-luminosity AGN like BL Lac objects up to moderately high redshifts, . We detected host galaxies in seven of the nine BL Lac objects in our combined sample, including the highest redshift and most luminous host galaxy ever detected in a BL Lac object (1823+568 at ). Our measurements of the host galaxies of three more BL Lac objects at redshifts give improved estimates of their luminosities and surface brightness profiles compared to previous ground-based measurements by WSY (one of which, 1538+149, was a marginal detection).
The detected host galaxies are luminous ellipticals. Their average K corrected absolute magnitude is mag, more than 1 mag brighter than mag (Mobasher, Sharples & Ellis 1993). This is the same as for brightest cluster galaxies ( mag; Thuan & Puschell 1989) and for Fanaroff-Riley type I radio galaxies (Ledlow & Owen 1996), which are often found in moderate to rich cluster environments. Indeed, the extended (unbeamed) radio luminosities of BL Lac objects (Urry & Padovani 1995), combined with their luminous host galaxies, strongly support the unification picture with FR I galaxies constituting the parent population. Further refinement of this picture is possible from consideration of the larger environments of the BL Lacs (Stickel et al. 1993; Falomo, Pesce, & Treves 1993, 1995; Pesce, Falomo, & Treves 1994, 1995; Smith, O’Dea & Baum 1995; Wurtz et al. 1997).
As well as being luminous, the host galaxies of BL Lac objects are large. We have too few objects for a quantitative comparison with samples of radio galaxies, quasars, or cluster ellipticals, but qualitatively the half-light radii are comparable to those of brightest cluster galaxies and are consistent with the larger, lower surface brightness end of the - projection of the fundamental plane (Djorgovski & Davis 1987, Hamabe & Kormendy 1987).
In 6 of the 7 BL Lac host galaxies, the de Vaucouleurs model gives a significantly better fit to the surface brightness profile than an exponential disk model. (In the seventh, both fits are good and neither is preferred.) Similarly, the colors are as expected for passively evolving elliptical galaxies with old stellar populations at the appropriate redshift. To see signs of recent star formation, however, requires bluer images than we currently have.
Although our sample is small, we see no differences between the host galaxies of “red” and “blue” BL Lac objects. The “red” objects, which have systematically higher bolometric luminosities, may be redder because the highest energy electrons cool quickly by scattering ambient UV and X-ray photons to gamma-ray energies (Ghisellini et al. 1998). The “blue” objects have less luminous nuclei and jets with lower kinetic powers (Celotti, Padovani & Ghisellini 1997). These two classes of BL Lac object therefore reflect two different kinds of jets (probably extrema of a continuous distribution), which in turn indicates different jet formation and/or evolution. Our results on the host galaxies (see also WSY) suggest that nuclear properties, which can strongly influence jet formation and propagation, do not have a dramatic effect on the host galaxy (or vice-versa).
With the high spatial resolution of HST, we are able to place tight limits on any de-centering of the BL Lac nucleus. If any of our BL Lac objects were actually background quasars microlensed by stars in a foreground galaxy (which we are calling the host galaxy), there could well be an offset between the position of the nucleus (the amplified background quasar) and the lensing galaxy. Instead, the nuclei are well-centered in the host galaxy, with deviations typically less than 0.03 arcsec. For the “blue” BL Lac object 1407+595, the nucleus is also well centered with respect to the inner isophotes, but the galaxy isophotes shift in a way seen in many elliptical galaxies, possibly indicating an interaction or merger (Sparks et al. 1991, Colina & De Juan 1995).
The present sample of nine well-studied BL Lac objects indicates the clear trends described above:
-
1.
The host galaxies of BL Lac objects out to are well resolved and characterized with HST.
-
2.
Elliptical galaxy profiles are strongly preferred to disk profiles, and the colors are consistent with aging stellar populations.
-
3.
The galaxies are large, round, and roughly one magnitude more luminous than .
-
4.
There is no significant difference between the host galaxies of “red” and “blue” BL Lac objects, despite their significantly different radio jets.
-
5.
We do not detect the de-centering signature expected if BL Lac objects are background quasars microlensed by stars in the “host” (actually, foreground) galaxy.
We can establish these trends for the BL Lac class with the larger samples now available. More than 100 BL Lac objects have been observed with HST in our Cycle 6 snapshot program, albeit to less depth, and host galaxies have been detected in more than half, including nearly 90% of those with redshifts (Urry et al., in preparation). Comparing to radio galaxies over a similar redshift range, we can investigate unified schemes. Should they be confirmed, properties of the BL Lac host galaxies and near environments are basically universal to all low-luminosity radio-loud AGN. We can then explore the larger sample of all radio-loud AGN for trends in luminosity and redshift.
References
- (1)
- (2) Abraham, R. G., Crawford, C. S., & McHardy, I. M. 1992, ApJ, 401, 474
- (3) Bahcall, J. N., Kirhakos, S., Saxe, D. H., & Schneider, D. P. 1997, ApJ, 479, 642
- (4) Best, P. N., Longair, M. S., & Röttgering, H. J. A. 1997, MNRAS, 292, 758
- (5) Blandford, R. D. 1990, in Active Galactic Nuclei, ed. T. J.-L. Courvoisier, M. Mayor (Saas-Fee Advanced Course 20) (Berlin, Springer), p. 161
- (6) Bressan A., Chiosi C. & Fagotto F. 1994, ApJS, 94,63
- (7) Bruzual, G., & Charlot, S. 1993, ApJ, 405, 538
- (8) Caon, N., Capaccioli, M., & D’Onofrio, M. 1994, A&AS, 106, 199
- (9) Celotti, A., Padovani, P., & Ghisellini, G. 1997, MNRAS, 286, 415
- (10) Colina, L., & De Juan, L. 1995, ApJ, 448, 548
- (11) Disney, M. J., et al. 1995, Nature 376, 150
- (12) Djorgovski, S., & Davis, M. 1987 ApJ, 313, 59
- (13) Dunlop, J. S., Peacock, J. A., Savage, A., Lilly, S. J., Heasley, J. N., Simon, A. J. B. 1989, MNRAS, 238, 1171
- (14) Falomo, R. 1996, MNRAS, 283, 241
- (15) Falomo, R., Pesce, J. E., & Treves, A. 1993, ApJ, 411, L63
- (16) Falomo, R., Pesce, J. E., & Treves, A. 1995, ApJ, 438, L9
- (17) Falomo, R., Scarpa, R., Pesce, J. E., Urry, C. M. & Treves, A. 1995, in Science with the Hubble Space Telescope - II, eds. P. Benvenuti, F. D. Macchetto & E. J. Schreier (Baltimore: STScI), p. 226
- (18) Falomo, R., Urry, C. M., Pesce, J. E., Scarpa, R., Giavalisco, M., & Treves, A. 1997, ApJ, 476, 113
- (19) Fasano, G., 1994, Padova Observatory Internal Report
- (20) Fossati, G., Celotti, A., Ghisellini, G., & Maraschi, L. 1997, MNRAS, 289, 136
- (21) Frei, Z., & Gunn, J. E. 1994, AJ, 108, 1476
- (22) Fukugita, M., Shimasaku, K., & Ichikawa, T. 1995, PASP, 107, 945
- (23) Ghisellini, G., et al. 1998, in preparation
- (24) Hamabe, M., & Kormendy, J., 1987, in Structure and Dynamics of Elliptical Galaxies (IAU Symposium 127), ed. P. T. de Zeeuw (Dordrecht: Klüwer), p. 379
- (25) Holtzman, J. A., Burrows, C. J., Casertano, S., Hester, J. J., Trauger, J. T., Watson, A. M., & Worthey, G. 1995, PASP, 107, 1065
- (26) Hooper, E. J., Impey, C. D., & Foltz, C. B. 1997, ApJ, 480, L95
- (27) Jannuzi, B., et al. 1997, ApJ, 491, 146
- (28) Jorgensen, I., & Franx, M. 1994, ApJ, 433, 553
- (29) King, C. R., & Ellis, R. S. 1985, ApJ, 288, 456
- (30) Kinney, A., Calzetti, D., Bohlin, R. C., McQuade, K., Storchi-Bergmann, T., & Schmitt, H. R. 1996, ApJ, 467, 38
- (31) Krist, J. 1995, in Astronomical Data Analysis, Software and Systems IV, eds. R. Shaw et al., (San Francisco: Astr. Soc. Pac.), p. 349
- (32) Krist, J., & Burrows, C. 1994, STScI Instrument Science Report 94-01
- (33) Laurent-Muehleisen, S. A. 1997, PASP, 109, 341
- (34) Lawrence, C. R., Pearson, T. J., Readhead, A. C. S., & Unwin, S. C. 1986, AJ, 91, 494
- (35) Ledlow, M. J., & Owen, F. N. 1996, AJ, 112, 9
- (36) McCarthy, P. J., et al. 1997, ApJS, 112, 415
- (37) McLeod, K. K., & Rieke, G. H. 1995, ApJ, 454, L77
- (38) Mobasher, B., Sharples, R. M. & Ellis, R. S. 1993, MNRAS 263, 560
- (39) Morris, S. L., Stocke, J. T., gioia, I. M., Schild, R. E., Wolter, A., Maccacaro, T., & Della Ceca, R. 1991, ApJ, 380, 49
- (40) Ostriker, J. P., & Vietri, M. 1985, Nature, 318, 446
- (41) Perlman, E. S., Padovani, P., Giommi, P. Sambruna, R., Jones, L. R., Tzioumis, A., & Reynolds, J. 1998, AJ, 166, in press
- (42) Pesce. J. E., Falomo, R., & Treves, A. 1994, AJ, 107, 494
- (43) Pesce. J. E., Falomo, R., & Treves, A. 1995, AJ, 110, 1554
- (44) Ridgeway, S. E., & Stockton, A. 1997, AJ, 114, 511
- (45) Sambruna, R. M., Maraschi, L., & Urry, C. M. 1996, ApJ, 463, 444
- (46) Serjeant, S., Rawlings, S., & Lacy, M. 1997, in Quasar Hosts, eds. D. L. Clements & J. Perez-Fournon, (New York: Springer-Verlag), p. 188
- (47) Shull, J. M., & Van Steenberg, M. E. 1995, ApJ, 294, 599
- (48) Silk, J., & Rees, M. J. 1998, A&A, 331, L1
- (49) Smith, E. P., Heckman, T. M., Bothun, G. D., Romanishin, W., and Balick, B. 1986, ApJ, 306, 64
- (50) Smith, E. P., O’Dea, C., & Baum, S. A., 1995, ApJ, 441, 113
- (51) Sparks, W. B., Wall, J. V., Jorden, P. R., Thorne, D. J., & van Breda, I. 1991, ApJS, 76, 471
- (52) Stark, A. A., et al. 1992, ApJS, 79, 77
- (53) Stickel, M. 1990, in Variability in Active Galaxies, ed. W. J. Duschl, S. J. Wagner & M. Camenzind (Berlin: Springer-Verlag), p. 303
- (54) Stickel, M., Fried, J. W., & Kühr, H. 1993, A&AS, 98, 393
- (55) Stickel, M., Fried, J. W., Kühr, H., Padovani, P., & Urry, C. M. 1991, ApJ, 374, 431
- (56) Stocke, J. T., Morris, S. L., Gioia, I. M., Maccacaro, T., Schild, R., Wolter, A., Fleming, T. A., & Henry, J. P. 1991, ApJS, 76, 813
- (57) Taylor, G. L., Dunlop, J. S., Hughes, D. H., & Robson, E. I. 1996, MNRAS, 283, 930
- (58) Thuan, T. X. & Paschell, J. J. 1989, ApJ, 346, 34
- (59) Ulrich, M.-H., Maraschi, L., & Urry, C. M. 1997, ARAA, 35, 445
- (60) Urry, C. M., & Padovani, P. 1995, PASP, 107, 803
- (61) Urry, C. M., et al. 1993, ApJ, 411, 614
- (62) Urry, C. M., et al. 1998, in preparation
- (63) Wills & Wills 1976, ApJS, 31, 143
- (64) Wilson, A. S., and Colbert, E. J. M. 1995, ApJ, 438, 62
- (65) Wurtz, R., Stocke, J. T., Ellingson, E., & Yee, H. K. C. 1997, ApJ, 480, 547
- (66) Wurtz, R., Stocke, J. T., & Yee, H. K. C. 1996, ApJS, 103, 109 (WSY)
- (67)
![[Uncaptioned image]](/html/astro-ph/9809060/assets/x7.png)