Radiative Transfer in a Clumpy Universe: III. The Nature of Cosmological Ionizing Sources
Abstract
The history of the transition from a neutral intergalactic medium (IGM) to one that is almost fully ionized can reveal the character of cosmological ionizing sources. We study the evolution of the volume filling factors of H and He regions in a clumpy IGM, and discuss the implications for rival reionization scenarios of the rapid decline in the space density of radio-loud quasars and of the large population of star-forming galaxies recently observed at . The hydrogen component in a highly inhomogeneous universe is completely reionized when the number of photons emitted above 1 ryd in one recombination time equals the mean number of hydrogen atoms. If stellar sources are responsible for keeping the IGM ionized at , the rate of star formation at this epoch must be comparable or greater than the one inferred from optical observations of galaxies at , and the mean metallicity per baryon in the universe solar. An early generation of stars in dark matter halos with circular velocities , possibly one of the main source of UV photons at high-, could be detectable with the Next Generation Space Telescope. Models in which the quasar emissivity declines rapidly at predict a late He reionization epoch, a feature that could explain the recent detection of patchy He Lyat by Reimers et al. (1997) and the abrupt change observed by Songaila (1998) at about the same epoch of the Si /C ratio, but appear unable to provide the required number of hydrogen-ionizing photons at .
keywords:
cosmology: theory – diffuse radiation – intergalactic medium – galaxies: evolution – quasars: general1 Introduction
The existence of a filamentary, low-density intergalactic medium (IGM), which contains the bulk of the hydrogen and helium in the universe, is predicted as a product of primordial nucleosynthesis (e.g., Copi, Schramm, & Turner 1995) and of hierarchical models of gravitational instability with “cold dark matter” (CDM) (Cen et al. 1994; Zhang, Anninos, & Norman 1995; Hernquist et al. 1996). The application of the Gunn-Peterson (1965) constraint on the amount of smoothly distributed neutral material along the line of sight to distant objects requires the hydrogen component of the diffuse IGM to have been highly ionized by (Schneider, Schmidt, & Gunn 1991), and the helium component by (Davidsen, Kriss, & Zheng 1996). The plethora of discrete absorption systems which give origin to the Lyforest in the spectra of background quasars are also inferred to be strongly photoionized. It thus appears that substantial sources of ultraviolet photons were present at , perhaps low-luminosity quasars (Haiman & Loeb 1998) or a first generation of stars in virialized dark matter halos with K (Couchman & Rees 1986; Tegmark, Silk, & Blanchard 1994; Fukugita & Kawasaki 1994; Ostriker & Gnedin 1996; Ciardi & Ferrara 1997; Haiman & Loeb 1997; Miralda-Escudè & Rees 1998). Early star formation provides a possible explanation for the widespread existence of heavy elements in the IGM (Cowie et al. 1995), while reionization by QSOs may produce a detectable signal in the radio extragalactic background at meter wavelengths (Madau, Meiksin, & Rees 1997). Establishing the character of cosmological ionizing sources is an efficient way to constrain competing models for structure formation in the universe, and to study the collapse and cooling of small mass objects at early epochs. While the nature, spectrum, and intensity of the background UV flux which is responsible for maintaining the intergalactic gas and the Ly clouds in a highly ionized state at has been the subject of much debate in the last decade (e.g., Bechtold et al. 1987; Shapiro & Giroux 1987; Songaila, Cowie, & Lilly 1990; Miralda-Escudè & Ostriker 1990; Madau 1992; Sciama 1995; Haardt & Madau 1996; Giroux & Shapiro 1996), it is only in the past few years that new observations have provided reliable information on the presence and physical properties of sources and sinks (due to continuum opacities) of UV radiation in the interval .
This is the third paper in a series aimed at a detailed study of the production, absorption, and reprocessing of ionizing photons in a clumpy universe. In Paper I (Madau 1995) we showed how the stochastic attenuation produced by neutral hydrogen along the line of sight can seriously distort our view of objects at cosmological distances. In Paper II (Haardt & Madau 1996) a numerical code was developed which follows the propagation of photoionizing radiation through an IGM in which the H and He region networks have fully percolated at the redshifts of interest. It is the purpose of this paper to focus instead on the candidate sources of photoionization at early times and on the time-dependent reionization problem, i.e. on the history of the transition from a neutral IGM to one that is almost fully ionized. The primary motivation of this study can be found perhaps in the simple realization that the breakthrough epoch (when all radiation sources can see each other in the Lyman continuum) occurs much later in the universe than the overlap epoch (when individual ionized zones become simply connected and every point in space is exposed to ionizing radiation), and that at high redshifts the ionization equilibrium is actually determined by the instantaneous UV production rate. The fact that the IGM is still optically thick at overlapping, coupled to recent observations of a rapid decline in the space density of radio-loud quasars and of a large population of star-forming galaxies at , will have some interesting implications for rival ionization scenarios.
Throughout this paper we will adopt an Einstein-de Sitter universe () with .
2 The Universe After Complete Overlapping
The complete reionization of the universe manifests itself in the absence of a Gunn-Peterson absorption trough in the spectra of galaxies and quasars at . In the presence of a uniform medium of H density along the path to a distant object, the optical depth associated with resonant Lyscattering at is
| (1) |
where is the Hubble constant, is the oscillator strength of the transition, and all other symbols have their usual meaning. The same expression for the opacity is also valid in the case of optically thin (to Lyscattering) discrete clouds as long as is replaced with the average neutral density of individual clouds times their volume filling factor. The strongest limit on the amount of diffuse intergalactic neutral hydrogen at is provided by a direct measurement of the quasar Q1202–0725 flux in regions of the spectrum where lines are absent (Giallongo et al. 1994): a best estimate of is found. Even if 99% of all the cosmic baryons fragment at these epochs into structures that can be identified with QSO absorption systems, with only 1% remaining in a smoothly distributed component (cf. Zhang et al. 1998), the implication is a diffuse IGM which is ionized to better than 1 part in . Except at the highest column densities, discrete absorbers are also inferred to be strongly photoionized. From QSO absorption studies we also know that neutral hydrogen accounts for only a small fraction, , of the nucleosynthetic baryons at early epochs (e.g. Lanzetta, Wolfe, & Turnshek 1995).
In this section we shall discuss the last stage of the reionization process, when individual ionized zones have overlapped, the reionization of hydrogen (and helium) in the universe has been completed, and the IGM has been exposed everywhere to Lyman continuum photons. An often overlooked point is worth remarking here, namely the fact that even if the bulk of the baryons in the universe are fairly well ionized at , the residual neutral hydrogen still present in the Ly forest clouds and the Lyman-limit systems (LLS) along the line of sight significantly attenuates the ionizing flux from cosmologically distant sources. In other words, while the complete overlapping of I-fronts occurs at , the universe does not become optically thin to Lyman continuum photons until much later, at a “breakthrough” redshift (see § 2.3). It is only after breakthrough that every point in space at any redshift will be exposed to ionizing photons from all radiation sources out to .
2.1 Cosmological Radiative Transfer
The radiative transfer equation in cosmology describes the time evolution of the specific intensity of a diffuse radiation field (e.g., Peebles 1993):
| (2) |
where is the scale parameter, the speed of the light, the continuum absorption coefficient per unit length along the line of sight, and is the proper space-averaged volume emissivity. The mean specific intensity of the radiation background at the observed frequency , as seen by an observer at redshift , is then
| (3) |
where , and is the line element in a Friedmann cosmology. The effective optical depth due to discrete absorption systems is defined, for Poisson-distributed clouds, as
| (4) |
(Paresce, McKee, & Bowyer 1980), where is the redshift and column density distribution of absorbers along the line of sight, and is the Lyman continuum optical depth through an individual cloud.
2.2 Intervening Absorption
The actual distribution of intervening clouds is still quite uncertain, especially in the range , where most of the contribution to the effective photoelectric opacity actually occurs. As a function of H column, a single power-law with slope appears to provide a surprisingly good description over nearly 10 decades in (Hu et al. 1995; Petitjean et al. 1993; Tytler 1987). In a recent analysis of the density distribution by redshift interval, Kim et al. (1997) have used high resolution, high S/N Keck spectra to show that the deficit of lines (relative to this fit) noted by Petitjean et al. above , while more pronounced at lower redshifts, tends to disappear (or moves to columns higher than ) at . At high redshift, it is then a good approximation to use for the distribution of absorbers along the line of sight:
| (5) |
While it has been assumed in the past that the Ly forest clouds and LLS evolve at different rates (hence that there is an actual mismatch around in the adopted function), recent determinations have derived a value of for the LLS (Stengler-Larrea et al. 1995), consistent within the errors with obtained by Press & Rybicki (1993), by Bechtold (1994), and by Kim et al. (1997) for the Ly forest line. For simplicity, we will assume here a single redshift exponent, , for the entire range in column densities. A normalization value of produces about 3 LLS per unit redshift at , as observed by Stengler-Larrea et al. (1995), and, at the same epoch, lines above , in good agreement with the estimates of Kim et al. (1997). With this normalization and , the adopted distribution provides about the same H photoelectic opacity as in the model discussed in Paper II, but underpredicts the attenuation of quasar continua due to Lyline blanketing (cf Paper I).
2.3 Attenuation Length
If we extrapolate the power-law in equation (5) to very small and large columns, the effective optical depth becomes an analytical function of redshift and wavelength,
| (6) |
where is the hydrogen photoionization cross-section at the Lyman edge , and we have not included the contribution of helium to the attenuation along the line of sight. [While the opacity due to He is negligible in the case of a QSO-dominated background, He absorption on the way must be included for .]
It is practical, for the present discussion, to define a redshift such that the effective optical depth between and is unity. When , a photon emitted at with frequency will be redshifted below threshold before being significantly attenuated by intervening H . From equation (6) it can be shown that the universe will be optically thin below
| (7) |
This expression gives for and for . It has a minimum for , corresponding to what we shall term in the following the “breakthrough epoch” of the universe, . For , all radiation sources will be able to see each other in the hydrogen Lyman continuum. Hence, it is only at that the degree of ionization of the IGM will be determined by the balance between radiative recombinations and the total ionizing flux emitted (say) by all QSOs which appear after .
By contrast, due to the rapid increase with lookback time of the number of absorbers, the mean free path of photons at Å becomes so small beyond a redshift of 2 that the radiation is largely “local”, as sources at higher redshifts are severely attenuated. Expanding equation (6) around , for example, one gets for . This corresponds to a proper distance or “absorption length” of only
| (8) |
shorter than the mean free path between the rarer LLS because of the additional absorption from the numerous Lyforest clouds.111As filtering through a clumpy IGM significantly steepens the UV background spectrum (Miralda-Escudè & Ostriker 1990; Madau 1992), the absorption length at the He edge is smaller than at 1 ryd, . The small absorption length is mostly due to systems with continuum optical depth around unity. In the local (or “source-function”) solution to the equation of radiative transfer, this strong attenuation effect can be approximated by simply ignoring sources with and neglecting absorption for those sources with . Since only radiation sources within the volume defined by an absorption length contribute then to the background intensity shortward of the Lyman edge, cosmological effects such as source evolution and frequency shifts can be neglected, and it is possible to write . In this approximation the number of ionizing photons per unit proper volume present at redshift is given by
| (9) |
where , and is an average over the incident photon spectrum.222Since , one has , where , , and we have assumed a cutoff at 4 ryd because of He absorption. A spectrum with yields . From the equation of ionization equilibrium, , an approximate relation can be derived between the absorption length and the volume-averaged gas recombination time if all absorbers are optically thin, highly ionized in both H and He, and contain most of the baryons of the universe,
| (10) |
where is the mean hydrogen density of the expanding IGM, ,
| (11) |
is the recombination coefficient to the excited states of hydrogen, the helium to hydrogen cosmic abundance ratio, is the ionized hydrogen clumping factor, 333This may be somewhat lower than the total gas clumping factor if higher density regions are less ionized (Gnedin & Ostriker 1997). and a gas temperature of K has been assumed. Clumps which are dense and thick enough to be self-shielded from UV radiation will stay neutral and will not contribute to the recombination rate. An empirical determination of the clumpiness of the IGM at high redshifts is hampered by our poor knowledge of the ionizing background intensity and the typical size and geometry of the absorbers. Numerical N-body/hydrodynamics simulations of structure formation in the IGM within the framework of CDM dominated cosmologies (Cen et al. 1994; Zhang et al. 1995; Hernquist et al. 1996) have recently provided a definite picture for the origin of intervening absorption systems, one of an interconnected network of sheets and filaments, with virialized systems located at their points of intersection. In the simulations of Gnedin & Ostriker (1997), for example, the clumping factor rises above unity when the collapsed fraction of baryons becomes non negligible, i.e. , and grows to (40) at (5) (because of finite resolution effects, numerical simulations will actually underestimate clumping): the recombination timescale is much shorter than that for a uniform IGM, and always shorter than the expansion time.
2.4 Sources of Ionizing Radiation at High Redshifts
2.4.1 The Quasar Cutoff
The existence of a decline in the space density of bright quasars at redshifts beyond was first suggested by Osmer (1982), and has been since then the subject of a long-standing debate. In recent years, several optical surveys have consistently provided new evidence for a turnover in the QSO counts. The six-band multicolor survey of Warren, Hewett, & Osmer (1994, hereafter WHO) shows a drop by a factor of beyond . A decline by a factor of 2.7 per unit redshift in the range is seen for by the Schmidt, Schneider, & Gunn (1995) grism survey. Kennefick, Djorgovski, & de Carvalho (1995, hereafter KDC) found a decrease in the space density of QSOs with by a factor of from to , and no evidence for any luminosity dependent evolution. According to Hawkins & Veron (1996), the space density relation is rather flat in the range , and then gradually decline to for . The interpretation of the drop-off observed in optically selected samples is equivocal, however, because of the possible bias introduced by dust obscuration arising from intervening systems (Ostriker & Heisler 1984; Wright 1990; Fall & Pei 1993). Radio emission, on the other hand, is unaffected by dust, and Shaver et al. (1996) have recently shown that the space density of radio-loud quasars also decreases strongly for , demonstrating that the turnover is indeed real and that dust along the line of sight has a minimal effect on optically-selected QSOs.
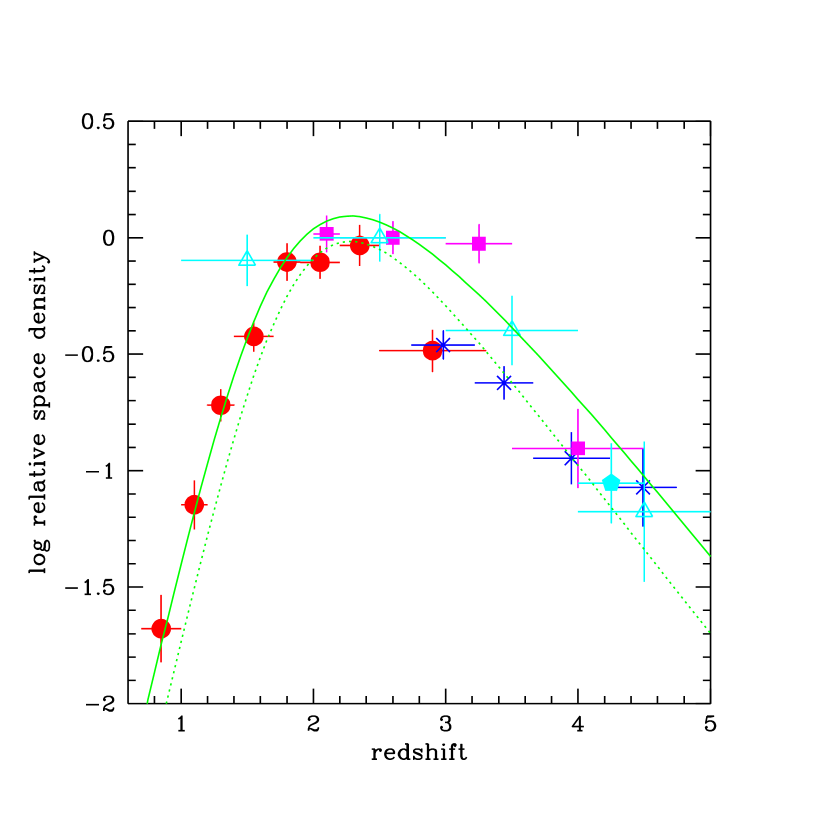
The comoving space density of bright quasars as a function of redshift is plotted in Figure 1. The data points are taken from Hartwick & Shade (1990) (a compilation of 15 major optical surveys with more than 1000 quasars covering the range ), WHO (who have combined their own and four other surveys to form a sample which contains about 200 quasars at ), Schmidt et al. (1995) (90 quasars in the interval ), and KDC (10 quasars at ). All of them refer to QSOs with except for KDC, whose survey limit is one magnitue brighter. The points have been normalized to the space density of quasars ( in the case of KDC) as given by WHO. For comparison, similarly normalized space densities are shown for the Parkes flat-spectrum radio-loud sample of Hook, Shaver, & McMahon (1998).
A successful analytical representations for the shape of the quasar blue luminosity function (LF) is the standard double power-law (Boyle, Shanks, & Peterson 1988; Pei 1995):
| (12) |
The data in Figure 1 can be well fit by a simple model in which the entire LF shifts along the luminosity axis as the position of the break evolves with redshift,
| (13) |
where a power-law spectral distribution for the typical quasar spectrum has been assumed, , and the dependence on the spectral index is explicitly shown. The comoving density of quasars brighter than an absolute magnitude limit as a function of redshift is given by
| (14) |
In a cosmology with , the LF fitting parameters values given by Pei (1995) are , , , . The combination of exponentials we choose in this paper (to be compared with Pei’s representation, a simple Gaussian form that appears to underestimate the number of quasars at ) to describe the evolution of quasars over the whole range of redshifts has fitting parameters , , and . The results of the model are plotted in Figure 1 for . The density of QSOs has a relatively flat maximum at , and declines gradually at higher redshits. Note that, while at and all estimates are in good agreement with each other, in the range the Hartwick & Shade and Schmidt et al. data points appear to be sistematically lower than the WHO point, a discrepancy that may reflects the uncertainties arising in the incompleteness corrections, different selection criteria, etc.
2.4.2 Quasar Emissivity
The QSO emission rate of hydrogen ionizing photons per unit comoving volume can then be written as
| (15) |
where is the extrapolated emissivity in the blue band,
| (16) |
and, as usual, we have assumed a cutoff in the spectrum at 4 ryd because of He absorption. The LF of Seyfert galaxies matches remarkably well that of optically selected QSOs at , and does not show clear evidence of leveling off down to (Cheng et al. 1985). We therefore integrate the LF from , keeping in mind that, for the adopted shape of the LF, a value of 2 times smaller would only increase the quasar emissivity by about 5%. On the other hand, a steeper LF with and same would boost up by a factor 1.75.
Equation (15) assumes a single power-law from optical to EUV frequencies, a poor approximation to the “typical” quasar spectrum. In the following we shall adopt, except when stated otherwise, a more realistic form for the quasar spectral energy distribution:
| (17) |
where the different slopes have been continuously matched. This is based on the rest-frame optical and UV spectra of Francis et al. (1991) and Sargent, Steidel, & Boksenberg (1989), and is similar to the model used in Paper II except for a steeper index at the shortest wavelengths, a choice more consistent with the recent Hubble Space Telescope (HST) observations of the EUV spectra of radio-quiet QSOs at intermediate redshifts (Zheng et al. 1997; see also Laor et al. 1997).
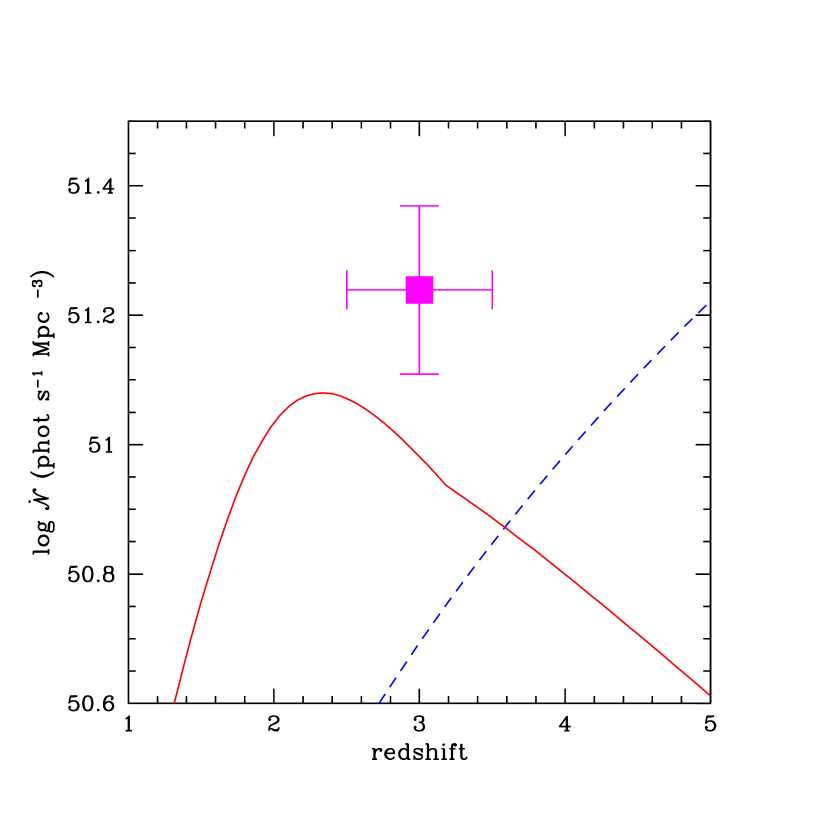
In Figure 2 we plot the value of as a function of redshift according to what will become in the following our “standard QSO model”. It is important to notice that the procedure adopted to derive this quantity implies a large correction for incompleteness at high-. With a fit to the quasar LF which goes as at the faint end, the contribution to the emissivity converges rather slowly, as . At , for example, the blue magnitude at the break of the LF is , comparable or slightly fainter than the limit of current high- QSO surveys. A large fraction, about 90% at and even higher at earlier epochs, of the ionizing emissivity in our model is therefore produced by quasars that have not been actually observed, and are assumed to be present based on an extrapolation from lower redshifts. While the value of obtained by including the contribution from observed quasars only would be much smaller at high redshifts than shown in Figure 2, it is also fair to ask whether an excess of low-luminosity QSOs, relative to the best-fit LF, could actually boost the estimated ionizing emissivity at early epochs. The interest in models where the quasar LF significantly steepens with lookback time, and therefore predict many more QSOs at faint magnitudes than the extrapolation of Pei’s (1995) fitting formulae, stems from recent claims of a strong linear correlation between bulge and observed black hole masses (Magorrian et al. 1997), linked to the steep mass function of dark matter haloes predicted by hierarchical cosmogonies (Haehnelt & Rees 1993; Haiman & Loeb 1998; Haehnelt, Natarajan, & Rees 1998). We shall see in the next section how the space density of low-luminosity quasars at high- may be constrained by the observed lack of red, unresolved faint objects in the Hubble Deep Field (HDF).
2.4.3 Quasar Candidates in the Hubble Deep Field
Several surveys of unresolved objects in the HDF have appeared in the literature (Elson, Santiago, & Gilmore 1996; Flynn, Gould, & Bahcall 1996; Méndez et al. 1996). While the small size of the field (about 5.3 square arcmin covered by the three WFC chips) does not allow one to set meaningful constraints to the number density of bright QSOs, its depth and resolution can be used to explore quasars counts to very faint magnitudes (Conti et al. 1998). In the following we shall denote with , and the AB magnitudes in the F450W, F606W, and F814W HDF bandpasses.
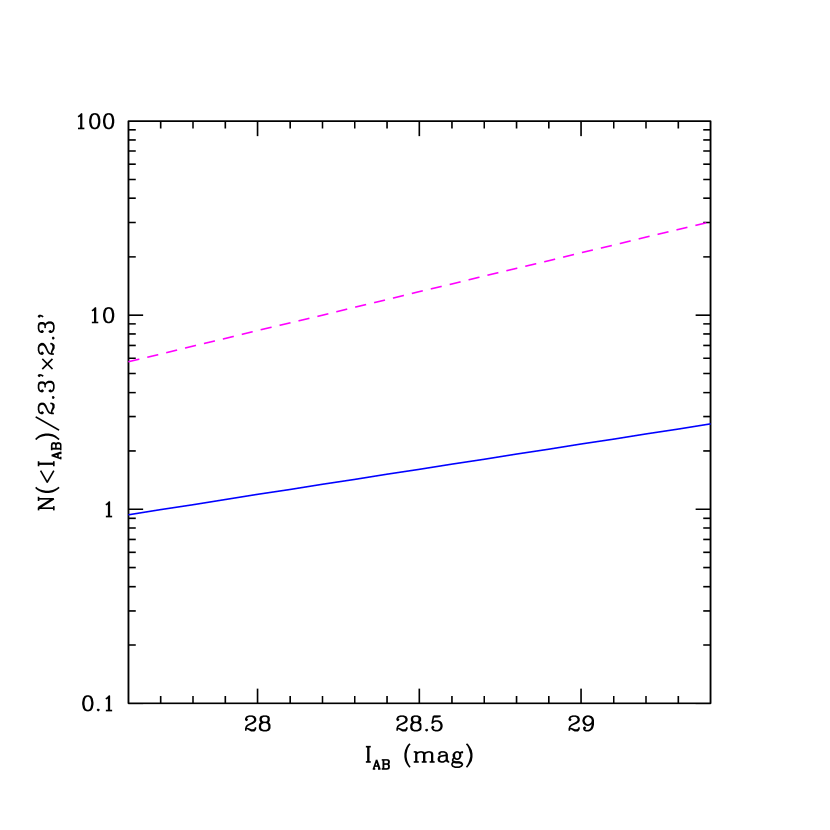
Elson et al. find 59 unresolved objects down to a limiting magnitude of .444Throughout this paper we shall denote with , and the AB magnitudes in the F450W, F606W, and F814W HDF bandpasses. The bulk of them are faint and blue, mag, with only the 9 brighter sources scattering out to . The number of point-like or nearly so objects identified by Méndez et al. and Flynn et al. is about 4 times smaller. Méndez et al. emphasize how, while the star-galaxy separation software is only reliable to , misclassification at fainter magnitudes turns more galaxies into stars than viceversa, as diffuse and faint features disappear first. The number of point-like sources detected in the range should then be considered as an absolute upper limit to the number of stars (or quasars) observed in this magnitude interval. There are, however, no obvious candidate high- QSOs in the published catalogues of unresolved objects in the HDF, as first remarked by Elson et al. In analogy with the case of star-forming galaxies, in fact, Lyman continuum absorption arising because of the ubiquitous presence of H along the line of sight is so severe that faint quasars will drop out of the F450W image altogether by (Paper I; Haiman, Madau, & Loeb 1998). At , line blanketing from the Lyforest will also cause a significant apparent depression ( mag) in the F606W continuum image. High redshifts () quasars are expected then to have very red and reddish colors. By contrast, all of the faint () stellar sources in the Méndez et al. (1996) sample have and . A recent detailed search for faint QSOs in the HDF by Conti et al. (1998) confirms the lack of a very red compact population: down to a 50% completeness limit of (), no quasar candidates are found.
While a detailed comparison between deep imaging data and recent theoretical modeling of the evolution of the quasar LF has appeared elsewhere (Haiman et al. 1998), it is important in this context to take note of the interesting constraints that the lack of red, unresolved objects in the HDF may pose on reionization scenarios which rely on a large number density of low-luminosity quasars at early epochs. Figure 3 shows the predicted number- magnitude relation of active galaxies in the redshift range for the best-fit model discussed in the previous section and an illustrative variant, one that is characterized by a steeper LF with slope and a comoving space density that remains constant above instead of dropping. This alternative evolution model has been choosen in order to boost the actual emission rate of hydrogen-ionizing photons from QSOs at by about a factor of 5. It is clear from Figure 3 that this model predicts too many red faint stellar sources in the field of view. On the other hand, a large population of faint AGNs at high- would be consistent with the data if, at these faint magnitude levels and high image resolution, the host galaxies of active nuclei could actually be resolved.
We shall see in § 3 below how, taken at face value, our results on the production of photons above 1 ryd by QSOs may pose some problems to the idea that a quasar-dominated background is responsible for maintaining the intergalactic gas in a highly ionized state at early epochs. Here we will simply note that the ability of quasars to overcome recombinations depends sensitively on the clumpiness of the medium. The emission rate of ionizing photons in our standard QSO model, at , is just a fraction of the total number of hydrogen recombinations in a clumpy, fast recombining universe, s-1 Mpc-3 if K.
2.4.4 Star-forming Galaxies
Galaxies with ongoing star-formation are another obvious source of Lyman continuum photons. The tremendous progress in our understanding of faint galaxy data made possible by the recent identification of star-forming galaxies at in ground-based surveys (Steidel et al. 1996a) and in the HDF (Steidel et al. 1996b; Madau et al. 1996; Lowenthal et al. 1997) has provided new clues to the long-standing issue of whether galaxies at high redshifts can provide a significant contribution to the ionizing background flux. Since the rest-frame UV continuum at 1500 Å (redshifted into the visible band for a source at ) is dominated by the same short-lived, massive stars which are responsible for the emission of photons shortward of the Lyman edge, the needed conversion factor, about one ionizing photon every 10 photons at 1500 Å, is fairly insensitive to the assumed IMF and is independent of the galaxy history for yr.555Shortward of the Lyman edge, however, the differences in the predicted ionizing radiation from model atmospheres of hot stars can actually be significant (see, e.g., Charlot 1996).
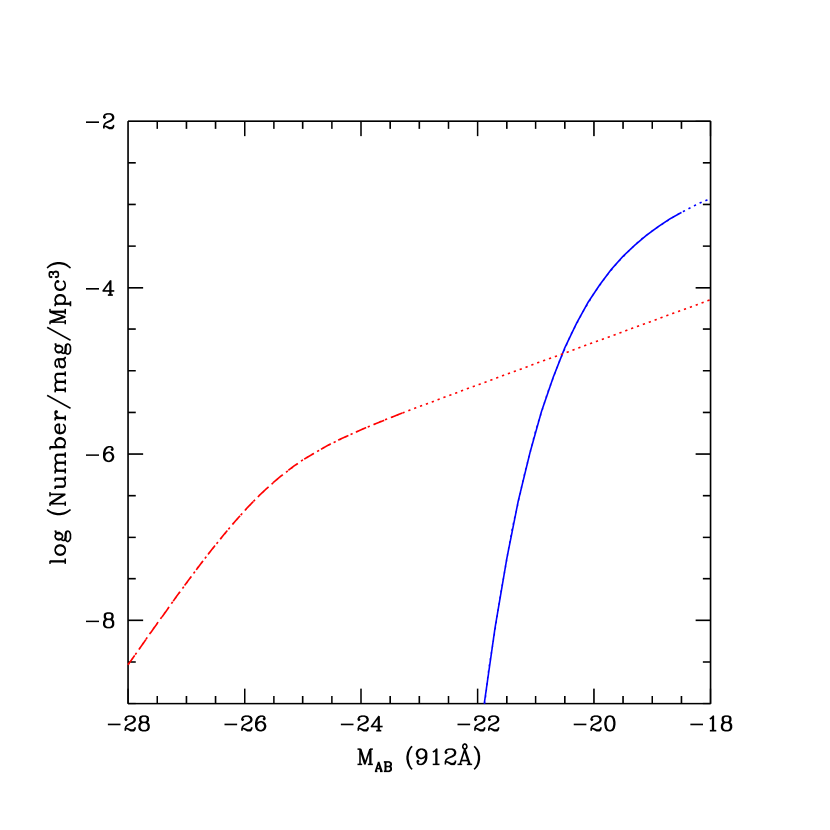
A composite ultraviolet luminosity function of Lyman-break galaxies at has been recently derived by Dickinson (1998). It is based on spectroscopically (about 375 objects) and photometrically selected galaxies from the ground-based and HDF samples, and spans about a factor 50 in luminosity from the faint to the bright end. Because of the uncertanties that still remain in the rescaling of the HDF data points to the ground-based data, the comoving luminosity density at 1500 Å is estimated to vary within the range 1.6 to . The “best guess” Schechter fit gives , , and (Dickinson 1998), the magnitude at the “break” corresponding to a star-formation rate slightly in excess of (Salpeter IMF). Figure 4 shows the Lyman continuum luminosity function of galaxies at (at all ages Gyr one has for a Salpeter mass function and constant star formation rate, Bruzual & Charlot 1998), compared to the distribution of QSO luminosities at the same redshift. The comoving ionizing emissivity due to Lyman-break galaxies is , between 2 and 4 times higher than the estimated quasar contribution at .
This number neglects any correction for dust extinction and intrinsic H absorption. While it has been pointed out by many authors (e.g., Meurer et al. 1997; Pettini et al. 1997; Dickinson 1998) that the colors of Lyman-break galaxies are redder than expected in the case of dust-free star-forming objects, the prescription for a “correct” de-reddening is still unknown at present (note that redder spectra may also results from an aging population or an IMF which is rather poor in massive stars). A Salpeter IMF, model with SMC-type dust in a foreground screen, for example, has been found to reproduce quite well the rest-frame ultraviolet colors of the HDF “UV dropouts” (Madau, Pozzetti, & Dickinson 1998). In this model the color excess is rather small and can be safely neglected in correcting from observed rest-frame far-UV to the Lyman edge. However, for typical dust-to-gas ratios, it is the H associated with dust that would greatly reduce the flux of Lyman continuum photons able to escape into the intergalactic space. The data point plotted in Figure 2 assumes a value of for the unknown fraction of ionizing photons which escapes the galaxy H layers into the intergalactic medium (e.g., Madau & Shull 1996; Giallongo, Fontana, & Madau 1997). The possible existence of a numerous population of galaxies below the detection threshold, i.e. having star formation rates , with a space density well in excess of that predicted by extrapolating to faint magnitudes the best-fit Schechter function, will be discussed in § 4.
The LF of Lyman-break galaxies at is very uncertain. An analysis of the -band dropouts in the HDF – candidate star-forming objects at – seems to imply a decrease in the comoving UV galaxy emissivity by about a factor of 2 in the interval (Madau et al. 1996, 1998), but the error bars are still rather large. Adopting a to conversion factor of 6, we estimate a comoving ionizing emissivity of at . One should note that, while a population of highly reddened galaxies at high redshifts would be missed by the dropout color technique (which isolates sources that have blue colors in the optical and a sharp drop in the rest-frame UV), it seems unlikely that very dusty objects with , such as the recently discovered population of sub-mm sources (e.g. Barger et al. 1998) would contribute in any significant manner to the ionizing metagalactic flux.
3 Reionization of the Universe
In the previous section we have reviewed the basic theory of cosmological radiative transfer in a clumpy universe, demonstrated the local character of the Lyman continuum flux at early epochs, and discussed the role of bright quasars and star-forming galaxies as candidate sources of photoionization at high redshifts. In this and the following sections we will try to shed some light on the time-dependent reionization process, and introduce the concept of a critical emission rate of hydrogen-ionizing photons per unit cosmological volume.
In inhomogeneous reionization scenarios, the history of the transition from a neutral IGM to one that is almost fully ionized can be statistically described by the evolution with redshift of the volume filling factor or porosity of H , He , and He regions. The radiation emitted by spatially clustered stellar-like and quasar-like sources – the number densities and luminosities of which may change rapidly as a function of redshift – coupled with absorption processes in a medium with a time-varying clumping factor, all determine the complex topology of neutral and ionized zones in the universe. When and the radiation sources are randomly distributed, the ionized regions are spatially isolated, every UV photon is absorbed somewhere in the IGM, and the ionization process cannot be described as due to a statistically homogeneous radiation field (Arons & Wingert 1972; Meiksin & Madau 1993). While the final size of the expanding ionized bubbles is only limited by the individual source lifetime, the timescale for full recombination is rather short and relict ionization zones may recombine faster than they can accumulate (cf Arons & Wingert 1972). As grows, the crossing of ionization fronts becomes more and more common, and the neutral phase shrinks in size until the reionization process is completed at the “overlap” epoch, when every point in space is exposed to Lyman continuum radiation and .
3.1 Time Evolution of Expanding Cosmological H Regions
When an isolated point source of ionizing radiation turns on, the ionized volume initially grows in size at a rate fixed by the emission of UV photons, and an ionization front separating the H and H regions propagates into the neutral gas. Most photons travel freely in the ionized bubble, and are absorbed in a transition layer. The evolution of an expanding H region is governed by the equation
| (18) |
(Shapiro & Giroux 1987), where is the proper volume of the ionized zone, is the number of ionizing photons emitted by the central source per unit time, and all other symbols have their usual meaning. Across the I-front the degree of ionization changes sharply on a distance of the order of the mean free path of an ionizing photon. When , the growth of the H region is slowed down by recombinations in the highly inhomogeneous IGM, and its evolution can be decoupled from the expansion of the universe. Just like in the static case, the ionized bubble will fill its time-varying Strömgren sphere after a few recombination timescales,
| (19) |
While the volume that is actually ionized depends on the luminosity of the central source, the time it takes to produce an ionization-bounded region is only a function of . One should point out that the use of a volume-averaged clumping factor in the recombination timescale is only justified when the size of the H region is large compared to the scale of the clumping, so that the effect of many clumps (filaments) within the ionized volume can be averaged over. This will be a good approximation either at late epochs, when the IGM is less dense and H zones have had time to grow, or at earlier epochs if the ionized bubbles are produced by very luminous sources like quasars or the stars within halos collapsing from very high- peaks. From equation (5), the mean free path between absorbers having neutral columns is Mpc h: it is only on scales greater than this value that the clumping can be averaged over. (Systems with cm-2 do not dominate the mass, Miralda-Escudè et al. 1996; if the overdensity is an increasing function of , this implies, a fortiori, that low- absorbers do not contribute significantly to the volume-averaged recombination rate.) On smaller scales underdense regions are ionized first, and only afterwards the UV photons start to gradually penetrate into the higher density gas.
With these caveats in mind, equation (18) approximately holds for every isolated source of ionizing photons in the IGM. The filling factor of H regions in the universe, , is then equal at any given instant to the integral over cosmic time of the rate of ionizing photons emitted per hydrogen atom and unit cosmological volume by all radiation sources present at earlier epochs, , minus the rate of radiative recombinations, . Differentiating one gets
| (20) |
It is this simple differential equation – and its equivalent for expanding helium zones – that statistically describes the transition from a neutral universe to a fully ionized one, independently, for a given emissivity, of the complex and possibly short-lived emission histories of individual radiation sources, e.g., on whether their comoving space density is constant or actually varies with cosmic time. In the case of a time-independent clumping factor, equation (20) has formal solution
| (21) |
with . Assuming a constant comoving emissivity, this can be rewritten as
| (22) |
where is the exponential integral function. Contrary to the static case, the H regions will always percolate in an expanding universe with constant comoving emissivity and . At high redshifts, and for an IGM with , one can expand around to find
| (23) |
The porosity of ionized bubbles is then approximately given by the number of ionizing photons emitted per hydrogen atom in one recombination time. In other words, because of hydrogen recombinations, only a fraction ( a few per cent at ) of the photons emitted above 1 ryd is actually used to ionize new IGM material. The universe is completely reionized when , i.e. when
| (24) |
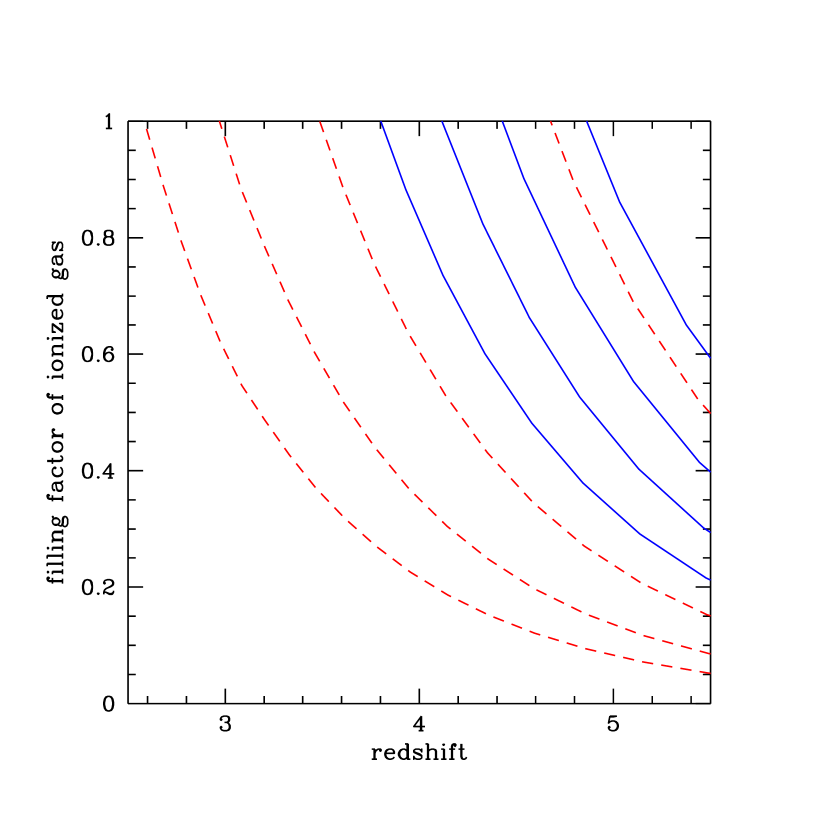
While this last expression has been derived assuming a constant comoving ionizing emissivity and a time-independent clumping factor, it is also valid in the case and do not vary rapidly over a timescale . Figure 5 shows the H filling factor resulting from numerical integration of equation (20), as a function of redshift for the QSO photoionization model described in § 2.4, and a clumpy IGM with (constant) and 30. The transition from a neutral to a ionized universe takes place too late in this model, as late as for , and never before even in the limiting case of a uniform medium. One should stress here the illustrative character of the curves depicted in Figure 5; in the real universe the clumpiness of the ionized hydrogen component will increase with cosmic time as more baryons collapse, and may also be a function of the UV photon production rate (see discussion below).
3.2 The Case of Centrally Concentrated Clumps
The very simple model described in the previous section, one where individual H regions expand at a rate that depends on and on a mean clumping factor assumed independent of the UV production rate, may not provide a good description of the late stages of reionization, when the fraction of baryons collapsed in virialized structures is non negligible, the filling factor of ionized material is close to unity, and a significant fraction of all hydrogen recombinations (the rate of which is proportional to the square of the mass times the clumping factor of the recombining gas) may occur in the gas surrounding localized “islands” of neutral material with a small volume filling factor, e.g., the Lyman-limit absorbers.
Consider, as an illustrative example, a fully ionized diffuse IGM after complete overlapping has occurred, but with denser, partially neutral spheres embedded in it, each characterized by an isothermal () radial dependence of the gas density. Irradiated from the outside by the background radiation field generated by the ionizing sources, the neutral core of each clump will be delimited by a “Strömgren surface” with radius proportional to , which will shrink as the UV metagalactic flux builds up with time. The cross section of the neutral cores, which determines the mean free path of ionizing photons, scales then as (hence ). Since UV emissivity , in this simple model and will scale at a given epoch as the cube and square of the UV production rate at that epoch, respectively. On timescales where the number density of clumps stays approximately constant, the clumping factor scales as the inverse cube of the Strömgren radius, increasing therefore as the cube of the photon production rate. Spheres with different density profiles show a change of behaviour when the radial power-law slope (gas density , with in the case of isothermal spheres) becomes flatter than . For these less peaked density distributions, the total recombination rate converges towards small radii: the Strömgren surface suddenly moves inward when the UV flux rises above some threshold, allowing the photon mean free path to increase rapidly. (In the limiting case the clumping factor becomes independent of the emission rate of ionizing photons.)
The equations put forward in the previous section provide a good description of the reionization process only when the clumps are not centrally concentrated. In this case the recombination rate depends on the filling factor Q and saturates when most of the volume is ionized; increases steeply, by a large factor, when becomes and the H regions overlap. In the presence of dense clumps with steep density gradients, however, recombinations occur mainly just outside the Strömgren surfaces (of course the high-density regions may be filaments rather than spheres, but that does not change the picture), and there is a different relationship between and compared to that predicted in a model where the clumping does not depend on the ionizing emissivity. The impact of Lyman-limit absorbers with steep density profiles on the reionization histories depicted in Figure 5 will depend on their baryonic content as well as on their volume filling factor, both of which are only poorly known at the moment.
3.3 Delayed He Reionization
Because of its higher ionization potential, the most abundant (by a factor ) absorbing ion in the universe is not H but He . The importance of intergalactic helium in the context of this work stems from the possibility of detecting the effect of “incomplete” He reionization in the spectra of quasars as, depending on the clumpiness of the IGM (Madau & Meiksin 1994) and on the spectrum of UV radiation sources (Miralda-Escudè & Rees 1993), the photoionization of singly ionized helium may be delayed until much later than for H .
Since H and He do not absorb a significant fraction of eV photons, the problem of He reionization can be decoupled from that of other ionizations, and the equivalent of equation (20) for He expanding regions becomes
| (25) |
where now takes into account only photons above 4 ryd, and is times shorter than the hydrogen recombination timescale if ionized hydrogen and doubly ionized helium have similar clumping factors. It is interesting to note that, if the intrinsic spectrum of ionizing sources has slope , the first terms on the right-hand side of equations (20) and (25) are actually equal, and a significant delay between the complete overlapping of H and He regions can only arise if recombinations are important. This effect is illustrated in Figure 5, where the expected evolution of the He filling factor is plotted for our standard QSO-photoionization model: He reionization is never completed before in models with . While a significant contribution to the UV background at 1 ryd from massive stars may push the hydrogen reionization epoch to higher redshifts, the ratio between the number of He and H Lyman continuum photons emitted from star-forming galaxies is only about two percent (Leitherer & Heckman 1995), five times smaller than in typical QSO spectra. It is likely then that recent observations of intergalactic He absorption at high redshift may provide a rather direct test of quasar evolution models.
To date, a He absorption trough has been detected in the spectra of four distant QSOs. The HST and Hopkins Ultraviolet Telescope observations do not resolve individual absorption lines, but rather provide an average optical depth below 304 Å in the rest-frame: towards HS1700+6416 (, Davidsen, Kriss, & Zheng 1996), towards PKS 1935-692 (, Jakobsen 1997), and towards Q0302-003 (, Jakobsen et al. 1994; Hogan, Anderson, & Rugers 1996). These, together with the spectrum of HE2347-4342 (, Reimers et al. 1997), which reveals patchy absorption with low He opacity () “voids” alternating several Mpc sized regions with vanishing flux (), suggest that helium absorption does not increase smoothly with lookback time, but rather in the abrupt manner expected in the final stages of inhomogeneous He reionization by quasar sources. A detailed assessment of the implications of late He reionization, which may also have received some support from the recent observation of a sharp drop in the ratio of Si to C absorption in the Lyforest at (Songaila 1998), will be the subject of another paper. Here it is important to remark that, while delayed He reionization in a clumpy IGM appears to be naturally linked to the observed decline in the space density of quasars beyond , the complete overlapping of He regions occurs instead much earlier () in models that predict many more faint QSOs at high redshifts (Haiman & Loeb 1998).
4 Discussion
We have seen in the previous sections that, in the approximation the clumping can be averaged over, only the photons emitted within one recombination timescales can actually be used to ionize new material. As at high redshifts, it is possible to compute at any given epoch a critical value for the photon emission rate per unit cosmological comoving volume, , independently of the (unknown) previous emission history of the universe: only rates above this value will provide enough UV photons to ionize the IGM by that epoch. One can then compare our determinations of to the estimated contribution from QSOs and star-forming galaxies. Equation (24) can then be rewritten as
| (26) |
The uncertainty on this critical rate is difficult to estimate, as it depends on the clumping factor of the IGM (scaled in the expression above to the value inferred at from numerical simulations, Gnedin & Ostriker 1997) and the nucleosynthesis constrained baryon density. A quick exploration of the available parameter space indicates that the uncertainty on could easily be of order in the log. The evolution of the critical rate as a function of redshift is plotted in Figure 2. While is comparable to the quasar contribution at , there is some indication of a significant deficit of Lyman continuum photons at . For bright, massive galaxies to produce enough UV radiation at , their space density would have to be comparable to the one observed at , with most ionizing photons being able to escape freely from the regions of star formation into the IGM. This scenario may be in conflict with direct observations of local starbursts below the Lyman limit showing that at most a few percent of the stellar ionizing radiation produced by these luminous sources actually escapes into the IGM (Leitherer et al. 1995).666Note that, at , Lyman-break galaxies would radiate more ionizing photons than QSOs for . If, on the other hand, faint QSOs with (say) at rest-frame ultraviolet frequencies were to provide all the required ionizing flux, their comoving space density would be such (Mpc-3) that about 50 of them would expected in the HDF down to . At , they would appear very red in as the Lyforest is shifted into the visible. This simple model can be ruled out, however, as there is only a handful (7) of sources in the HDF with mag down to this magnitude limit.
It is interesting to convert the derived value of into a “minimum” star formation rate per unit (comoving) volume, (hereafter we assume and ):
| (27) |
The conversion factor assumes a Salpeter IMF with solar metallicity, and has been computed using Bruzual & Charlot (1998) population synthesis code. It can be understood by noting that, for each 1 of stars formed, 8% goes into massive stars with that dominate the Lyman continuum luminosity of a stellar population. At the end of the C-burning phase, roughly half of the initial mass is converted into helium and carbon, with a mass fraction released as radiation of 0.007. About 25% of the energy radiated away goes into ionizing photons of mean energy 20 eV. For each 1 of stars formed every year, we then expect
| (28) |
to be emitted shortward of 1 ryd. Note that the star formation density given in equation (27) is comparable with the value directly “observed” (i.e., uncorrected for dust reddening) at (Madau et al. 1998; Dickinson 1998). If the volume emissivity has spectrum , the “minimum” background intensity at the Lyman limit is, from equations (8), (9), and (26)
| (29) |
The same massive stars that dominate the Lyman continuum flux also manufacture and return most of the metals to the ISM. In the approximation of instantaneous recycling, the rate of ejection of newly sinthesized heavy elements which is required to keep the universe ionized at redshift is, from equation (27),
| (30) |
where is the net, IMF-averaged “yield” of returned metals, , and is the mass fraction of a generation of stars that is returned to the interstellar medium. At , and over a timescale of Gyr corresponding to a formation redshift , such a rate would generate a mean metallicity per baryon in the universe of
| (31) |
comparable with the level of enrichment observed in the Lyforest at (Songaila 1997): more than 2% of the present-day stars would need to have formed by . It has been suggested (e.g., Miralda-Escudè & Rees 1998) that a large number of low-mass galactic halos, expected to form at early times in hierarchical clustering models, might be responsible for photoionizing the IGM at these epochs. According to the spherically-symmetric simulations of Thoul & Weinberg (1996), photoionization heating by the UV background flux that builds up after the overlapping epoch completely suppresses the cooling and collapse of gas inside the shallow potential wells of halos with circular velocities . Halos with circular speed , corresponding in top-hat spherical collapse to a virial temperature K and halo mass , appear instead largely immune to this external feedback (but see Navarro & Steinmetz 1997). In these systems rapid cooling by atomic hydrogen can then take place and a significant fraction, , of their total mass may be converted into stars over a timescale comparable to the Hubble time (with close to 1 if the efficiency of forming stars is high). If high- dwarfs with star formation rates were actually responsible for keeping the universe ionized at , their comoving space density would have to be
| (32) |
two hundred times larger than the space density of present-day galaxies brighter than , and about five hundred times larger than that of Lyman-break objects at with , i.e. with star formation rates in excess of . Only a rather steep luminosity function, with Schechter slope , would be consistent with such a large space density of faint dwarfs and, at the same time, with the paucity of brighter - and -band dropouts observed in the HDF. The number density on the sky would be arcsec-2, corresponding to more than three thousands sources in the HDF. With a typical apparent magnitude at of mag (assuming ), these might be too faint to be detected by the HST, but within the range of the proposed Next Generation Space Telescope (Stockman et al. 1998).
These estimates are in reasonable agreement (although towards the low side) with the calculations of Miralda-Escudè & Rees (1998), who used the observed metallicity of the Lyforest as the starting point of their investigation. A higher density of sources – which would therefore have to originate from lower amplitude peaks – would be required if the typical efficiency of star formation and/or the escape fraction of ionizing photons were low, . In this case the dwarfs could still be detectable if a small fraction of the gas turned into stars in very short bursts (there would then be an extra parameter associated with their duty cycle, in addition to and ). A reduction of the star formation rate in halos with low circular velocities (necessary in hierarchical cosmogonies to prevent too many baryons from turning into stars as soon as the first levels of the hierarchy collapse, White & Frenk 1991) may result from the heating and possible expulsion of the gas due to repeated supernova (SN) explosions after only a very small number of stars have formed. Recent numerical simulations (Mac Low & Ferrara 1998) show, however, that metal-enriched material from SN ejecta is accelerated to velocities larger than the escape speed from such systems far more easily than the ambient gas. If the same population of dwarf galaxies that may keep the universe ionized at were also responsible for polluting the IGM with heavy elements, it is interesting to ask whether these atoms could diffuse uniformly enough to account for the observations of weak but measurable C absorption lines associated with the Lyforest clouds (Lu et al. 1998; Songaila 1997). Our fiducial estimate of 0.1 sources per comoving Mpc3 implies that, in order to pollute the entire IGM, the metal-enriched material would have to be expelled to typical distances of order 1 Mpc, which would require an ejection speed of about . In fact, the heavy elements may be restricted to filaments within only (say) 20 proper kpc (100-150 comoving kpc) of the halos, and in this case it would be enough to accelerate the outflowing metals to velocities comparable to the escape velocity, rather than to the higher speeds associated with SN ejecta. The required diffusion of heavy elements would be a more serious constraint if the relevant galaxies were rarer and more luminous, as would happen if they originated from 3- peaks and star formation was postulated to occur with higher efficiency than in more typical peaks.
Acknowledgements.
We have benefited from useful discussions with A. Conti, M. Haehnelt, J. Miralda-Escudé, and especially D. Sciama. Support for this work was provided by NASA through ATP grant NAG5-4236 (PM), and by the Royal Society (MJR).References
- (1) Arons, J., & Wingert, D. W. 1972, ApJ, 177, 1
- (2) Barger, A. J., Cowie, L. L., Sanders, D. B., Fulton, E., Taniguchi, Y., Sato, Y., Kawara, K., Okuda, H. 1998, Nature, 394, 248
- (3) Bechtold, J. 1994, ApJS, 91, 1
- (4) Bechtold, J., Weymann, R. J., Lin, Z., & Malkan, M. 1987, ApJ, 315, 180
- (5) Boyle, B. J., Shanks, T., & Peterson, B. A. 1988, MNRAS, 235, 935
- (6) Bruzual, A. G., & Charlot, S. 1998, in preparation
- (7) Cen, R., Miralda-Escudé, J., Ostriker, J. P., & Rauch, M. 1994, ApJ, 437, L9
- (8) Charlot, S. 1996, in ASP Conf. Ser. 98, From Stars to Galaxies: The Impact of Stellar Physics on Galaxy Evolution, ed. C. Leitherer, U. Fritze-von Alvensleben, & J. Huchra (San Francisco: ASP), 275
- (9) Cheng, F.-Z., Danese, L., De Zotti, G., & Franceschini, A. 1985, MNRAS, 212, 857
- (10) Ciardi, B., & Ferrara, A. 1997, ApJ, 483, L5
- (11) Conti, A., Kennefick, J. D., Martini, P., & Osmer, P. S. 1998, submitted to AJ (astro-ph/9808020)
- (12) Copi, C. J., Schramm, D. N., & Turner, M. S. 1994, Science, 267, 192
- (13) Couchman, H. M. P., & Rees, M. J. 1986, MNRAS, 221, 53
- (14) Cowie, L. L., Songaila, A., Kim, T.-S., & Hu, E. M. 1995, AJ, 109, 1522
- (15) Davidsen, A. F., Kriss, G. A., & Zheng, W. 1996, Nature, 380, 47
- (16) Dickinson, M. E. 1998, in The Hubble Deep Field, ed. M. Livio, S. M. Fall, & P. Madau (Cambridge: Cambridge University Press), in press (astro-ph/9802064)
- (17) Elson, R. A. W., Santiago, B. X., & Gilmore, G. F. 1996, New Astronomy, 1, 1
- (18) Fall, S. M., & Pei, Y. C. 1993, ApJ, 402, 479
- (19) Flynn, C., Gould, A., & Bahcall, J. N. 1996, ApJ, 466, L55
- (20) Francis, P. J., Hewett, P. C., Foltz, C. B., Chaffee, F. H., Weymann, R. J., & Morris, S. L. 1991, ApJ, 373, 465
- (21) Fukugita, M., & Kawasaki, M. 1994, MNRAS, 269, 563
- (22) Giallongo, E., D’Odorico, S., Fontana, A., McMahon, R. G., Savaglio, S., Cristiani, S., Molaro, P., & Trevese, D. 1994, ApJ, 425, L1
- (23) Giallongo, E., Fontana, A., & Madau, P. 1997, MNRAS, 289, 629
- (24) Giroux, M. L., & Shapiro, P. R. 1996, ApJS, 102, 191
- (25) Gnedin, N. Y., & Ostriker, J. P. 1997, ApJ, 486, 581
- (26) Gunn, J. E., & Peterson, B. A. 1965, ApJ, 142, 1633
- (27) Haardt, F., & Madau, P. 1996, ApJ, 461, 20 (Paper II)
- (28) Haehnelt, M. G., Natarajan, P., & Rees, M. J. 1998, MNRAS, in press
- (29) Haehnelt, M. G., & Rees, M. J. 1993, MNRAS, 263, 168
- (30) Haiman, Z., & Loeb, A. 1997, ApJ, 483, 21
- (31) ——— 1998, ApJ, in press
- (32) Haiman, Z., Madau, P., & Loeb, A. 1998, submitted to ApJ (astro-ph/9805258)
- (33) Hartwick, F. D. A., & Schade, D. 1990, ARA&A, 28, 437
- (34) Hawkins, M. R. S., & Veron, P. 1996, MNRAS, 281, 348
- (35) Hernquist, L., Katz, N., Weinberg, D. H., & Miralda-Escudé, J. 1996, ApJ, 457, L51
- (36) Hogan, C. J., Anderson, S. F., & Rugers, M. H. 1997, AJ, 113, 1495
- (37) Hook, I. M., Shaver, P. A., & McMahon, R. G. 1998, in The Young Universe: Galaxy Formation and Evolution at Intermediate and High Redshift, ed. S. D’Odorico, A. Fontana, & E. Giallongo (San Francisco: ASP), in press (astro-ph/9801213)
- (38) Hu, E. M., Kim, T.-S., Cowie, L. L., Songaila, A., & Rauch, M. 1995, AJ, 110, 1526
- (39) Jakobsen, P. 1997, in Structure and Evolution of the Intergalactic Medium from QSO Absorption Line Systems, ed. P. Petitjean & S. Charlot (Paris: Nouvelles Frontières), 57
- (40) Jakobsen, P., Boksenberg, A., Deharveng, J. M., Greenfield, P., Jedrzejewski, R., & Paresce, F. 1994, Nature, 370, 35
- (41) Kennefick, J. D., Djorgovski, S. G., & de Carvalho, R. R. 1995, AJ, 110, 2553 (KDC)
- (42) Kim, T.-S., Hu, E. M., Cowie, L. L., & Songaila, A. 1997, AJ, 114, 1
- (43) Lanzetta, K. M., Wolfe, A. M., & Turnshek, D. A. 1995, ApJ, 440, 435
- (44) Laor, A., Fiore, F., Elvis, M., Wilkes, B. J., & McDowell, J. C. 1997, ApJ, 477, 93
- (45) Leitherer, C., Ferguson, H. C., Heckman, T. M., & Lowenthal, J. D. 1995, ApJ, 454, L19
- (46) Leitherer, C., & Heckman, T. M. 1995, ApJS, 96, 9
- (47) Lowenthal, J. D., Koo, D. C., Guzman, R., Gallego, J., Phillips, A. C., Faber, S. M., Vogt, N. P., Illingworth, G. D., & Gronwall, C. 1997, ApJ, 481, 673
- (48) Lu, L., Sargent, W. L. W., Barlow, T. A., & Rauch, M. 1998, submitted to AJ (astro-ph/9801189)
- (49) Madau, P. 1992, ApJ, 389, L1
- (50) ——— 1995, ApJ, 441, 18 (Paper I)
- (51) Madau, P., Ferguson, H. C., Dickinson, M. E., Giavalisco, M., Steidel, C. C., & Fruchter, A. 1996, MNRAS, 283, 1388
- (52) Madau, P., & Meiksin, A. 1994, ApJ, 433, L53
- (53) Madau, P., Meiksin, A., & Rees, M. J. 1997, ApJ, 475, 429
- (54) Madau, P., Pozzetti, L., & Dickinson, M. E. 1998, ApJ, 498, 106
- (55) Madau, P., & Shull, J. M. 1996, ApJ, 457, 551
- (56) Magorrian, J., et al. 1997, submitted to AJ (astro-ph/9708072)
- (57) Mac Low, M.-M., & Ferrara, A. 1998, submitted to ApJ (astro-ph/9801237)
- (58) Meiksin, A., & Madau, P. 1993, ApJ, 412, 34
- (59) Méndez, R. A., Minniti, D., De Marchi, G., Baker, A., & Couch, W. J. 1996, MNRAS, 283, 666
- (60) Meurer, G. R., Heckman, T. M., Lehnert, M. D., Leitherer, C., & Lowenthal, J. 1997, AJ, 114, 54
- (61) Miralda-Escudé, J., Cen, R., Ostriker, J. P., & Rauch, M. 1996, ApJ, 471, 582
- (62) Miralda-Escudé, J., & Ostriker, J. P. 1990, ApJ, 350, 1
- (63) Miralda-Escudé, J., & Rees, M. J. 1993, MNRAS, 260, 617
- (64) ——— 1998, ApJ, 497, 21
- (65) Navarro, J. F., & Steinmetz, M. 1997, ApJ, 478, 13
- (66) Osmer, P. S. 1982, ApJ, 253, 280
- (67) Ostriker, J. P., & Gnedin, N. Y. 1996, ApJ, 472, L63
- (68) Ostriker, J. P., & Heisler, J. 1984, ApJ, 278, 1
- (69) Paresce, F., McKee, C., & Bowyer, S. 1980, ApJ, 240, 387
- (70) Peebles, P. J. E. 1993, Principles of Physical Cosmology (Princeton: Princeton University Press)
- (71) Pei, Y. C. 1995, ApJ, 438, 623
- (72) Petitjean, P., Webb, J. K., Rauch, M., Carswell, R. F., & Lanzetta, K. M. 1993, MNRAS, 262, 499
- (73) Pettini, M., Steidel, C. C., Dickinson, M. E., Kellogg, M., Giavalisco, M., & Adelberger, K. L. 1998, in The Ultraviolet Universe at Low and High Redshift, ed. W. Waller, (Woodbury: AIP Press), in press (astro-ph/9707200)
- (74) Press, W. H., & Rybicki, G. B. 1993, ApJ, 418, 585
- (75) Reimers, D., Köhler, S., Wisotzki, L., Groote, D., Rodriguez-Pascual, P., & Wamsteker, W. 1997, A&A, 327, 890
- (76) Sargent, W. L. W., Steidel, C. C., & Boksenberg, A. 1989, ApJS, 69, 703
- (77) Schneider, D. P., Schmidt, M., & Gunn, J. E. 1991, AJ, 101, 2004
- (78) Schmidt, M., Schneider, D. P., & Gunn, J. E. 1995, AJ, 110, 68
- (79) Sciama, D. W. 1995, ApJ, 448, 667
- (80) Shapiro, P. R., & Giroux, M. L. 1987, ApJ, 321, L107
- (81) Shaver, P. A., Wall, J. V., Kellerman, K. I., Jackson, C. A., & Hawkins, M. R. S. 1996, Nature, 384, 439
- (82) Songaila, A. 1997, ApJ, 490, L1
- (83) ——— 1998, AJ, in press (astro-ph/9803010)
- (84) Songaila, A., Cowie, L. L., & Lilly, S. J. 1990, ApJ, 348, 371
- (85) Steidel, C. C., Giavalisco, M., Dickinson, M. E., & Adelberger, K. 1996b, AJ, 112, 352
- (86) Steidel, C. C., Giavalisco, M., Pettini, M., Dickinson, M. E., & Adelberger, K. 1996a, ApJ, 462, L17
- (87) Stengler-Larrea, E., et al. 1995, ApJ, 444, 64
- (88) Stockman, H. S., Stiavelli, M., Im, M., & Mather, J. C. 1998, in ASP Conf. Ser. 133, Science with the Next Generation Space Telescope, ed. E. Smith & A. Koratkar (San Francisco: ASP), 24
- (89) Tegmark, M., Silk, J., & Blanchard, A. 1994, ApJ, 420, 484
- (90) Thoul, A. A., & Weinberg, D. H. 1996, ApJ, 465, 608
- (91) Tytler, D. 1987, ApJ, 321, 49
- (92) Warren, S. J., Hewett, P. C., & Osmer, P. S. 1994, ApJ, 421, 412 (WHO)
- (93) White, S. D. M.,& Frenk, C. S. 1991, ApJ, 379, 25
- (94) Wright, E. L. 1990, ApJ, 353, 411
- (95) Zhang, Y., Anninos, P., & Norman, M. L. 1995, ApJ, 453, L57
- (96) Zhang, Y., Meiksin, A., Anninos, P., & Norman, M. L. 1998, ApJ, 495, 63
- (97) Zheng, W., Kriss, G. A., Telfer, R. C., Crimes, J. P., & Davidsen, A. F. 1998, ApJ, 492, 855
- (98)
- (99)