Galaxy kinematics from counter-dispersed imaging
Abstract
Determining the internal kinematics of a galaxy from planetary nebulae (PN) is usually a two step process in which the candidate PN are first identified in a target galaxy and then, in a follow up run, spectra are obtained. We have implemented a new technique in which two dispersed images at the wavelength of the [O III] emission line at 5007Å are combined to yield positions, magnitudes and velocities of the PN population in a single step. A reduction in observing time of about a factor 2 is attainable. We present here the proof-of-principle results.
keywords:
galaxies: individual (N5128, N1400) – galaxies: PN – galaxies: distances and kinematics – instrumentation: spectroscopy – planetary nebulae: general –1 Introduction
The dynamics of distant galaxies are often studied by measuring the radial velocity field of the integrated stellar light (e.g. optical observations using long-slit or Fabry-Perot) or of the associated gas (e.g. HI observations). This data is compared with models in order to derive information on structure and dynamics, or inverted to arrive at a three-dimensional model directly. Integrated light techniques, whether using absorption lines or emission lines, tend to be limited by surface brightness to about 1 effective radius (Re) from the nucleus. HI observations remain the most sensitive means of studying late-type galaxies but in general are not applicable to early-type (E - S0) galaxies owing to their paucity of gas. Moreover HI may not trace the same kinematics as the stellar component. The same remark applies to globular clusters – which for example while orbiting in the same gravitational potential as the stars may not, as a population, be rotating, while the galaxy as a whole is [Arnaboldi et al. 1994]. Measurements at large radii are important for numerous reasons. For example some galaxies exhibit, with respect to large-scale kinematics, counter-rotating or differentially-rotating cores. Kinematical conclusions based on only circumnuclear studies can be misleading: in NGC 1399 the rotational velocity falls to a minimum at about 20 arcsec from the centre [D’Onofrio et al. 1995] but on a larger scale the rotation is still increasing out to 200 arcsec [Arnaboldi et al. 1994] and a considerable fraction of the angular momentum is located outside 1Re.
The use of PN as radial velocity probes enables measurements over a larger extent, typically Re, in all galaxy types, and has a long and successful history. However, the usual procedure is to measure the flux and position of each PN by direct imaging and its radial velocity by the use of fibre spectroscopy. This is a time-consuimg sequence of operations and is prone to failure.
We propose, and have tested, a simpler technique called counter-dispersed imaging (CDI) in which the required information is obtained with just two narrow-band images. After reviewing the status quo we describe CDI in greater detail, including issues such as overal efficiency and the steps required for calibration. We present the results of proof-of-principle observations conducted some years ago (AAT) and make reference to more recent results (WHT). Mention is made of a dedicated instrument under development, but this paper is primarily intended to illustrate the use of the technique with existing instrumentation.
2 PN as tracers
2.1 Characteristics of PN populations
The PN appears to be a phase in the life cycle of all medium-mass stars and, independent of type or metallicity, no galaxy deficient in PN has yet been found. Most of the visible emission appears in a single line ([O III] at a rest wavelength of 5006.875Å). PN brightness in this line is commonly given in magnitudes according to:
| (1) |
where is in erg.cm-2s-1 and the constant is such that a star of the same magnitude would appear to be equally bright in a V-band filter. We will drop the numerical subscript. On theoretical grounds one expects the luminosity function to follow an exponential increase with increasing magnitude (Hui et al. 1993b eqn 2) but observations suggest a sharp cutoff at the bright end. Accordingly Ciardullo et al. (1989) introduced an empirical modification:
| (2) |
where the parameter m* defines the bright cutoff. For M31, Ciardullo et al. give the bright-end of the PNLF cutoff as M* = -4.48. The luminosity specific density of PN is not constant for all galaxies but does not differ greatly from the value determined by Hui et al. for NGC 5128 [Hui et al. 1993b]:
| (3) |
where reference is to the B-band luminosity. This is the number of PN in the top 2.5 mag of the PNLF, e.g. a M=-21 galaxy would have would have 1900 such PN.
2.2 Radial Velocity Measurements
The intrinsic linewidth of the [O III] feature being only about 21 km s-1, PN are ideal probes of galaxian velocity fields, which have dispersions much greater than this. In practice PN radial velocities can be determined by fibre spectroscopy to 10 km s-1. The high brightness in the [O III] line makes the PN easy to detect.
The other requirement in order to be useful as tracers is that the PN be abundant in sufficient number. To establish the velocity or the velocity dispersion to 25% accuracy requires 15 PN in a given projected area. Now for a galaxy at a distance of 10 Mpc Eqn 3 implies a total of PN in the top 2.5 mag of their brightness distribution. In a typical observation about twice this number could be expected to be detected. If we define spatial bins to be 60∘ in azimuth and 1 scale length (1/e in surface brightness) in radius then the number of PN per bin is around 20 at r=1Re and 10 at r=4Re. Although the projected density of PN falls in direct proportion to the surface brightness of the galaxy, the increasing size of the spatial bins partially compensates. Furthermore, although not taken into account here, the detection efficiency increases since the galaxy’s own background light is a major source of noise. Thus, PN will be present in sufficient numbers in very many situations, albeit not in galaxies of low surface brightness. Moreover it has been shown that important results (such as establishing the presence of rotation) can be obtained even with 60 PN [Arnaboldi et al. 1994]. The problem of obtaining three-dimensional velocity models from only radial velocities [Hui 1993a] is of course common to all techniques in current use.
2.3 Distance indicators
In addition to being a dynamical probe, the PN are a reliable secondary distance indicator through the ‘standard-candle’ use of the PNLF. This relies on the assumption that M* (§2.1) is a universal constant, which has been tested in a series of papers by Jacoby and colleagues (the latest being Feldmeier et al. 1997). For distance determination (and to a lesser extent kinematics) it is necessary to screen the luminosity function for unresolved HII regions, which appear similar to PN [Feldmeier et al. 1997].
3 Traditional observing technique
Detection of the PN in [O III] emission is usually done by imaging the field with on-band and off-band filters [Jacoby et al. 1992]. While continuum sources show up in both, PN show up only in the on-band image. For maximum sensitivity the on-band filter is no wider than need be to include the range of velocities required (if the systemic velocity is known) while the off-band filter can be considerably broader. Typically, therefore, if is the on-band integration time the total time required is . The positions of the PN then have to be determined to sub arcsecond precision (i.e. far more precisely than required by the science) in order to set up a subsequent observing campaign with multi-object spectroscopy. Aperture plates or, more recently, robotic fibre positioners are used. Estimating the observing time for the spectroscopy is difficult as it depends on many factors, such as the respective numbers of PN detected and available fibres per observation, but from cases in the literature it can be taken to be giving a total of about telescope time spread over two semesters.
4 Counter-dispersed imaging
4.1 Basic Idea
The principle of obtaining well-calibrated spectra of objects
in an extended field by the use of two counter-dispersed images
is not new. As early as 1947 Fehrenbach used pairs of objective prism plates
to obtain stellar radial velocities in this way.
At an IAU meeting in 1994
we proposed the use of a conventional slitless
spectrograph at the 5007Å [O III] line to obtain accurate PN radial
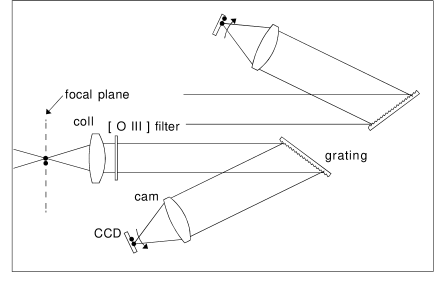
velocities in a galaxian field [1]. Rotating the
entire spectrograph (see Fig. 1)
has an analogous effect to rotating an objective
prism plate. The PN, which appear as point
sources against the dispersed background, are displaced in opposite
directions by an amount which is very nearly linear in radial velocity.
PN pairs, once they are found and uniquely matched up, yield relative
velocities with great accuracy.
In addition, we showed that the pairs of images could be obtained simultaneously, if desired, by either wavefront- or amplitude-splitting.
At a subsequent IAU meeting in 1996 we reported plans to build a dedicated
instrument [Douglas et al. 1997] and we are now participants in
a consortium to carry this out 111The PN Spectrograph project
is reported at
www.aao.gov.au/local/www/pns/pns.html.
4.2 Advantages
A properly designed (slitless) spectrograph will have an efficiency of about 70% that of a direct imager due to losses at the dispersive element. The CDI method of obtaining PN velocities requires only two observations, namely an on-band image at arbitrary PA and one at PA+180∘. The total integration time is therefore . This is roughly a factor two less than that traditionally required, and the two observations can usually be made during the same night. The true positions of the PN can easily be reconstructed from the two dispersed images, and the radial velocities can be found - to within a constant offset - by inspection. This velocity offset can be determined by ancillary calibration observations (e.g. of a galactic PN) but can also be found using an arc lamp (if a slit unit can be inserted for the purpose). Potentially, very accurate fluxes can be obtained since the filter profile can be determined during the night, at the f/ ratio and temperature appropriate to the observations and even as a function of position on the detector, from short exposures on foreground stars. It is more difficult to determine the filter characteristics in direct imaging.
4.3 Technical issues
1. Almost any medium-dispersion spectrograph can be modified
for CDI although the unvignetted field may be disappointingly
small if the spectrograph is not intended for multi-object work.
Over the small (Å) wavelength range required the
dispersion will be found to be very constant over the field, but the
same effect as causes arc lines to be bent will cause spurious
displacements - varying quadratically
with distance from an axis of symmetry parallel to the dispersion axis.
2. It is desirable that the dispersion not be too high because of two
undesirable effects: firstly, field is lost since PN which are dispersed
outside either image are rendered useless, and secondly,
foreground stars will produce unnecessarily large trails which
obliterate some of the field. Suitable values of the dispersion are
around 1Å/pixel. If the individual PN images can be centroided to an
accuracy of 0.4 pixels then the error in the differential shift is
about 0.56 pixels or 17 km s-1, while for a typical bandwidth of 60Å the
star trails are then an acceptable pixels in extent.
3.
To a first approximation the detection threshold for direct
imaging and for slitless spectroscopy - through the same
interference filter - is the same, provided that the PSF is
similar in each case. Since the galaxian light is dispersed
in the latter case it will be found that detection close to
the nucleus will be slightly improved and away from the
nucleus slightly worsened.
4.
In the case of fibre- or slit-spectroscopy of the individual PN the
background is much reduced when compared with slitless spectroscopy or
direct imaging. In practice a number of loss mechanisms come into play
which more than compensate for this gain, as is evident from published
results. A comprehensive discussion of this point is beyond the scope
of this paper.
5 CDI with existing instrumentation
5.1 Trial observations
We modified the RGO spectrograph at the 3.9 m Anglo-Australian telescope to establish the proof-of-principle and to test the CDI mode of operation. This took place in discretionary time in January 1995. This run is reported in more detail below. During a subsequent observing campaign at the William Herschel Telescope (April 1997) the dual-beam ISIS spectrograph was modified in such a way that it provided a dispersed [O III] image and, simultaneously, an undispersed H image. In addition, comparison data were taken in CDI mode. These observations are reported in Kuijken et al. 1998.
5.2 Instrument configuration
The RGO spectrograph was used with the 82 cm focal length camera and the 1200J grating in m=2 with blaze to collimator; the plate scale was 0.236 arcsec/pixel (determined from DSS stars) and using this value and the known grating geometry the linear dispersion was calculated to be 0.11069 Å/pixel. Note that no slit was used. The [O III] filter was 5016/25. The total efficiency during periods of good visibility was calculated from the following estimates, based on data from various sources: atmosphere: 0.83, telescope: 0.7, spectrograph optics: 0.42, grating: 0.57, filter: 0.6 and CCD: 0.59, giving 0.05 total efficiency.
5.3 Observations
| Field | PA | Date (1995) | Exposure time |
|---|---|---|---|
| mac 2-1 | 90 | January 25 | 20s; 120s |
| NGC 1400 | 90 | January 25 | 1800s |
| NGC 1400 | 270 | January 25 | 2x1800s |
| NGC 1400 | 90 | January 25 | 1800s |
| mac 1-2 | 90 | January 25 | 40s |
| NGC 5128 | 90 | January 25 | 1800s |
| NGC 5128 | 270 | January 25 | 2x1800s |
| NGC 5128 | 90 | January 25 | 1600s; 2x900s |
| NGC 1400 | 270 | January 26 | 1800s |
| NGC 1400 | 90 | January 26 | 2x1800s |
| NGC 1400 | 270 | January 26 | 1500s |
| NGC 5128 | 270 | January 26 | 480s;1800s |
| NGC 5128 | 90 | January 26 | 2x1800s |
| NGC 5128 | 270 | January 26 | 1800s;1500s |
| NGC 5128 | 90 | January 26 | 1500s |
| mac 1-2 | 90 | January 26 | 5x40s |
Instrument was operated as shown schematically in Fig 1. Weather permitting, we attempted to observe in the sequence A-B-B-A to minimise the effect of changes. In order to have reference data we observed the well-studied galaxy NGC 5128 (field F42 of Hui et al. 1993b) as well as NGC 1400, an E-S0 type of unknown distance. For flux calibration we observed the Galactic PN mac2-1 and mac1-2. The observing log is presented in Table 1. The weather was poor during most of the run and the atmospheric transparency variable. Many of the listed exposure times are, for this reason, only nominal. The summed data in each of the two counter-dispersed images corresponded to an estimated 2.0 - 2.5h observing time. Several exposures were not be used and reliable photometric results were not attainable. Seeing varied up to 1.6”.
5.4 Reduction
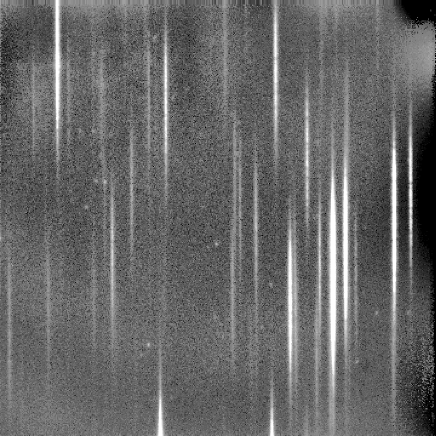
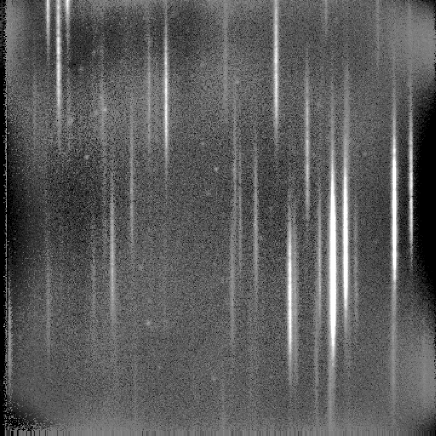

The data were reduced in IRAF using standard procedures for bias subtraction and pixel-to-pixel variation. The strong vignetting pattern of the spectrograph was estimated from sky flats and an appropriate correction was applied - note that this is only approximate since the final position of a PN in the dispersed image is a function both of position in the field and wavelength. No attempt was made to improve the photometric correction after the ‘true’ positions were reconstructed since we were not interested in high photometric accuracy. Two dimensional, 6th order Legendre polynomial fits were made to the background intensity which included sky and galaxy contributions, and subtracted. The individual images at each PA were shifted into registration by centroiding stellar absorption lines. This involves spectral fitting in the dispersion direction (Y in Fig. 2) and gaussian fitting of the continuum intensity in the perpendicular direction (X in Fig. 2). The frames were then averaged using weights based on signal-to-noise ratio and using imcombine.crrej to reject cosmic ray events. Simple median filtering was problematical because of the strong variation in signal caused by weather. For simplicity of analysis one of the two final images was rotated by 180∘.
Image registration was made difficult in the case of NGC 1400 because the field contains only two stars, both lacking in spectral features. Individual PN were not visible on single frames (for either galaxy) so these could not be used as markers. A crude estimate of the required shift was made by fitting the entire dispersed image of the two stars and a small range around this nominal shift was then explored for signal.
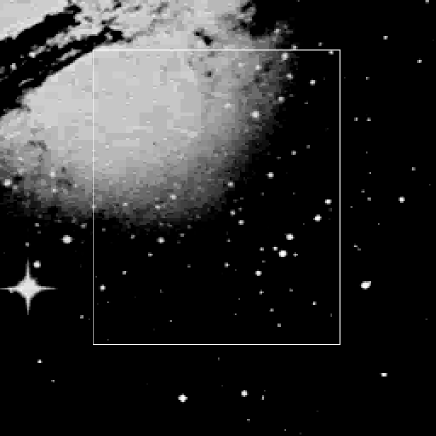
The co-added CDI frames for NGC 5128/F42 are shown in Fig. 2. To establish astrometric coordinates a pseudo-image was created in which a stellar object represented the mean position of a star trail between the two frames. This could be done very accurately by fitting absorption lines. For each star trail three lines were used, the mean position of each line giving one estimate. The reconstructed (partial) stellar image shown in Fig. 3. Note that the relative positions of the stars within this ‘constellation’ depends only on plate scales in X and Y and is quite independent of dispersion and of the wavelengths of the absorption features. These stars were identified on the digitised sky survey (also shown in Fig. 3) and their RA and dec used to derive the plate transformation. Similarly, after locating the point sources in the counter-dispersed images and assigning them into pairs, each corresponding to a PN, their ‘true’ positions were reconstructed by averaging.
5.5 Results
| I.D. | (2000) | (2000) | Vrad | ″() | ″() | Vrad |
|---|---|---|---|---|---|---|
| ———- this paper ———- | — Hui et al. — | |||||
| 4221 | 13:25:08.93 | -43:03:53.64 | 605 | 08.90 | 54.1 | 633 |
| 4228 | 13:25:08.34 | -43:04:52.53 | 585 | 08.55 | 58.5 | n/a |
| 4211 | 13:25:11.26 | -43:03:07.97 | 330 | 11.22 | 08.6 | 344 |
| 4216 | 13:25:13.69 | -43:04:30.78 | 645 | 13.69 | 31.5 | 645 |
| 4208 | 13:25:14.17 | -43:04:54.99 | 758 | 14.18 | 55.8 | 765 |
| 4204 | 13:25:16.45 | -43:04:03.28 | 656 | 16.42 | 04.1 | 645 |
| 4222 | 13:25:16.85 | -43:04:12.12 | 488 | 16.83 | 12.5 | 523 |
| 4201 | 13:25:19.90 | -43:05:28.92 | 234 | 19.92 | 30.3 | n/a |
| 4213 | 13:25:20.25 | -43:05:13.63 | 736 | 20.28 | 14.6 | 732 |
| 4202 | 13:25:22.05 | -43:03:21.06 | 619 | 21.99 | 22.1 | n/a |
| 4206 | 13:25:22.50 | -43:03:21.82 | 584 | 22.44 | 22.6 | 599 |
| 4205 | 13:25:22.97 | -43:03:45.55 | 438 | 22.94 | 46.6 | 447 |
| 4241 | 13:25:16.12 | -43:05:11.95 | 511 | 16.17 | 12.9 | 520 |
| 4279 | 13:25:16.54 | -43:05:04.53 | 391 | 16.58 | 04.5 | n/a |
| 4207 | 13:25:23.27 | -43:02:50.29 | 526 | 23.19 | 51.2 | 527 |
| 4240 | 13:25:16.29 | -43:05:59.95 | 521 | 16.33 | 61.1 | 503 |
| 4209 | 13:25:22.62 | -43:02:44.52 | 662 | 22.52 | 45.4 | 675 |
| 4214 | 13:25:15.38 | -43:03:03.35 | 628 | 15.29 | 04.0 | 624 |
| 4210 | 13:25:18.59 | -43:02:20.99 | 716 | 18.50 | 21.8 | 685 |
| 4231 | 13:25:15.29 | -43:02:48.78 | 483 | 15.20 | 49.0 | 440 |
| 4248 | 13:25:17.18 | -43:02:51.34 | 621 | 17.10 | 51.9 | 599 |
| 4236 | 13:25:17.11 | -43:03:41.65 | 558 | 17.07 | 42.5 | 565 |
| 4263 | 13:25:11.49 | -43:03:50.57 | 560 | 11.44 | 51.0 | 577 |
| 4255 | 13:25:18.36 | -43:03:04.43 | 695 | 18.30 | 04.8 | 664 |
In NGC 5128/F42 we detected 24 PN (i.e. at both PA).
Our results
are shown in Table 2. We discuss how these were
obtained and estimate errors in the following subsections:
Positions After
applying the plate transformation just mentioned we arrive at the
RA and dec as shown. Also shown are the
positions as listed by [Hui et al. 1993c] and the ID number they
ascribed to individual PN. Our positions mostly agree to within 0.5″,
proving that adequate astrometry is obtained just by averaging the
coordinates found at the two PA. Radial velocity information is
not required for this step,
even for the stars used to derive the plate transformation.
Velocities
From the dispersion coordinate (Yi, in pixels) in the counter
dispersed images the radial velocity can be derived from the formula V =
0.5*(Y1-Y2)**C/ + V0. Here C and (5007Å)
have their usual meanings, is the dispersion and V0 is an offset.
These last two parameters would normally be obtained by
calibration observations
of a spectral lamp and slit, but this was not possible with the RGO
spectrograph as the slit unit had to be
removed for the run. Calibration on a foreground star or
galactic PN of known
velocity would have been possible but in the absence of a slit any
error arising due to pointing or to flexure would have been difficult
to determine.
Instead we calculated
from the spectrograph properties and left
V0 as a free parameter to be determined by comparison
with the reference data. Before doing this, a small but
important correction was made to eliminate the effect
of ‘spectral curvature’, i.e. the bending of the image of a slit
due to off-axis angle () at the spectrograph grating.
In our case 0.8∘at the edges of the CCD
(left and right in Fig. 2)
leading to a spurious shift of about 4.8 pixels in the dispersion
direction. Owing to the CDI geometry the effect is additive in (Y1-Y2),
appearing as a velocity offset of 64 km s-1.
The best fit to the results of [Hui et al. 1995] required V0 = 467 km s-1and
the best fit dispersion was = 0.1107 Å/pixel, exactly as calculated
from first principles. The error in our velocity determination is
determined by three factors:
1. the dispersion calibration - this is well-known for the RGO
spectrograph, is constant over the field, and is confirmed by the
agreement mentioned in the previous paragraph.
2. errors in centroiding - this is easily checked by comparing
our astrometric determinations with those from direct imaging and
is found to be of the order
0.5”. This corresponds formally to km s-1.
The r.m.s. difference between our results and the
reference data is 19.1 km s-1, about twice the 1 error
claimed by [Hui et al. 1995].
Photometry The system efficiency was 0.05, as found by
observation of the Galactic PN Mac 1-2. However the average
transparency during our integrations was about 50%, as estimated from
the magnitudes of the PN actually observed. For example PN #4204
has a flux of 1,390 in 1800s in our data. Hui et al. (1993c) ascribe it , from which we deduce an overall efficiency for our system of
0.025.
In the field centred on NGC 1400 we detected no PN in approximately the same integration time as that spent on NGC 5128 (hr). Although the difficulty in co-adding the integrations is a complication, considerable effort was expended in searching for the correct shifts (only one direction is undetermined) and therefore this is not felt to be the cause of the non-detection. The simplest explanation is that the brightest PN in NGC 1400 are fainter than our detection limit of , putting NGC 1400 at a distance of 8.6 Mpc or greater. This is consistent with the result that NGC 1400 is a member of the NGC 1407 group [Gould 1993].
6 Discussion
In field F42 Hui et al. (1995) detected 134 PN in a narrow-band image with a 1hr integration (not including the time for the off-band image) with 1″seeing. In the unvignetted part of the RGO field (about 45%) we would expect to have seen about 60 PN at the same sensitivity. We integrated for 3hr at each PA but with a system efficiency of 0.025 as opposed to 0.3 (estimated) for direct imaging. Thus, our limit was approximately 1.5 mag poorer. Our detection of 24 PN is therefore consistent with the published luminosity function [Hui et al. 1993b], which has approximately 0.4 of the PN more than 1.5 magnitudes above the faint cutoff. From this one could infer that the detection efficiency of the (slitless) spectrograph would be equal to that of direct imaging, given equal system efficiency. Actually the RGO spectrograph has such high dispersion, and the field so many foreground stars, that approximately 20% of the CCD is obliterated by dispersed stellar light. Apart from this, largely avoidable difference, we believe the foregoing statement to be correct.
In contrast to the 1hr identification exposure, several hours of multi-fibre spectroscopy were required on each field to complete the observations [Hui et al. 1995]. Although fibre-fed spectrographs constinue to improve, this phase of the observation still remains many time less efficient than the detection phase. The advantage of counter-dispersed imaging is that only a second slitless image is required.
It has been proven that CDI is a straightforward method of detecting the PN population of an external galaxy and of determining their positions and radial velocities. If required, there is no doubt that accurate photometry can be obtained although this was not demonstrated here due to the poor observing conditions. A dedicated CDI instrument would return the data required for the analysis of kinematics and for PNLF distance determinations in a single observation and with an efficiency times better than hitherto possible.
Acknowledgments
NGD performed part of this work while on sabbatical leave at the Anglo-Australian Observatory and the Anglo-Australian Telescope was used to obtain data, with thanks to R. Cannon for discretionary time. We made use of the NASA/IPAC Extragalactic Database (NED) which is operated by the Jet Propulsion Laboratory, California Institute of Technology, under contract with the National Aeronautics and Space Administration. Thanks to Guy Monnet (ESO) for references to Fehrenbach’s work.
References
- [Arnaboldi et al. 1994] Arnaboldi, Freeman, Hui, Capaccioli & Ford, 1994, ESO Messenger 76, 40
- [Ciardullo et al. 1989] Ciardullo R., Jacoby G.H., Ford H.C., Neil J.D., 1989, Ap J 339, 53
- [D’Onofrio et al. 1995] D’Onofrio, M., Zaggia, S. R., Longo, G., Caon, N., Capaccioli, M., 1995, A&A, 296, 319
- [Douglas et al. 1997] N.G. Douglas, K. Taylor, K.C. Freeman & T.S. Axelrod, 1997, I.A.U. Symposium No 180: Planetary Nebulae, Habing H.J. & Lamers H.J., eds, 493
- [Fehrenbach 1947] Fehrenbach C., 1947, Annales D’Astrophysique 10, 257
- [Feldmeier et al. 1997] Feldmeier et al. 1997 ApJ 479, 231
- [Gould 1993] Gould A., 1993, ApJ 403, 37
- [Hui 1993a] Hui X., 1993a, PASP, 105, 1011
- [Hui et al. 1993b] Hui X., Ford H.C., Ciardullo R., & Jacoby G.H., 1993b, ApJ, 414, 463
- [Hui et al. 1993c] Hui X., Ford H.C., Ciardullo R., & Jacoby G.H., 1993c, ApJS, 88, 423
- [Hui et al. 1995] Hui X., Ford H.C., Freeman K.C. & Dopita M.A., 1995, ApJ, 449, 592
- [Jacoby et al. 1992] Jacoby et al., 1992, PASP, 104, 599
- [Kuiken et al. 1998] Kuiken, Merrifield, Douglas, Gerritsen t.b.p.
- [1] K. Taylor & N.G. Douglas, 1995, I.A.U. colloquium 149: Tridimensional Optical Spectroscopic Methods in Astrophysics, Comte G. & Marcelin M., eds, ASP Conference Series, Vol 71, 33