SBF Distances to Dwarf Elliptical Galaxies in the Sculptor Group
Abstract
As part of an ongoing search for dwarf elliptical galaxies (dE) in the vicinity of the Local Group (Jerjen et al. 1998a), we acquired deep and -band images for five dE candidates identified on morphological criteria in the Sculptor (Scl) group region. We carried out a surface brightness fluctuation (SBF) analysis on the -band images to measure the apparent fluctuation magnitude for each dE. Using predictions from stellar population synthesis models (Worthey 1994) giving values in the narrow range between to , the galaxy distances were determined. All of these dE candidates turned out to be satellites of Scl group major members. A redshift measurement of the dE candidate ESO294-010 yielded an independent confirmation of its group membership: the [O III] and Hα emission lines from a small H II region gave a heliocentric velocity of 117() km s-1, in close agreement with the velocity of its parent galaxy NGC 55 (v km s-1). The precision of the SBF distances (5 to 10%) contributes to delineating the cigar-like distribution of the Scl group members, which extend over distances from 1.7 to 4.4 Mpc and are concentrated in three, possibly four subclumps. The Hubble diagram for nine Scl galaxies, including two of our dEs, exhibits a tight linear velocity–distance relation with a steep slope of 119 km s-1 Mpc-1. The results indicate that gravitational interaction among the Scl group members plays only a minor role in the dynamics of the group. However, the Hubble flow of the entire system appears strongly disturbed by the large masses of our Galaxy and M31 leading to the observed shearing motion. From the distances and velocities of 49 galaxies located in the Local Group and towards the Scl group, we illustrate the continuity of the galaxy distribution which strongly supports the view that the two groups form a single supergalactic structure.
1 INTRODUCTION
It is notoriously difficult to determine distances to dwarf elliptical galaxies (hereafter dEs, subsuming “dwarf spheroidals”, cf. Ferguson & Binggeli 1994). Their low gas content rules out HI 21 cm-line observations, and their low surface brightness makes optical spectroscopy feasible only for the very brightest members of the class. Most of the available redshifts of dEs are for galaxies in the Virgo cluster (Binggeli et al. 1993) and the Centaurus cluster (Stein et al. 1997), and reflect peculiar velocities rather than individual distances within the cluster. But in clusters there is no real need for individual distances: dEs are so abundant and strongly clustered (see, e.g., Binggeli et al. 1987 for Virgo, or Thompson & Gregory 1993 for Coma) that they must lie near the mean distance of the cluster.
In poor groups and the field, where the distribution of dEs is sparse, individual distance information is absolutely indispensable. (We recall that true “field” (i.e. isolated) dEs are apparently very rare: cf. Binggeli et al. 1990). Here the only way to locate a diffuse, dwarf-like system and thus to unveil its physical nature is to estimate its distance.
For nearby dE candidates, it is possible to resolve the stellar population and derive the distance from a deep colour-magnitude diagram (CMD, e.g. Da Costa et al. 1996, Smecker-Hane et al. 1996, Stetson 1997), or from the tip of the red giant branch (TRGB, Lee et al. 1993, Caldwell et al. 1998). These methods are costly and time consuming. With HST, the CMD method is feasible out to 4 Mpc, and the TRGB method out to 12 Mpc. Alternatively, the surface brightness-magnitude relation of dEs (e.g. Binggeli & Cameron 1993, Jerjen & Binggeli 1997) can be used to estimate the distance of a dE out to perhaps 50 Mpc. However, the uncertainty (1) in the distance modulus for a single galaxy is large, typically 0.7 mag, corresponding to a 40% distance error. Young & Currie (1995) claimed that this error can be reduced to 0.4 mag (comparable to the accuracy of the Tully-Fisher method) with a similar relation based on the shape of the dE luminosity profile, but this claim appears to be incorrect (Binggeli & Jerjen 1998).
Here we show that the well-known surface brightness fluctuation (SBF) method can be used to determine distances to dwarf ellipticals in the intermediate distance range of 1–10 Mpc (and possibly beyond) with an accuracy of a few percent. The SBF method was introduced by Tonry & Schneider (1988, hereafter TS88) to measure distances to bright elliptical (E) galaxies. The method is based on the discrete sampling of a galaxy image with a CCD detector and the analysis of the resulting pixel-to-pixel variance caused by unresolved stars. For a detailed description of the method the reader is referred to TS88 and Jacoby et al.(1992). Application of the SBF method was subsequently extended to bulges of spiral galaxies (Tonry 1991, Luppino & Tonry 1993) and to globular clusters (Ajhar & Tonry 1993). A massive SBF observing programme is in progress to improve the cosmic distance scale (Tonry et al. 1997).
The first, and up to now only, application of the method to dwarf ellipticals is due to Bothun et al. (1991) who observed the fluctuations in very large, nearly flat, low-surface brightness galaxies (a special type of dEs) in the Fornax cluster of galaxies. We show here that the SBF method is particularly well suited for dEs at a distance of a few Mpc – slightly beyond the distance where the galaxies would be resolved into stars.
In this paper we present a pilot SBF analysis for five dwarf ellipticals in the nearby Sculptor (Scl) group, also known as the South Polar group. These galaxies have recently been identified in an extensive survey of the southern Scl and Centaurus A (Cen A) groups for faint dE members (Jerjen et al. 1998a: JBF98a). Special care has been taken with the calibration of the fluctuation magnitude , because the stellar population of dwarf ellipticals is quite distinct from that of the brighter ellipticals. In fact, even among the local dwarf spheroidals there is a wide range of star formation histories. Nevertheless, we find that is sufficiently robust against such variations, at least for stellar systems dominated by old populations, and propose a first estimate of for dEs.
We will show that the SBF distances derived for the five dEs (between 1.7 and 4.4 Mpc), unambiguously identify these objects as Sculptor group members. Moreover, the dwarfs neatly fall into place with the known substructure of the group. We demonstrate the great potential of the SBF method applied to dEs as a tool to map the supergalactic structure in the local volume (out to the Virgo cluster). With our enlarged Scl sample, we re-analyse the 3D distribution of these galaxies and confirm earlier findings (Tully & Fisher 1987, Binggeli 1989) that the Sculptor complex has a prolate structure and is part of a much larger cloud of galaxies which includes the Local Group (LG). The SBF results for the dE sample from our Cen A group survey will be published elsewhere (Jerjen et al. 1998b: JFB98b).
2 SAMPLE
Following Côté et al.’s (1997, hereafter C97) successful search of the Scl group region for faint new dwarf irregular members, we conducted a similar visual search for faint dE candidates using the same plate material. Seven very diffuse objects were identified which had dE-like morphology and which were thus suspected to be dwarf spheroidal members of the Scl group (for the details of this survey, see JBF98a). Subsequent CCD imaging in the and bands showed two of these objects to be irregulars or background galaxies. The five remaining galaxies of early-type morphology are the subject of the present SBF analysis. They are listed in Table 1 with their basic photometric properties from JBF98a.
| Galaxy | Type | RA | DEC | AB | |||||
|---|---|---|---|---|---|---|---|---|---|
| (2000) | (2000) | mag | arcsec | mag arcsec-2 | mag | mag | mag | ||
| (1) | (2) | (3) | (4) | (5) | (6) | (7) | (8) | (9) | (10) |
| NGC 59 | dS0 | 00 15 25.1 | 21 26 38 | 11.90 | 25.9 | 21.0 | 1.07 | 0.09 | 1.04 |
| Scl-dE1 (SC2211Name from Côté et al. (1997) ) | dE | 00 23 51.7 | 24 42 18 | 16.94 | 19.3 | 25.4 | 0.79 | 0.06 | 0.77 |
| ESO294-010 | dS0/Im | 00 26 33.4 | 41 51 19 | 14.36 | 20.3 | 22.9 | 1.17 | 0.03 | 1.16 |
| ESO540-030 | dE/Im | 00 49 21.1 | 18 04 34 | 15.54 | 21.5 | 24.2 | 0.83 | 0.10 | 0.79 |
| ESO540-032 | dE/Im | 00 50 24.5 | 19 54 23 | 15.36 | 25.0 | 24.4 | 1.08 | 0.09 | 1.05 |
The photometric parameters span a wide range in total magnitude (, column 5), effective radius which contains half of the total light (, column 6), and mean surface brightness within the effective radius (, column 7). To get the extinction-corrected colour (column 10) the foreground reddening E() was determined from the dust maps of Schlegel et al. (1998) and converted with the ratio . Further details about the photometric data can be found in JBF98a.
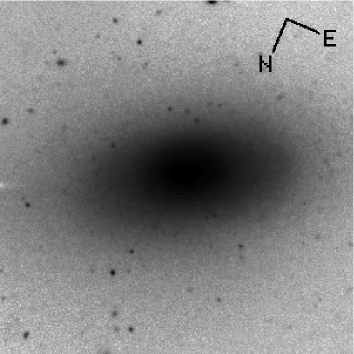
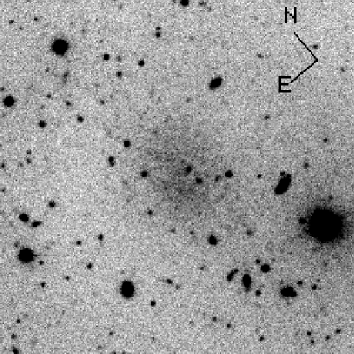
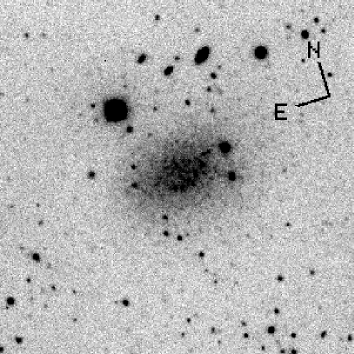
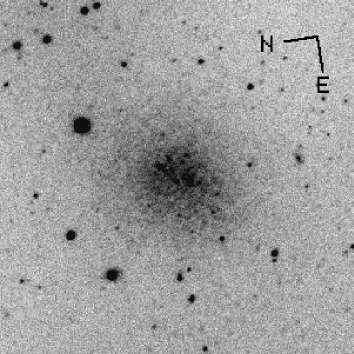
Images of the dwarfs are shown in Figs. 1 and 2, and the classifications given in column 2 of Table 1. There is some morphological variety among early-type dwarfs (cf. the atlas of Virgo cluster dwarfs by Sandage & Binggeli 1984). At the bright end of the luminosity function, there is a variant of the pure dE which was named dS0, because it is often distinguished by a S0-like, two-component structure (see also Binggeli & Cameron 1991). NGC 59 is clearly of this type, ESO294-010 arguably so. At fainter magnitudes, dEs (dwarf spheroidals) are often hard to distinguish from smooth irregulars of type Im V. In fact, there may be a true evolutionary transition between gas-rich irregulars and gas-poor dEs (e.g. Ferguson & Binggeli 1994). Dwarfs with a mixed morphology (appearing too smooth for a plain Im, but too lumpy for a pure dE) were called “intermediate” or “ambiguous” and classified dE/Im (Sandage & Binggeli 1984). A well-known local example is the Phoenix dwarf system (Van de Rydt et al. 1991).
Three of our objects seem to fall in this class and are classified accordingly. ESO540-030 and ESO540-032 show a sprinkle of resolved stars in their central regions. These stars may mark the presence of a small population of young stars. ESO294-010, on the other hand, appears slightly lumpy in the centre (see Fig.2). Subsequent spectroscopy (in Sec.6) showed emission lines, so this is a clear example of a mixed type. But even the smoothest dEs probably contain small amounts of intermediate-age or young stars; this we know from the local dwarfs (cf. Sec.5). Note also that the colours of our objects (with , cf. column 10 of Table 1) are rather blue for dEs, whose values range from 0.5 to 2.3 (e.g., Evans et al. 1990). So the morphological deviations from a pure dE are simply the manifestation of an underlying variety in the (unresolved) stellar populations. One of the principal results of the present paper is that this variety does not cause difficulties for the application of the SBF method to dEs, because the fluctuation magnitude turns out to be rather insensitive to variations in the stellar contents within the observational constraints (Sec.5). In the following we will use the term “dE” in a loose way, including all of the morphological variants discussed above.
3 Imaging
The galaxies were observed in two runs, on September 11–15, 1996, and August 28–30, 1997, using the imager at the Nasmyth B focus of the 2.3m ANU telescope at Siding Spring Observatory. The detector was a Tek 1k1k thinned CCD with a pixel size of 24m, yielding a scale of 0.6′′ pixel-1 and a 6.7′ diameter circle field of view. The CCD gain was 1 e-/ADU and the readout noise was 7 e-. We observed in the Kron-Cousins -band, because our application of the SBF technique differs from previous studies which used or ; we are working on small, low-surface brightness objects so our data are photon-limited by the sky rather than by the galaxy itself. The sky is significantly fainter in than in relative to the RGB stars which produce the surface brightness fluctuations [=1.5 versus =0.8]. Another advantage of the filter is to avoid fringing which occur with thinned CCDs beyond 7000Å.
Weather conditions were photometric and the seeing measured between . For each of our galaxies a series of 4 to 5 exposures were taken each randomly offset by and of 450 to 600 sec duration, giving a total integration time of 1800 to 3000 sec. Flat fields were obtained every night from exposures of the morning and evening sky. Standard stars of Graham (1982) were observed throughout each night for the photometric calibration.
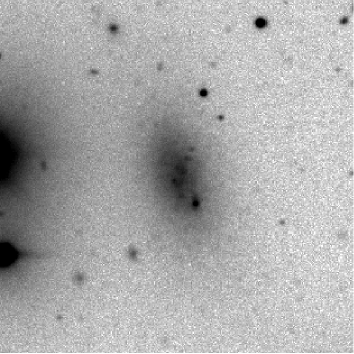
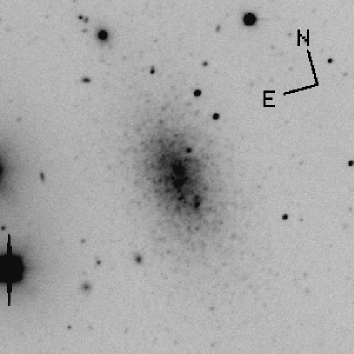
Processing of the CCD frames with IRAF was carried out in the usual manner. The overscan region provided the bias level, which was subtracted from the frame. Next, each science frame was flattened with a master twilight-sky flat, constructed from a median of 5–9 sky flats taken during the same night. All reduced frames were flat to 0.1%. The sky was modelled by fitting a plane to selected star-free areas well away from the galaxy. While sky determinations can be quite difficult for giant ellipticals due to their extended halos and galaxy sizes comparable to the field of view, this is simple in our case. Finally, the sky subtracted images of a galaxy were registered and combined to a master frame in order to increase the signal-to-noise ratio and to remove artifacts, bad pixels, and cosmic rays. In Fig.1 we show the processed -band images for four of our galaxies. and -band images of ESO294-010 are shown in Fig.2.
4 SBF ANALYSIS
To prepare the master frames for the SBF analysis we essentially followed the procedure described in TS88. First, we employed DAOPHOT (Stetson 1987) routines to identify point sources which would disturb a 2D-fit of the mean galaxy light distribution. Because of the small size of the galaxies and the high galactic latitude, there is only little contamination by foreground stars and background galaxies. Globular clusters are also a minor problem here, because globular clusters are rare in faint dwarf galaxies. However, as mentioned in Sec.2, two of our galaxies, classified as dE/Im, are contaminated with a few bright stars of their own. These also had to be removed.
All identified point sources were replaced by a nearby patch of galaxy of the same surface brightness. Isophotes were computed for the cleaned galaxy image by fitting ellipses with variable radius, ellipticity, and position angle. These were used to model the mean galaxy surface brightness distribution, which was then subtracted from the original master frame. To normalise the variance amplitude of the stellar fluctuations across the residual image, we divided the residual image by the square root of the mean galaxy surface brightness distribution.
For each galaxy the SBF analysis was carried out on two different square subimages (field 1 and 2) with size between 30 to 60 pixels which were selected within the 27.5 mag arcsec-2 isophote. The overlap of the fields was kept as small as possible (%) to get independent distance measurements. Special care was further taken to choose subimages with only few () resolved point sources, galaxies, or other features DAOPHOT formerly had identified. For example, the H II region of ESO294-010 (see Sec.6 for more details) was excised from the analysis. Remaining objects in the subimages were replaced by uncontaminated patches (i) randomly selected from the region outside of the subimage area and (ii) in the same surface brightness range. This patching process was employed as alternative to the masking method described in TS88. The idea was to replace the few disturbed image parts with patches carrying the fluctuation signal. As artificial periodicities and poor signal-to-noise data could be introduced in this way it is crucial to take into account criteria (i) and (ii). The number of pixels corrected never exceeded 5% of the total subimage area. Experiments showed that, at this percentage level, the patching method is uncritical for the signal we intend to measure.
At this stage of the procedure, we have images whose main sources of variance are the stellar fluctuations and a photon shot noise that is nearly uniform over the image (the CCD readout noise is negligible). To disentangle the two components we Fourier-transformed the cleaned subimages and analysed their power spectra (PS), which are shown in Fig. 3. Having calculated the PS of the Point Spread Function (PSF) from well isolated stars on the master frame, the observed PS of the galaxy was modelled as a weighted combination of a PSF-convolved component and a constant white-noise component:
| (1) |
The free parameters and (the two weights) were determined by a least-squares fit of Equ.1 to the data. The fit was restricted to wave numbers to exclude the range which is affected by the galaxy subtraction. The result of this decomposition for every galaxy field is shown in Fig. 3.


The quantity is directly linked to the apparent fluctuation magnitude which is the luminosity-weighted average stellar luminosity of the stellar population and is approximately the apparent magnitude of a giant star in the galaxy which contributes to the SBF signal:
| (2) |
The system (telescope-filter-detector)-related quantity is the magnitude of a star yielding 1 ADU per second on the CCD, and is the exposure time of the observation.
From theory (TS88), we expect to be the variance of the photon shot noise divided by the square root of the number of exposures:
| (3) |
where is the flux from the sky ( mag arcsec-2 at new moon) and is the mean surface brightness of the galaxy on the subimage (in counts). That Equ.3 is approximately fulfilled can easily be verified from Table 2 where all relevant parameters are listed.
The sky brightness of individual images varied a few percent due to changes in the airglow intensity during the night. Column 6 gives the average sky value we measured for each series of images. The indicated error corresponds to the uncertainty in the sky flatness of the masterimage.
| Galaxy | exp time | seeing | AR | |||||||
|---|---|---|---|---|---|---|---|---|---|---|
| mag | sec | arcsec | counts | counts | counts | counts | mag | mag | mag | |
| (1) | (2) | (3) | (4) | (5) | (6) | (7) | (8) | (9) | (10) | (11) |
| NGC 59 F1 | 24.30 | 5450 | 1.4 | 836 | 4166(8) | 34.9(1.7) | 2.7(0.1) | 27.08(0.06) | 0.06 | 27.02(0.06) |
| F2 | 706 | 33.3(1.8) | 3.5(0.1) | 27.12(0.06) | 27.06(0.06) | |||||
| Scl-dE1 F1 | 24.31 | 5600 | 1.5 | 101 | 4456(11) | 131.1(16.5) | 18.5(0.4) | 25.96(0.13) | 0.04 | 25.92(0.13) |
| F2 | 77 | 118.8(19.7) | 26.5(0.5) | 26.08(0.17) | 26.04(0.17) | |||||
| ESO294-010 F1 | 24.30 | 4450 | 1.5 | 329 | 3572(7) | 234.3(15.1) | 5.9(0.4) | 25.00(0.07) | 0.02 | 24.98(0.07) |
| F2 | 234 | 214.0(13.8) | 10.7(0.5) | 25.11(0.07) | 25.09(0.07) | |||||
| ESO540-030 F1 | 24.32 | 5450 | 1.5 | 193 | 3769(6) | 62.0(4.4) | 9.7(0.3) | 26.47(0.07) | 0.06 | 26.41(0.07) |
| F2 | 96 | 65.8(7.4) | 24.5(1.0) | 26.41(0.11) | 26.35(0.11) | |||||
| ESO540-032 F1 | 24.27 | 5450 | 1.3 | 123 | 4146(17) | 112.9(17.0) | 12.8(0.5) | 25.77(0.15) | 0.06 | 25.71(0.15) |
| F2 | 95 | 151.0(28.2) | 16.3(0.6) | 25.46(0.19) | 25.40(0.19) |
The error of a measurement is dominated by the fitting error and the error in the sky value. While the first accounts for 5–9% in all cases, the latter effect depends on going from a negligible 1% for the fields of NGC 59 to 18% for ESO540-032 where the galaxy counts are few. Other possible sources of errors are the PSF normalisation and the shape variation of the stellar PSF over the CCD area. Using different bright stars as template for the PSF power spectrum we found the derived of a field changed by only 1–3%. Column 7 of Table 2 gives the values of together with the combined error from all discussed sources. Assuming further an accuracy in photometry to mag (column 2) and a random extinction error at the South Galactic Pole of mag, we get an overall uncertainty for of 0.06 to 0.19 mag (column 11). The error-weighted mean of for each galaxy derived from the two independent fluctuation magitude measurements are given in column 2 of Table 3.
| Galaxy | D | ||||
|---|---|---|---|---|---|
| mag | mag | Mpc | mag | mag | |
| (1) | (2) | (3) | (4) | (5) | (6) |
| NGC 59 | 27.04(0.04) | 28.21(0.07) | 4.39(0.15) | ||
| Scl-dE1 | 25.96(0.10) | 27.13(0.12) | 2.67(0.16) | ||
| ESO294-010 | 25.04(0.05) | 26.17(0.08) | 1.71(0.07) | ||
| ESO540-030 | 26.39(0.06) | 27.52(0.08) | 3.19(0.13) | ||
| ESO540-032 | 25.59(0.12) | 26.72(0.13) | 2.21(0.14) |
5 CALIBRATION AND SBF DISTANCES
We chose to use -band observations (instead of the usual or ) to avoid fringing effects on thinned CCDs and to take advantage of the relatively darker sky. However, the drawback with this filter at present is the missing empirical calibration of in this photometric band. Most of the SBF applications have focussed on the -band (e.g. Tonry et al. 1989, 1990; Tonry 1991; Tonry et al. 1997) and -band (e.g. Luppino & Tonry 1993; Pahre & Mould 1994; Jensen et al. 1996). But even working in the -band would not help in our case because all galaxies analysed to date are high-surface brightness, giant ellipticals, while our objects are low-surface brightness, dwarf galaxies. The two classes are quite different in almost all of their properties, including stellar composition, although these differences are by no means well understood (e.g., Ferguson & Binggeli 1994). In particular, strongly depends on the underlying stellar population of a galaxy, and it would be unclear how to adapt empirical results from E galaxies to dEs.
To bypass this problem, we constructed a mean for dEs by applying stellar population synthesis models to the local, resolved dwarf spheroidals. A recent comparison between theory and empirical results (Tonry et al. 1997) found very good agreement in the -band when using the model predictions of Worthey (1993a, 1993b, 1994). We therefore used Worthey’s on-line program111http://astro.sau.edu/ worthey/ to calculate values for various photometric bands and different stellar mixtures composed of a series of single-burst stellar populations. For this procedure each population requires a set of input parameters: mean metal abundance, age, relative mass weight, and the slope of the IMF.
To use the program, we first had to estimate the metal abundance of the dEs. For this we used the observed [Fe/H]–MV relation of Local Group dEs (Da Costa 1994, 1998). Absolute visual magnitudes for our dwarfs were estimated by combining the extinction-corrected observed magnitudes, the mean colour of 0.75 (Bothun et al. 1989), and an average distance modulus (m–M)=27.0 for the Sculptor group (C97). The resulting magnitudes, in the range , were converted into abundances according to the relation [Fe/H]M (derived from Fig.7 of Da Costa 1998). As expected, our dEs are all metal poor systems, with metallicities in the range [Fe/H].
As emphasised by Da Costa (1997), dEs are not single-burst populations like a globular cluster. Rather, a diverse and complex set of star formation histories (SFH) is observed among the local dwarf spheroidals. Their stellar populations range from old (Ursa Minor) and mainly old (e.g. Tucana, Leo II) through intermediate-age episodic (e.g. Carina, Leo I) to intermediate-age continuous (e.g. Fornax). On the other hand, Phoenix and LSG3 are classified as dE/Im, because they shows similarities to both dwarf spheroidals and dwarf irregulars. These systems are dominated by an old metal-poor population with no evidence for major star formation activities after the initial episode 8–10 Gyr ago. However, both systems have a minor population of young stars, with ages of about 150 Myr, which makes these galaxies resemble dwarf irregulars.
This situation would make us suspect that for these galaxies is also diverse. Fortunately, this is not the case. We will show that does not depend sensitively on the star formation history within the observed range. This issue will be discussed further in JFB98b. We used Worthey’s program to calculate values for a metal poor old (age Gyr) population with three different types of SFHs (single burst, episodic, continuous). Seven SFHs were modelled with a series of star formation bursts, as given in Table 4. The bursts were taken to occur at equal intervals of time between the first and the last burst (columns 2–4 of Table 4). The adopted initial metal abundance was or . The enrichment per burst was taken to be constant (column 6), where the value of this constant was chosen such that the present-day abundances of the model spanned the range of abundances derived above for our galaxies. A Salpeter IMF was adopted throughout. The relative mass weight per burst was taken to be constant. The resulting values are listed in column 9.
| SFH | Start | Step | End | Initial [Fe/H] | [Fe/H] | Final [Fe/H] | Weight | |
|---|---|---|---|---|---|---|---|---|
| (Gyr) | (Gyr) | (Gyr) | (%) | (mag) | ||||
| (1) | (2) | (3) | (4) | (5) | (6) | (7) | (8) | (9) |
| Burst13 | 13 | 0 | 13 | 0 | 100 | |||
| Burst11 | 11 | 0 | 11 | 0 | 100 | |||
| Burst9 | 9 | 0 | 9 | 0 | 100 | |||
| Episodical-1.9 | 13 | 1.5 | 8.5 | 0.033 | 25 | |||
| Episodical-1.2 | 13 | 1.5 | 8.5 | 0.267 | 25 | |||
| Continuous-1.9 | 13 | 0.5 | 8.5 | 0.011 | 10 | |||
| Continuous-1.2 | 13 | 0.5 | 8.5 | 0.089 | 10 |
The modelling reveals to be essentially insensitive to the changes in SFH for these populations older than Gyr. All magnitudes are found in the narrow interval with a median value . This value can be expected to be a good calibration constant for metal poor old populations as observed in Ursa Minor, Tucana, or NGC 205. If we assume that the morphological similarities between these LG dwarfs and Scl-dE1 and NGC 59 indicate similar star formation histories, then the median value from the models can be adopted for our two sample galaxies.
The remaining three Scl dwarfs show some indication of a small population of young stars as found in Phoenix. To estimate for these dwarfs, we analysed the old populations (column 1, Table 4) but polluted with a 5 and 10 percent (in mass) metal-rich intermediate and young population. This second component was introduced in two different ways: (1) a constant star formation rate between 1 and 8 Gyr simulated with a series of bursts every 1 Gyr, (2) an episodic component with two bursts at 3 and 6 Gyr. Each burst got equal mass weight and a metallicity of [Fe/H] (this is the lowest metallicity allowed in Worthey’s program for bursts younger than 8 Gyr). As in the pure “old” cases, is insensitive to the underlying star formation history of the pollution, i.e. continuous or episodical. The important factor which changes (see Fig.4) is the mass ratio of the two subpopulations. Applying equal weight to the results of all seven considered SFHs yields an average empirical relation . For ESO294-010, ESO540-030, and ESO540-032, we estimate the contribution of the young stars to the total integrated light to be less than 3%. The typical mass-to-light ratio for the generated synthetic stellar systems is about 1.5 in the -band, so we consider an old population with a young star pollution at the 5 percent level as a fair approximation for these three dwarfs. To determine their distances, we will use the mean value from our models .

We are very grateful for the use of Worthey’s public program which enabled the work on described above. We note however that star formation histories of dEs like Fornax or Carina could not be explored with this program. Both dwarfs produced a significant fraction of their metal poor ([Fe/H]) intermediate population between 4 and 8 Gyr (Da Costa 1997). This part of the parameter space, i.e. young ( Gyr) and metal poor ([Fe/H]), is not accepted by the model program at present.
As an independent, zero-order check on the intrinsic scatter of for an old metal poor stellar population, we explored the –[Fe/H] relation for globular clusters (GC) in and (Ajhar & Tonry 1994) for the relevant metallicity range. Our primary interest here is not with the absolute values but the observed intrinsic dispersions. Using all 11 GCs in their sample with [Fe/H], we derived a mean scatter of and , respectively. The exclusion of the anomalous cluster Cen reduces the scatter in the band to . Assuming that the results for the band are comparable, we conclude that (1) theory and observations predict a very small variation of in this metallicity range, (2) the empirical scatter depends only weakly on the photometric passband.
For the following discussion, we will adopt (model) for our “dE” classified dwarfs and (model) for the intermediate type “dE/Im”. In both cases an error of (from GCs) is adopted. We regard this as a preliminary answer in the search for the empirical calibration of the SBF distance indicator for dEs. Interestingly, the results from the models are right between the average values of and for metal poor GCs with and , respectively (Ajhar & Tonry 1994).
The distances to our galaxies can now be determined in the usual manner:
| (4) |
The true (extinction-corrected) distance moduli, the distances in Mpc, and the resulting absolute total magnitudes in and for the five Scl dwarfs are listed in Table 3. Also given there are the uncertainties in these quantities. We recall here the detailed origin of these errors: (fitting, sky, PSF variation), mag (calibration), mag (modelling), and mag. The total SBF distance error for a single measurement is 5 to 10%.
The new SBF distances and their relevance for the 3D-structure of the Sculptor group are discussed in Sec.7 below. First we report on a spectroscopic confirmation of the distance for one dwarf.
6 SPECTROSCOPY
For an independent proof of group membership for at least one of our dEs, we selected our second brightest galaxy ESO294-010 for a spectroscopic follow-up. This galaxy was recently part of a study on the star formation histories of Sculptor group dwarf galaxies (Miller 1996). Miller found that ESO294-010 is a typical early-type dwarf with no evidence for ongoing massive star formation. No H II regions were discovered and the total Hα luminosity is very low. Nevertheless, with a sufficiently long integration time we hoped to detect Balmer absorption lines in the spectrum which then could be used to measure a redshift. This galaxy is even more interesting because C97 reported a detection in H I at a redshift of 4450 km s-1 but we measured the galaxy to be only 2.4 times more distant than M31.
Long-slit spectroscopy was carried out for ESO294-010 in September 1997. We used the double-beam spectrograph (DBS) at the Nasmyth A focus of the 2.3m ANU telescope to observe a blue and a red spectrum simultaneously. The detectors were two SITe 1752532 thinned CCDs with a pixel size of 15m, and a scale of 0.9′′ pixel-1 across the dispersion. The wavelength scales were 1.1Å pixel-1 in the blue and 0.55Å pixel-1 in the red. Beam splitter and grating angles were chosen to cover the wavelength ranges 3500–5500Å and 6000–7000Å, respectively. The slit was positioned at the galaxy centre and aligned along the major axis. The slit length was arcmin with a width of 2′′. A series of four 2000 sec exposures were taken. After each science exposure a Ne-Ar lamp was observed for the wavelength calibration.

IRAF procedures were used for the spectral reduction. The galaxy spectra were individually wavelength-calibrated and sky subtracted, and each set of blue and red spectra were combined to improve the signal-to-noise ratio. Fig. 5 shows slightly smoothed versions of the important parts of the spectra. No significant Balmer absorption lines are visible. However, narrow emission lines at [O III] 5007Å and Hα 6563Å are prominent with 5 and 10 significance relative to the adjacent continuum rms variations (the two apparent [S II] lines 6716Å and 6731Å are not significant). In view of Miller’s (1996) results mentioned above, this finding was unexpected, even though modest amounts of dust and gas in dEs are not uncommon, e.g. in NGC 185 and NGC 205 (Hodge 1973, Young & Lo 1997 and references therein), or NGC 59 (C97). In fact, there is a hint of lumpiness in the central part of ESO294-010, clearly seen in Fig. 2, which made us classify this galaxy a posteriori as an intermediate-type dS0/Im (see Sec.2). Tracking down the source of the emission, we noticed a circular patch 7 arcsec or 0.06 kpc across, located 18 arcsec south of the galaxy centre (Fig. 2). This patch coincides in position and extent with the position and width of the two emission lines along the spatial axis of the spectra, and is probably a small H II region.
The agreement of the velocities derived from the individual lines is excellent, with km s-1. We suggest that 5km s-1 is a more realistic estimate of the velocity error. This low velocity is in accord with our low SBF distance for that galaxy, and it will be shown below that it fits nicely into the velocity pattern of other Scl group members.
7 3D-STRUCTURE OF THE SCULPTOR GROUP
The most important result of our SBF analysis is that all five objects fall in the distance range of previously known Scl group members, thus confirming their suspected membership as group dwarfs. Moreover, the new dE members help to clarify our view of the complex 3D-structure of the group. As it will turn out in the following, the notion of a Scl “cloud” of galaxies would be a better description of this supergalactic structure.
The main members of the Scl group are the six late-type (Sc, Sd, Sm) spirals NGC 45, 55, 247, 253, 300, and 7793. Individual distances to these galaxies, determined from various methods, are listed in Table 7, column 2. The rms uncertainties of the distances are given in parentheses. Most data are taken from Puche & Carignan (1988, Table II). Where more recent measurements are available, we have calculated a mean value from the references given in column 3. One Scl dwarf, the irregular SDIG, which already had a known distance, is also included here. To this list we can now add our 5 Scl early-type dwarfs with their newly determined SBF distances.
| Name | D(D) | Ref. | v⊙(v) | vGSR | vLG | Ref. |
|---|---|---|---|---|---|---|
| Mpc | km s-1 | km s-1 | km s-1 | |||
| (1) | (2) | (3) | (4) | (5) | (6) | (7) |
| NGC 55 | 1.66(0.20) | PC88 | 129(3) | 98 | 111 | DC91 |
| ESO294-010 | 1.71(0.07) | this study | 117(5) | 71 | 80 | this study |
| NGC 300 | 2.10(0.10) | Fr92 | 144(1) | 101 | 114 | ESO-LV |
| ESO540-032 | 2.21(0.14) | this study | ||||
| NGC 247 | 2.48(0.15) | T87, PC88, F98 | 156(4) | 173 | 211 | DC91 |
| Scl-dE1 | 2.67(0.16) | this study | ||||
| SDIG | 2.63(0.80) | L77, H97 | 229(10) | 217 | 238 | C97 |
| NGC 253 | 2.77(0.13) | PC88, F98 | 245(5) | 246 | 278 | DC91 |
| ESO540-030 | 3.19(0.13) | this study | ||||
| NGC 7793 | 3.27(0.08) | T87, PC88 | 227(2) | 226 | 250 | ESO-LV |
| NGC 45 | 4.35(1.40) | PC88 | 463(3) | 488 | 525 | DC91 |
| NGC 59 | 4.39(0.15) | this study | 362(10) | 392 | 432 | C97 |
References. — C97: Côté et al. 1997; DC91: Da Costa et al. 1991; ESO-LV: Lauberts & Valentijn 1989; F98: Federspiel 1998 (NGC 247 (m–M)0=27.17, NGC 253: (m–M)0=27.36); Fr92: Freedman et al. 1992; H97: Heisler et al. 1997; L77: Laustsen et al. 1977; PC88: Puche & Carignan 1988, and references therein; T87: Tammann 1987.
Velocities (where available) are also given in Table 7. Heliocentric velocities (column 4) are taken from C97, Da Costa et al. (1991), and Lauberts & Valentijn (1989) for all but one galaxy (ESO294-010) for which the velocity was established in the present study (see Sec.6). These velocities were transformed into galactocentric velocities (column 5) and velocities relative to the barycentre of the LG (column 6), applying the apex vectors given by de Vaucouleurs et al. (1991) and Karachentsev & Macharov (1996), respectively.
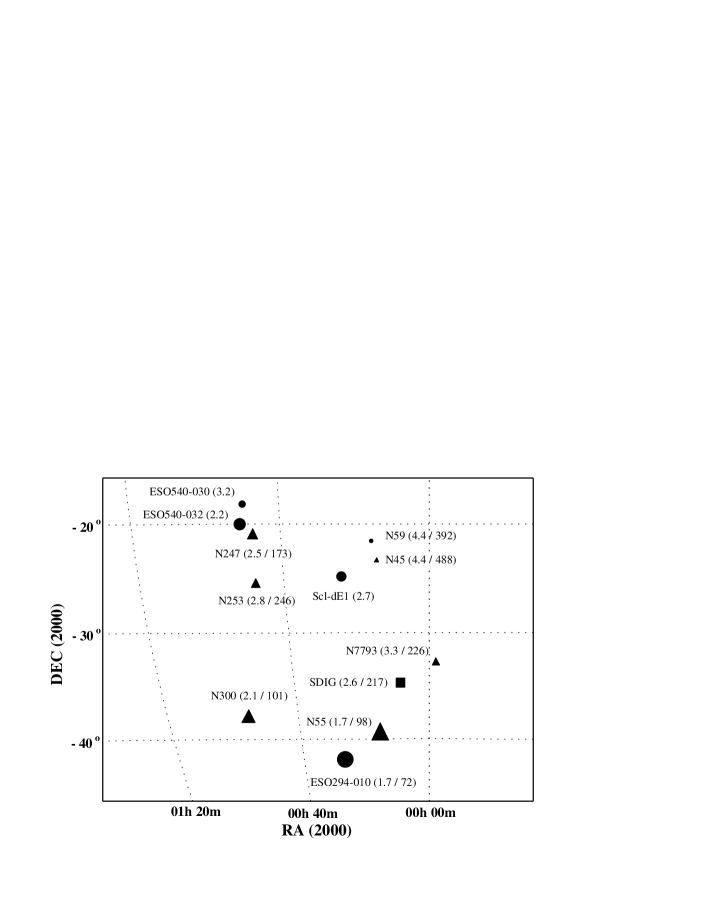
Fig. 6 is a pseudo-3D plot of the distribution of the 12 Scl galaxies with known distances listed in Table 7: it shows the sky distribution of these galaxies, with the distance of every galaxy indicated by the symbol size (the distances and velocities are also given as numbers). We first note the large depth spanned by the galaxies: distances range from 1.7 Mpc (NGC 55) to 4.4 Mpc (NGC 45). In fact, Puche & Carignan (1988) excluded the distant NGC 45 from their study because they insisted on a gravitationally bound Scl group with a suitably low mass-to-light ratio. Here we relax any dynamical requirements because, judged from the distribution of galaxies, such a cut seems artificial. This will become clearer below.
We further note the close match in distance of ESO294-010 with NGC 55 at the near end (1.7 Mpc), and of NGC 59 with NGC 45 at the far end (4.4 Mpc) of the Scl complex (despite the large distance error for NGC 45). It seems very likely that the two dwarfs are bound companions to the major members NGC 55 and 45. Both pairs are separated by less than 200 kpc in projection and have a radial velocity difference of less than 100 km s-1. ESO540-030, ESO540-032, and Scl-dE1, on the other hand, seem to be associated with NGC 247 and 253 at an intermediate distance of 2.5 Mpc. ESO540-032 could be bound to NGC 247. The other two dwarfs are too far off for a single companionship to either giant, but a bound substructure centred on NGC 247 and 253 is strongly suggested.
The close spatial coincidence of our five dwarf objects with the substructure of the Scl group traced out by its main members demonstrates two things: (1) The SBF method to determine distances to early-type dwarfs is reliable and accurate to the claimed level. (2) The trend of “field” dEs to be satellites of giant galaxies is confirmed, in accord with the morphology-density relation for dwarf galaxies (Binggeli et al. 1990). The only isolated pure (old-population) dE known so far is the Tucana system in the LG (Da Costa 1994, see also Fig 9. below). The only galaxy classified here as a pure dE, Scl-dE1, may also be fairly isolated among our dwarfs.
So far we have not considered the 14 (!) additional dwarf irregular Scl group members discovered by C97, because of a lack of distance information. However, we can include them in our analysis by using their observed radial velocities as distance indicators via the tight velocity-distance relation which will be discussed below. Dwarf irregulars are known (and below also shown) to avoid high-density regions (cf. again Binggeli et al. 1990) and therefore to possess fairly unperturbed velocities.
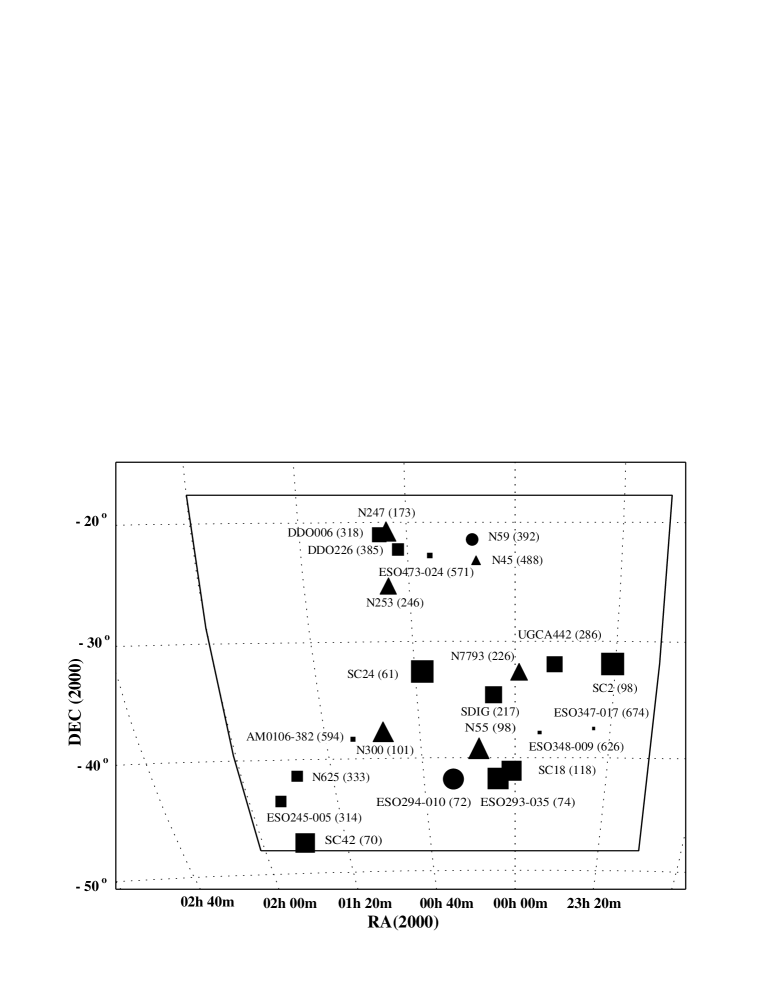
Fig. 7 is a pseudo-3D plot of the Scl group, like Fig. 6 but now with the galactocentric velocity as third dimension. All C97 irregulars are included here, raising the number of Scl galaxies to 23. We recognize again the NGC 55 subclump on the near side with ESO294-010, and possibly also SC18 as bound companions. NGC 300 and SDIG are slightly more distant. Unfortunately, the three dEs associated with NGC 247 and 253 (Fig. 5) have no velocity and hence are lost here in Fig. 7. DDO006 and 226 with 300 km s-1400 km s-1 must lie behind NGC 247 (173 km s-1). Likewise, ESO473-024 (571 km s-1) is probably behind NGC 45/59. On the other hand, a possible pair of irregulars appears in the SE (lower left) corner with NGC 625 (333 km s-1) and ESO245-005 (314 km s-1). There are some very nearby dwarf irregulars, such as SC24 (61 km s-1) and SC2 (98 km s-1), but also some very distant ones, such as ESO348-009 (626 km s-1) and ESO347-017 (674 km s-1). Overall, the impression is that the dwarf irregulars are not strongly associated with the main Scl group members but are scattered over the entire volume in the form of a “cloud”. This is of course again in accord with the morphology-density relation for dwarf galaxies (Binggeli et al. 1990). The whole Scl group seems to have the shape of a cigar of length 3 Mpc and thickness 1 Mpc, which we see pole-on because the LG lies near its end. A much better view of this can be gained if the cigar is turned to the side by plotting the distances linearly. For this we have first to transform velocities to distances via a Hubble diagram.
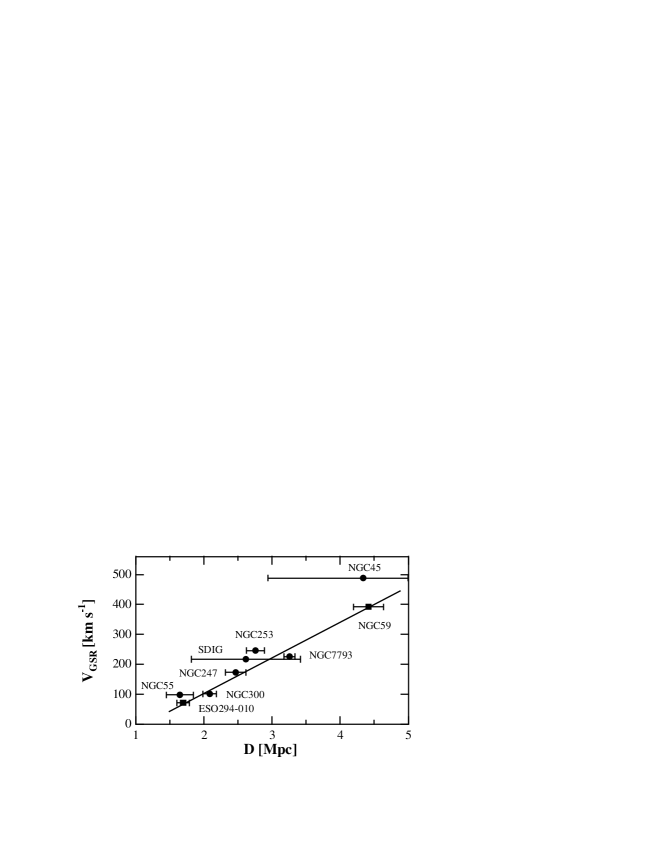
In Fig. 8 we show the Hubble diagram for the total of nine galaxies with known distances and velocities, to which we have contributed ESO294-010 and NGC 59. The velocities () are relative to the centre of our Galaxy. The major Scl group members show a tight linear relation between velocity and distance. Such a trend was already seen by Puche & Carignan (1988) and is now confirmed and amplified by the two new data point from the dEs (filled squares). A maximum likelihood linear fit to the data yields:
| (5) |
where is taken to be the independent variable and the distance errors are given in Table 7.
The mean scatter of the residuals about the line is remarkably small, with Mpc (0.23 Mpc without NGC 45) and km s-1(27 km s-1without NGC 45). Large peculiar velocities due to internal group dynamics are clearly absent. This strongly suggests that our Scl galaxies form a “cloud” (e.g. de Vaucouleurs 1975, Tully 1982, Tully & Fisher 1987), meaning a supergalactic structure of higher-than-average galaxy density which, in contrast to a “group”, is gravitationally unbound. However, bound substructures, e.g. defined by one giant galaxy plus a swarm of dwarf companions, are often found embedded in such a cloud. This also seems to be the case here.
The slope of the Hubble relation of Equ.5 is very steep (119 km s-1 Mpc-1). A plausible reason for this deviation from the global Hubble law ( 10 km s-1 Mpc-1) is the gravitational influence of the LG. The deceleration of the local expansion field (for 4 Mpc) by the LG was nicely recovered by Sandage (1986, 1987) who used his local galaxy data to put constraints on the mass of the LG. However, an attempt to fit one of Sandage‘s template curves for the local Hubble diagram (1986, his Fig. 2) to our data (Fig. 8) proved unsuccessful. At present we do not understand the dynamics underlying the Scl cloud velocity field, and a dynamical analysis is beyond the scope of this paper.
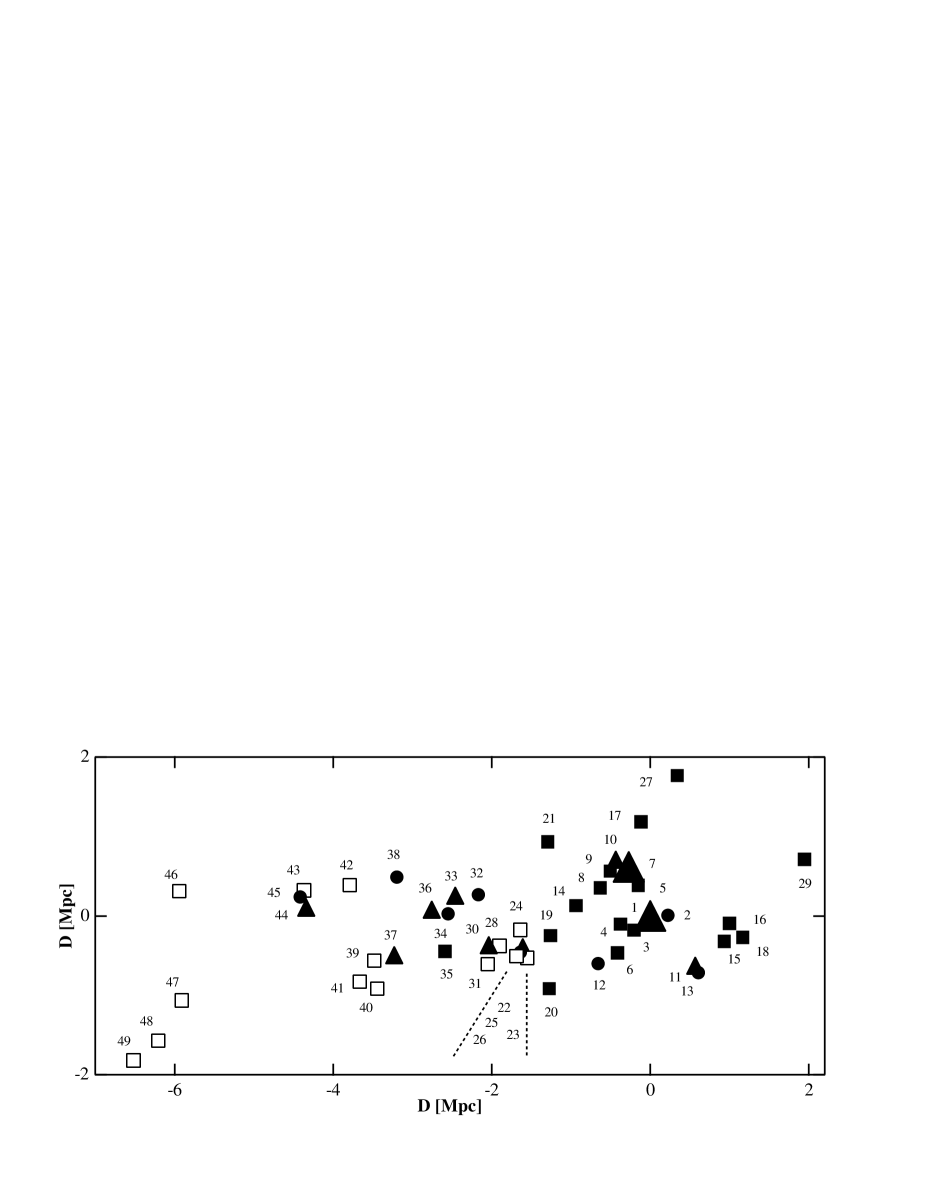
Because the velocity-distance relation of Equ.5 is so tight, we can use it empirically to obtain approximate distances to those Scl galaxies which have only velocities, i.e. the dwarf irregulars of C97. Based on these distances we show, in Fig. 9, the distribution of all Scl cloud members in projection on to the supergalactic plane (SGP). This provides us with a side view of the cigar-shaped Scl cloud, as it was described above. The scatter of the third dimension here, the height above/below the SGP, is quite small ( Mpc). We have also included LG “members” and galaxies at the outer fringes of the LG in this plot (data taken from van den Bergh 1994), to demonstrate that the Scl cloud and the LG may actually form one structure. This conjecture was raised before by Binggeli (1989). There is a marked asymmetry in the distribution of galaxies within a distance of 1.5 Mpc. Aside from the close companions to our Galaxy and M31, most LG dwarf members and suspected members (IC1316, WLM, NGC 6822, Phoenix, Tucana, SagDIG, DDO210, Pegasus, IC5152, …) form a southern extension of the LG – A bridge across to the Scl cloud (see also Fig.2 in Binggeli 1989).
The whole structure can be described as a prolate (6 2 Mpc) cloud of (unbound) dwarf irregulars, in which a number of denser groups are embedded, each containing one or more massive galaxies plus a swarm of (bound) dwarf companions which tend to be of early type. Certainly our Galaxy and M31 with their satellites form such condensations – each alone, and together as the LG. In the Scl region we note again the three subclumps mentioned before: centred on NGC 55 (plus NGC 300?), NGC 247/253, and NGC 45. NGC 7793 may define a fourth subclump or may be member of the first (Davidge 1998). We note again the position of our five early-type dwarfs in this map: they tend to mark the condensations.
The dynamics of these Scl subsystems with respect to each other, and with respect to the LG in particular, is not clear at present. We note that the major Scl group members are much less massive than M31 or our Galaxy, and that M31 and the Galaxy lie at the extreme end of the prolate cloud, but we do not know if this is physically significant. Finally, it is worth mentioning that the Scl-LG cloud is part of a yet larger structure – a prolate cloud that stretches out to the Coma I cluster at 15 Mpc, in the direction of the Virgo cluster. The feature is indeed called the “Coma-Sculptor cloud” (Tully & Fisher 1987, see plate 14).
8 SUMMARY AND CONCLUSIONS
We have shown that the Surface Brightness Fluctuation method can be successfully used as a distance indicator for low surface brightness dwarf elliptical galaxies as faint as . The application to the dwarf ellipticals rather than normal ellipticals has two advantages: (1) there are many dEs in the LG and its vicinity, and independent distances to these nearby dEs can be used to calibrate the absolute fluctuation magnitude , (2) Through HST studies, we have detailed information about the variety of stellar content and star formation history of this galaxy type. However, most of them are dominated by an old metal poor stellar population. In this situation, first results from stellar population synthesis models suggest that is relatively insensitive to the SFH.
The internal fluctuation error for our dEs is 0.04-0.12 mag which includes the results from comparison of two different fields of the same galaxy. A small systematic uncertainty for comes from the unknown stellar content of the galaxy. For example, gets 0.12 mag fainter when going from a pure old population (all stars older than 8 Gyr) to an old population contaminated by 10% of young population. This trend was taken into account here by applying appropriate calibration constants to the different morphological galaxy types. The overall distance error we derive is between 4 and 7%. Although a more detailed analysis is required to follow up the population issue, a very satisfactory hint at the reliability of the theoretical values comes from the fact that all dEs turned out to be close companions of Scl group members for which independent distance measurements exist. These parent galaxies cover the full 3 Mpc depth of the Scl group.
Based on the results for our five dEs, we further reviewed the kinematics and the 3D-distribution of the Scl group. Surprisingly, the Hubble flow at the group shows no evidence for disturbance due to gravitational interaction between the main group members but is possibly decelerated by the tidal force of the nearby, massive LG leading to a large local Hubble constant of km s-1 Mpc-1. Taking advantage of the tight empirical velocity-distance relation we determined distances to dwarf irregulars in the Scl region and compiled distances from the literature for galaxies in the local volume to illustrate that the LG and Scl group are not isolated in space but are part of a large prolate cloud (6 2 1 Mpc3 in size) of dwarf irregulars well defined within the supergalactic plane. A number of groups are embedded in this structure, each containing one or more massive galaxies accompanied by a population of bound dwarf satellites which tend to be of early type.
Finally it is interesting to note that four of our dE galaxies were already known prior this study. It is their membership of the Scl group which was uncovered here. This is a clear signal that the search for nearby dwarf elliptical galaxies should not only be focussed on the discovery of new, very low surface brightness galaxies but also on a careful follow-up of already known galaxies which appear nearby from their morphology. For such follow-up work, the SBF method is a powerful tool for measuring the distance of a galaxy. For the future, this opens up the possibility to measure accurate distances to all known dEs in the distance range between 1 and 10 Mpc without the expensive requirement of resolving the stellar system into stars. This will allow us to establish background-free dE samples, to explore the galaxy content of medium and low-density regions of the nearby universe, and to study the physical properties of dEs in greater details. Furthermore, the existence (or non-existence) of isolated early-type dwarfs can be established as a constraint on the formation and evolution of galaxies.