03(02.18.5; 11.01.2; 11.09.1 3C 219; 11.13.2; 13.18.1; 13.25.2)
G.Brunetti, Istituto di Radioastronomia del CNR, via Gobetti 101, I–40129 Bologna, Italy
Evidence for inverse Compton emission in the powerful radio galaxy 3C 219
Abstract
Spectral analysis of ROSAT PSPC and ASCA archive data and a recent ROSAT HRI observation of the powerful FRII radio galaxy 3C 219 reveal an absorbed point–like source, coincident with the nucleus, and a non–thermal extended component aligned with the radio structure. The point–like source can be readily interpreted as a hidden quasar in the nucleus, giving further support to the unification scheme of FRII radio galaxies and radio loud quasars. The coincidence between the X–ray (0.1–10 keV) and radio spectral slopes suggest that most of the emission associated with the extended component is due to the inverse Compton process in the radio lobes. The extended circumnuclear emission can be understood as Compton scattering of the IR–optical radiation emitted by the hidden quasar and surrounding dusty/molecular torus. This is the first observational evidence supporting the existence of this effect, which also probes the relativistic electron spectrum at energies much lower than those involved in the synchrotron radio emission. The observed X–ray flux can be matched by assuming that the energy density of the relativistic particles exceed the equipartition value by about a factor of 10. At larger distances from the nucleus (kpc) the inverse Compton scattering with the cosmic microwave background photons becomes more important and may explain the observed X–ray features if positive fluctuations in the column densities of relativistic electrons are present. Alternatively, one cannot exclude with the present data a thermal contribution by hot clumpy gas surrounding the radio lobes.
keywords:
Radiation mechanisms: non-thermal – Galaxies: active – Galaxies: individual: 3C 219 – Galaxies: magnetic fields – Radio continuum: galaxies – X-rays: galaxies1 Introduction
The properties of the X-ray emission of the powerful radio galaxies have been investigated in the literature (Fabbiano et al. 1984, Crawford & Fabian 1995, 1996).
In the framework of the AGNs unification models (Barthel 1989, Urry & Padovani 1995) the nuclear X–ray emission of the FRII radio galaxies is expected to be heavily absorbed along the line of sight by a circumnuclear molecular torus. Strong absorption has indeed been detected in the X–ray observations of the narrow line FRII radio galaxies Cyg A (Ueno et al. 1994) and 3C 194 (Crawford & Fabian 1996); moreover, intrinsic absorption has been discovered in the X–ray spectra of the broad line radio galaxies (BLRGs) 3C 109 (Allen & Fabian 1992) and 3C 287.2 (Crawford & Fabian 1995).
Worrall et al. (1994) have suggested that part of the soft X–ray emission of some strong FRII radio galaxies is synchrotron self–Compton (SSC) in the AGN jets. SSC may also explain the X–ray emission observed with ROSAT in two emission regions coincident with the radio hot–spots of Cygnus A (Harris et al. 1994), but it is generally too weak to be detected even in the nearby radio galaxies (Hardcastle et al. 1998a).
It is well known that non–thermal mechanisms can produce extended X–ray emission in the lobes of the radio galaxies where the relativistic electrons can interact with the microwave background photons (CMB) and radiate via the inverse Compton (IC) process. The relativistic particle densities and magnetic field strengths in the extended lobes of radio galaxies are usually estimated on the basis of the minimum energy assumption (equipartition). The detection of IC scattered X–rays from the radio lobes could provide an invaluable tool to determine the value of these important physical parameters. Unfortunately, this process is not particularly efficient at low redshifts (the IC emissivity increases as (1 + z)4) so that ROSAT and ASCA have failed to detect this effect in nearby radio galaxies with a few exceptions (notably, Fornax A: Feigelson et al. 1995, Kaneda et al. 1995; Cen B: Tashiro et al. 1998).
In a recent paper Brunetti et al. (1997) have shown that in the framework of the unification scheme linking strong FRII radio galaxies and radio loud quasars it is possible to predict large X–ray fluxes by the IC scattering of the far/near IR photons from a typical “hidden” quasar with the relativistic electrons in the radio lobes. Even if this effect is expected to dominate the IC contribution also at high redshifts, and predicts X–ray fluxes and spectral shapes consistent with those observed for a number of strong distant FRII radio galaxies (redshift z 1), it is difficult to be tested in detail because of the low spatial resolution and sensitivity of the available X–ray telescopes. The far/near IR photons from the “hidden” quasar are scattered in the X–ray band mainly by mildly relativistic electrons () which are not those responsible for the synchrotron radio emission (typically ). Therefore, the detection of the IC emission predicted by Brunetti et al.(1997) model would not only provide additional evidence in favour of the radio galaxy/quasar unification scheme, but it would also provide an unique handle to probe the spectral and spatial distributions of the relativistic particles over a wider energy range.
Nevertheless, optical and radio observations have suggested that relatively distant radio galaxies (z 0.3) lie at the center of moderately rich clusters of galaxies (Yates et al. 1989, Hill & Lilly 1991) with a dense hot intracluster medium (Garrington & Conway 1991). In addition, X–ray data are consistent with a scenario in which more than two third of the 50, or so, nearby brightest clusters have cooling flows (Fabian 1994). As a consequence in a number of powerful radio galaxies the thermal emission from the intracluster medium is expected to dominate the observed soft X–ray flux, as in Cyg A (Reynolds & Fabian 1995), producing extended X–ray structures and shadowing any other contribution. This scenario is further complicated by the fact that deep ROSAT HRI observations of nearby radio galaxies have revealed X–ray deficit associated with the radio lobes possibly originating from the hydrodynamical interaction of the jets and radio hot–spots with the intracluster medium (Cyg.A: Carilli et al. 1994; NGC 1275: Böhringer et al. 1993; 3C 449: Hardcastle et al. 1998b).
We present here a deep ROSAT HRI observation of 3C 219, a nearby (z=0.1744) powerful radio source identified with a cD galaxy of magnitude MV=-21.4 (Taylor et al.1996), belonging to a non Abell cluster (Burbidge & Crowne 1979). Despite of its cluster membership, the ROSAT PSPC and ASCA archive data suggest that thermal emission, if present, is negligible so that this source could be a good candidate to detect possible IC contribution to the X–ray flux.
The radio structure is well studied (Perley et al. 1980, Bridle et al. 1986, Clarke et al. 1992): it is a classical double–lobed FRII radio galaxy that spreads over 180on the sky plane corresponding to a projected size 460 Kpc. 111km s-1Mpc-1 and are assumed throughout A strong jet extends over 20( 50 Kpc) through the south–western lobe, while a weak counterjet is visible in the north–eastern lobe. The total radio spectrum, largely dominated by the extended radio structure, between 178 and 750 MHz is (, Laing et al. 1983).
Fabbiano et al. (1986) have reported the detection of a broad Paschen– line in excess of the predictions of case B recombination implying the presence of an absorbed broad line region with mag. More recent optical studies have shown that the 3C 219 spectrum is dominated by a starlight continuum, but a non–stellar component and emission line features are also present (Lawrence et al. 1996); from the broad line ratio , assuming typical broad line region parameters, we infer . In a H+[N II] image taken with the 4m Kitt Peak telescope the galaxy appears to be point–like (Baum et al. 1988) with a nearby, possibly interacting companion to the south–east. An image of 3C 219 has been taken with the HST telescope’s WFPC2 through a broadband red (F702W) filter (de Koff et al. 1996); the galaxy is well resolved and does not present relevant features (dusty lane, distortions) on a scale pc (i.e. HST resolution).
The data analysis is presented in Sect. 2 and 3 while the proposed interpretation is discussed in Sect.4.
2 X–ray spectral analysis
2.1 ROSAT PSPC observations
| Instrument | En. Range | N | N | |||||
|---|---|---|---|---|---|---|---|---|
| ROSAT | 0.1–2.4 keV | – | – | – | – | 7.6/10 | ||
| 1.55(f) | – | – | – | – | 7.7/11 | |||
| 1.55(f) | 1.80 (f) | 18.7 | 0.740.07 | – | – | 9.9/10 | ||
| ASCA | 0.6–10 keV | – | – | – | – | 298.5/283 | ||
| 1.55(f) | – | – | – | – | 359.2/284 | |||
| – | – | 6.4(f) | 224 | 295.8/285 | ||||
| ROSAT+ASCA | 0.1–10 keV | 1.55(f) | 0.740.08 | – | – | 304.8/293 |
a Equivalent hydrogen column density (units of cm-2)
b Photon spectral index
c Column density of the partial covering gas ( cm-2)
d Covering Fraction
e Iron line energy (keV)
g Iron line EW (eV)
h Total and degrees of freedom
3C 219 has been observed with the ROSAT PSPC (Pfeffermann et al. 1986) on May 3, 1992.
We have analyzed the archive data finding that the spatial profile in the 0.1–2.4 keV range is consistent with that of a point source convolved with the PSPC point spread function (PSF), taking into account the source spectral properties and the background level. However, the maximum likelihood detection algorithm suggests some possible evidence of extended emission (see Sect.3). There is no evidence of significant time variability.
The source spectrum was extracted from a circular region with 2radius. Different background spectra have been extracted either from annuli centered on the source or from circular regions uncontaminated by nearby sources. In all cases the background appears stable without any appreciable variations within the statistical errors. Corrections were included for vignetting and PSPC dead time. Source spectra were extracted in the pulse invariant (PI) channels in the range 11–240 ( 0.1–2.4 keV). The photon event files were analysed using the EXSAS/MIDAS software (version 94NOV, Zimmermann et al. 1993) and the extracted spectra were analysed using version 9.0 of XSPEC (Shafer et al. 1991) with the appropriate response matrix. The resulting exposure time is 4349 s and the background subtracted source count rate is 0.127 0.006 cts s-1. The source spectrum was rebinned in order to obtain a significant signal to noise ratio () for each bin and fitted either with a power law or with a thermal plasma spectrum (Raymond–Smith model) plus absorption arising from cold material with solar abundance (Morrison & McCammon 1983). The derived spectral parameters are given in Table 1, where the reported errors are at 90% confidence level (Lampton et al. 1976); the value of the Galactic column density towards 3C 219, cm-2, has been retrieved from the 21 cm radio survey of Dickey & Lockman (1990). A single power law with the absorption either fixed at the Galactic value, or free to vary, provides an acceptable description of the observed spectrum (Table 1). Formally, also a Raymond–Smith thermal model with solar abundance fits well the observed counts, however the derived temperature is extremely high and almost unconstrained.
The best fit spectral photon index is unusually flat in agreement with the results of Prieto (1996). The flat power law slope can be due to the effect of absorption on a steeper continuum. In order to test this possibility we have tried a partial covering model. Assuming a typical AGN spectrum with photon index =1.8 plus Galactic absorption, a good description of the data can be obtained if about 75% of the nuclear radiation is absorbed by a column density of the order of 2 cm-2 (Table 1). The X–ray flux in the 0.1–2.4 keV energy range, corrected for Galactic absorption, is 1.8 10-12 ergs cm-2 s-1 corresponding to an isotropic luminosity of 1.1 1044 ergs s-1 (rest frame), while the unabsorbed nuclear luminosity would be erg s-1.
2.2 ASCA Observations
3C 219 was observed with ASCA (Tanaka, et al. 1994) on April 12, 1995 and on November 13, 1994 with the Gas Imaging Spectrometers (GIS2/GIS3) and with the Solid–state Imaging Spectrometers (SIS0/SIS1). Both observations were analyzed by us using standard calibration and data reduction methods (FTOOLS) provided by the ASCA Guest Observer Facility at Goddard Space Flight Center. The net exposure time for the 1995 observation was 18 Ks in the GIS detectors and 16.5 Ks in the SIS. Slightly lower exposure times were obtained for the 1994 observation.

Source photons were extracted from a circular region centered on the source with 6′ radius for GIS and 3′ radius for SIS. The background was estimated using both source-free regions and blank–sky GIS and SIS observations available in the calibration area. Different background estimates give consistent results.
Data preparation and spectral analysis were performed using version 1.3 of the XSELECT package and version 9.0 of the XSPEC program. The light curves from each instrument do not show any significant flux variation over the whole observation. GIS and SIS spectra were binned with more than 20 cts/bin in the 0.7–10 keV and 0.6–10 keV energy ranges respectively. The lowest SIS energy channels have been excluded because of the uncertain calibrations (Dotani et al. 1996; Cappi et al. 1997). Since the spectral parameters obtained by fitting the four detectors separately were all consistent within the errors, data from both pair of SIS and GIS were fitted simultaneously to the same model, but with the normalization of each dataset allowed to vary relative to the others in order to account for the small discrepancies in the absolute flux calibrations of the detectors.
Both observations gave very similar results; in the following we discuss only the results obtained from the 1995 observation characterized by a better counting statistics.
A single power law model clearly provides an acceptable fit to the data (Table 1). Absorption in excess of the Galactic value is required. There is no need of more complex models. In particular the addition of a narrow emission line at 6.4 keV does not improve the quality of the fit, while a thermal component is not required by the data. The absorption corrected X–ray flux in the 2–10 keV energy band is 3.6 erg cm-2 s-1, which corresponds to a luminosity of 2.4 erg s-1 in the source frame.
2.3 ROSAT and ASCA joint fits
In the overlapping 0.6–2.0 keV energy range the observed PSPC flux is about 15 % lower than the ASCA flux with a weak dependence on the assumed spectral parameters. Moreover the value of the column density derived from the PSPC data assuming a partial covering model (Table 1) is in good agreement with the absorption observed in the ASCA data (Table 1) suggesting that this model is viable or that two different spectral components are present. Therefore, in order to make full use of the available spectral band (0.1–10 keV) we have performed joint fits to the ROSAT PSPC and ASCA data leaving the relative normalizations free to vary to account for the residual absolute flux uncertainties among the different instruments.
Not surprisingly a partial covering model provides a good description of the observed 0.1–10 keV spectrum: the resulting power law spectrum () is partially ( %) absorbed by cold gas with a column density cm-2 (Fig.1, Table 1). This implies that in the soft 0.1–2.4 keV band about 38% of the observed flux may be due to a scattered component. A description of the soft X–ray spectrum in terms of thermal emission is not viable, while the addition of a thermal component to the best fit partial covering model does not significantly improve the fit. Any thermal component (if present) cannot contribute more than 8–10 % (90 % confidence limit) to the observed X–ray flux.
We conclude that the 0.1–10 keV spectrum of the radio galaxy 3C 219 can be explained in terms of an obscured central source characterized by a power law with a slope typical of radio loud quasars in the 2–10 keV energy range (Lawson & Turner 1997). An additional unabsorbed spectral component is present in the soft X–ray band. In principle this component may be due to scattering of the soft X–ray nuclear radiation by circumnuclear clouds or thermal electrons, but we note that the unabsorbed power law (Table 1) has a slope close to that of the synchrotron radio spectrum (), so that the possibility that it might originate from IC scattering of the IR–optical nuclear and/or CMB radiation can also be taken into account. A crucial test to decide which one of these two possibilities should be adopted is the study of the spatial distribution of the X–ray flux.
3 Spatial Analysis
3C 219 was observed with the ROSAT HRI for a total of 28.6 Ks between April 10 and May 8, 1997. Standard procedures have been employed within the MIDAS/EXSAS software. The source counts, estimated with a maximum likelyhood (ML) detection algorithm as described in Cruddace et al. (1988), are 84730 corresponding to a background subtracted count rate of 0.03 cts s-1 in the 0.1–2.4 keV band. Since the ML algorithm has been conceived to study point–like sources and is not efficient for extended sources, the source flux has been computed measuring the counts in a circle of 2radius. We find evidence of emission outside 20from the nucleus accounting for some 15% of the total flux (see Sect.4). The resulting total count rate (nuclear and extended emission) is 0.035 cts s-1. The total HRI flux of 1.6 erg cm-2 s-1 is consistent, within about 10%, with that derived from the PSPC observation (see 2.1) assuming the spectral parameters reported in Table 1.
It is known that the intrinsic spatial resolution of the ROSAT HRI of 5FWHM is blurred by the errors due to the relatively poor knowledge of the pointing position as a function of time. We have tried to correct for the residual aspect solution errors following a procedure developed by Harris et al.(1998) which selects observing periods with the same roll angle and folds the data according to the wobbling period of 402 s. Several subimages are created according to the source statistics and the wobble period, then shifted to a common center and coadded.
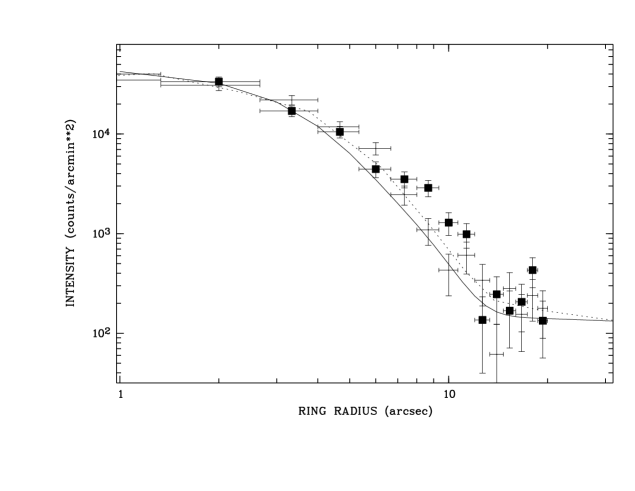
The radial profile of the innermost region of the wobble corrected image is then compared with an inflight calibrated PSF, kindly provided by I. Lehmann (private communication), derived from the average profile of 21 bright stars (Fig.2). From the analysis of the azimuthal distribution of the counts within 20( 50 kpc) from the source peak intensity we find that the nuclear source is resolved in the north–south direction (Fig.2). A Kolmogorov–Smirnov test shows that the observed distribution of the counts in the north–south direction differs from the PSF at the 99% confidence level, while the test is not conclusive in the case of the east–west direction.
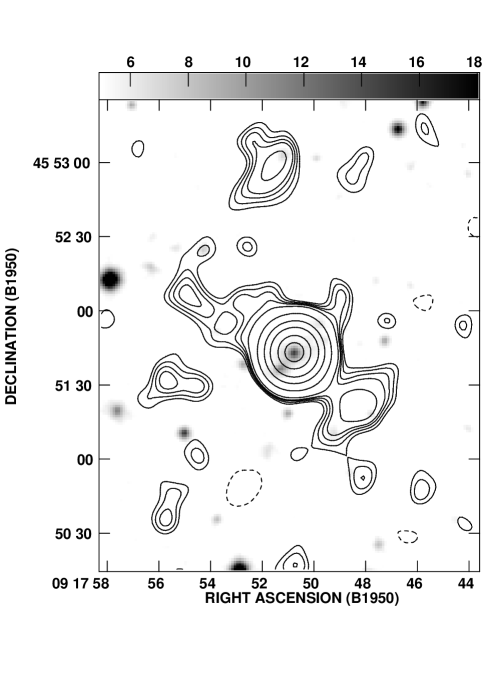
In order to get more information on the structure an X–ray image of 3C 219, smoothed with a circular gaussian of FWHM=3(Fig.3), has been produced with the EXSAS package, while the further image processing has been performed with the Astronomical Image Processing System (AIPS) package. An extended structure up to 15in radius is indeed detected in the north–south direction (Fig.3).

The smoothed PSF appears to be elliptical (FWHM= 8.27.5) with the major axis positioned at 70∘ clockwise from the north, at variance with the elongation of the extended structure.
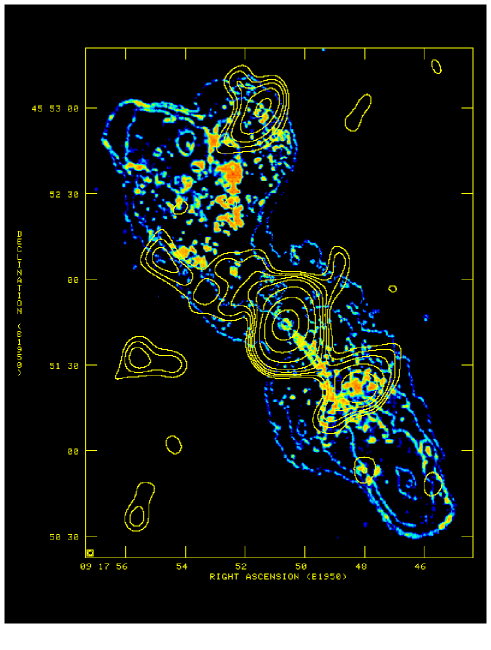
Of course, the small FWHM used in the previous smoothing procedure does not allow a detection of the outer extended low brightness features. The X-ray image of Fig.4 has been produced with the EXSAS package by binning the photon event table in pixels of 2and by smoothing the map with a circular gaussian of = 5. With these values the signal to noise ratio is good enough to image the low brightness extended emission significantly above the background. The ROSAT HRI image has been shifted by 1.5 and 0.6 in right ascension and declination, respectively, in order to align the X-ray peak with the radio core position. The X–ray map has been overlaid to the optical POSS–II digitized image of the field in Fig.4. Since 3C 219 is in a cluster of galaxies, the optical image is crowded and a number of objects fall within the X–ray structure; no coincidence with relevant optical objects is found.
The structure of the X-ray brightness distribution between 15–25 from the core can be enhanced if the central unresolved component is subtracted from the HRI image. The model used in the subtraction is a circular gaussian ( = 6) with the peak coincident with the X-ray peak. This function represents the convolution between the instrument PSF and the smoothing function applied to the image. In fact, although the instrument PSF is not exactly a gaussian, the smoothing gaussian dominates the resulting convolved PSF.
In order to subtract the nuclear component from the total HRI image we have made use of the spectral analysis results of Sect.2. The 0.1–2.4 keV flux of the nuclear emission has been estimated by assuming the best fit spectral parameters of the high energy absorbed component in the 0.1–10 keV fits. Taking into account the different responses of the HRI, PSPC and ASCA detectors for a given spectrum, as well as the errors on the best fit spectral parameters, the nuclear flux is estimated to account from 55% to 70% of the HRI counts. The subtraction procedure has been performed several times constraining the amplitude of the nuclear component within this interval. We also note that the largest contribution of the point–like nuclear source (leaving zero counts after the subtraction at the position of the peak) is % of the total net counts; this limit is implied from the HRI data alone. The residual map resulting from the subtraction of the nuclear source with a representative amplitude of 64% is shown in Fig.5 superposed on the VLA radio image at 1.4 GHz (Clarke et al. 1992).
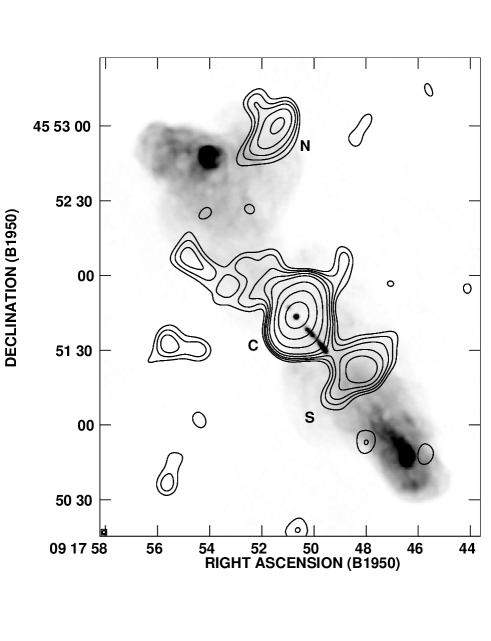
It is evident that the residual X–ray isophotes are strongly correlated with the radio extension and appear to be elongated along the radio structure. We distinguish three main regions: one coincident with the low brightness part of the northern radio lobe (N), one positioned between the nucleus and the southern radio hot–spot (S) and the strongest one (C) centered on the radio–core. The C–component appears like a curious eight–shaped figure with the axis inclined by with respect to radio–axis, but the isophotes become more aligned with the radio–axis with increasing distance from the nucleus. This basic structure persists even by varying the amplitude of the point–like source within the allowed interval and/or by applying a slightly different in the subtraction procedure. Furthermore one can notice that the C–component seems to show a remarkable continuity with the extended structure of Fig.3.
4 The Model
The ROSAT HRI observation presented here shows a complex extended X–ray structure surrounding a central point–like source. ROSAT and ASCA spectral analysis reveals that the nucleus is absorbed by a column density cm-2 similarly to other ROSAT findings for BLRGs (Crawford & Fabian 1995). The unabsorbed luminosity (erg s-1) in the 0.1–2.4 keV band and the photon index are typical of steep spectrum radio loud quasars, thus strengthening the hypothesis that we are dealing with a hidden quasar in the nucleus of the radio galaxy in agreement with the unification model.
According to the spectral analysis, the nuclear source contributes % of the total ROSAT PSPC flux while the contribution from a thermal source, if any, cannot exceed % of the total flux. Therefore a large fraction, if not all, of the flux associated with the extended structure should be characterized by a power law spectrum with a slope close to that of the radio emission (). This and the spatial correlation with the overall radio structure suggest that the IC process could be a likely mechanism to generate most of the extended X–ray flux.
However, a considerable fraction (%) of the extended emission flux is confined to the eight–shaped structure (component C in Fig.5) whose brightness distribution, elongated in a direction at large angle with the radio–axis and falling down radially roughly as , looks very much different from that expected by a simple IC with the CMB photons. As a consequence we have first checked whether this feature could be due to a non spherically symmetric cooling flow. We find that the addition of a cooling flow to an absorbed power law source may give an adequate representation of the combined ROSAT–ASCA spectrum only if a metallicity solar is assumed. Acceptable fits, but worse than those of the partial covering model (Sect.2), have been obtained with an absorbed power law plus constant or non–constant (s=2 , Mushotzky & Szymkowiak 1988) pressure cooling flow models. We derive intracluster gas densities between and, by applying a King’s model, cluster luminosities erg s-1 in the 0.1–2.4 keV band, that is a factor 15–60 larger than the upper limit to any thermal contribution within the 2ROSAT PSPC extracted radius (Sect.2). Furthermore, the cluster emission would give out X–rays in excess of the observed HRI background by a factor of 1.5–6 at 1distance from the nucleus. We conclude that a cooling flow cannot be responsible for the C–component.
We propose that the main features of this component can be explained by the IC scattering of the IR–optical radiation from a hidden quasar with the surrounding relativistic electrons of the radio source, according to the model developed by Brunetti et al.(1997).
4.1 An IC model of component C
The IR–optical emission of the nuclear source, as seen by the relativistic electrons in the radio lobes, is made of two components: the direct radiation from the quasar, for those electrons located within the emission cones (assumed half–opening angle ), plus the reprocessed radiation from the dusty molecular torus surrounding the quasar. In the model we have fixed the inclination of the radio–axis with respect to the sky plane at , close to that inferred from the radio–jet data (Bridle et al.1986), while the direction of the torus axis () is a free parameter constrained by the requirement that the nuclear source is not directly seen by the observer (cm-2) and that the IC brightness distribution closely matches the observations (Fig.6).

As already stated in the Introduction, a relevant parameter for the efficiency of the IC model is the IR radiation from the putative hidden quasar. Unfortunately 3C 219 was not detected in a pointed IRAS observation by Impey & Gregorini (1993) and it has not been observed with ISO. The IR spectral properties of the BLRGs observed by IRAS are poorly known. Heckmann et al. (1994) found that the weighted IRAS 10–86 rest frame spectral index of a sample of 9 BLRGs given by the SUPERSCAMPI procedure is . However, the few detected BLRGs show a large dispersion in the 25–60 spectral indices ranging from -0.47 to +0.44 (Impey & Gregorini 1993, Heckmann et al. 1994, Golombek et al. 1988). By assuming an IR spectral shape consistent with the IRAS upper limits and with the range of observed BLRG spectra and, also, with the predicted spectra of dusty tori models (Pier & Krolik 1992), the 6–100 isotropic IR luminosity of 3C 219 could be as large as erg s-1.
To estimate the IR luminosity of the hidden quasar we first notice that the monochromatic luminosities of a sample of low redshift () radio galaxies are on the average times smaller than those of a sample of quasars in the same redshift interval (Heckmann et al. 1992). By applying Pier & Krolik (1992) models to the adopted geometrical configuration of 3C 219 we predict an IR luminosity a factor 3–7 lower than seen from a face–on quasar, depending on the torus parameters. If these ratios and the upper limits for the observed IR luminosity of 3C 219 are adopted, the 6–100 rest frame upper limit on the luminosity of the hidden quasar would be erg s-1.
We have also tried to estimate the luminosity of the hidden quasar by following a different approach.
If a mean optical–X-ray spectral index ( ; Brunner et al. 1994) is adopted, then from the 0.1–2.4 keV rest frame luminosity of erg s-1 () of the unabsorbed nuclear source, and a typical optical spectral index (Richstone & Schmidt 1980), we derive a 350–650 rest frame luminosity erg s-1. A similar value (erg s-1) is obtained by making use of the correlations between the radio, optical and X–ray powers of radio loud quasars (Browne & Murphy 1987, Kembhavi 1993).
Since Heckmann et al. (1992,94) have shown that the 6–100 rest frame luminosity of radio loud quasars is a factor 6–8 larger than the 350–650 rest frame optical luminosity, we find an expected 6–100 luminosity erg s-1, larger but close to the upper limit derived in the first estimate previously discussed.
As a consequence in the IC model described below we will adopt a 6–100 luminosity erg s-1 for the 3C 219 hidden quasar, which corresponds to an IR–optical 100–0.35 rest frame luminosity of erg s-1 if typical IR–optical spectral parameters are assumed (Brunetti et al. 1997).
In our model computations, we assume an emission pattern of the reprocessed IR radiation close to that predicted by the theoretical models of Pier & Krolik (1992). It should be stressed, however, that, due to the smoothing made by the PSF of the ROSAT HRI, a precise knowledge of this pattern is not crucial. A possible additional beamed IR emission (Hes et al. 1995) has not been taken into account, but being it directional anyway it would affect the calculation only in a small fraction of the radio–volume.
In order to get some insight into the spatial distribution of the relativistic particles, we have constructed a 3D contour of the radio–volume by making use of the weakest isophote in the 1.4GHz–VLA map of Clarke et al. (1992). The radio galaxy volume is assumed to be symmetric around the line joining the mid–points of the weakest radio isophote at each fixed distance from the nucleus. We have deprojected the structure with the inclination angle and obtained a virtual 3D model of the radio galaxy. Obviously, this is a rather crude approximation as might be indicated by the complex structure of the radio isophotes. Given the spectral properties of the hidden quasar and those of the relativistic electrons, a numerical code computes the total IC soft X–ray luminosity and brightness distribution projected on the plane of the sky. In order to obtain a map to be compared with that derived from the observations, the contribution from the IC scattering of the CMB photons and the observed background level were added to the theoretical matrix, the brightness distribution was convolved with the ROSAT HRI PSF and smoothed with the same gaussian function used for the data (Sect.3).
As a first approximation we consider an uniform distribution of the relativistic particles and an electron spectrum extended to lower energies with the slope indicated by the radio spectral index, not modified by radiative and adiabatic losses.
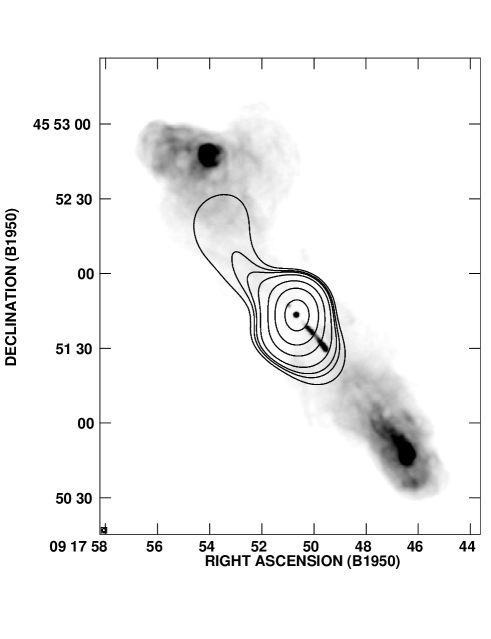
One can distinguish two regions in the X–ray brightness distribution of the model (Fig.7): at small distances from the nucleus (comparable with the minor axis of the radio galaxy) the X–ray emission distribution depends mainly on the nuclear radiation field, the X–ray axis being that of the quasar illumination cone; at larger distances from the nucleus the X–ray distribution is mainly determined by the distribution of the relativistic particles and the X–ray emission tends to be more and more aligned with the radio structure. The IC X–ray flux from the far lobe can be considerably larger than that from the near one depending on the inclination of the radio–axis on the sky plane. As shown by Brunetti et al.(1997) in the case of ellipsoidal radio galaxies, the predicted ratio for an inclination can range up to , depending on the relative contribution due to the IC scattering of the CMB photons and on the luminosity of the hidden quasar. This may explain the larger extension of the observed brightness distribution toward the northern lobe. At larger distances from the nucleus, where the nuclear photon energy density becomes lower than that of the CMB, the IC with the CMB dominates the X–ray flux and the resulting X–ray brightness distribution becomes aligned with the radio–axis.
The model reproduces fairly well the observed brightness in the extended inner regions where the IC emission is dominated by the scattering of the radiation from the nuclear source (Fig.5 and Fig.7).
The required inclination of the dusty torus is such that its axis makes an angle of with the radio–axis and with the line of sight. Large tilts between the radio and dusty lane/torus axis for a number of radio galaxies have been discovered with ground based telescopes (Möllenhoff et al. 1992) and more recently with HST observations (Ford et al. 1994, de Juan et al. 1996). It also follows that the distribution of the relativistic particles within the C–component is uniform, at least on the smoothing scale ( Kpc).
The required relativistic electron density can be compared with that derived by the minimum energy (equipartition) argument. Since relativistic electrons with energies much lower () than those of the synchrotron (radio) electrons dominate our IC model, we apply the equipartition equations given by Brunetti et al. (1997) for a fixed low energy cut off in the electron spectrum (in this paper and ). The equipartition magnetic field strength evaluated by assuming the minimum energy condition over all the radio–volume and equal energy density between negatively and positively charged particles is G (with standard equipartition formulae it would be G).
Our model requires a density of relativistic particles such that G, i.e. 3.3 times smaller than the equipartition value. The minimum energy hypothesis is not fulfilled, the energy in the particles being a factor 10 larger than in the equipartition case. In the case of Fornax A, Feigelson et al.(1995) also found a similar, although smaller, departure from the equipartition condition, while in the case of the radio galaxy PKS 1343–601 (cen B), Tashiro et al.(1998) find that the energy density of the relativistic particles (), equally distributed between negative and positive charges, is a factor larger than that of the magnetic field. With the parameters given in Tashiro et al. paper, by including the energy contribution of mildly relativistic particles (), we derive a ratio between particle and magnetic field energy densities, that is a value of the same order as that found in the case of 3C 219.
4.2 The external components
The simple model discussed so far cannot explain the rather complex structure seen in the external regions where the IC scattering of the quasar’s photons becomes more and more negligible. The IC scattering of the CMB photons may explain the observed features under the assumption that there are deviations from the assumed uniformity and simple 3D geometry of the spatial distribution of the relativistic particles. In general, variations of a factor 2–2.5 in the relativistic electron column densities in excess of those of our model would be sufficient to give the observed X–ray brightness distribution. There is some evidence that this might be the case.
Let us consider first the N–component. Both the radio brightness (Fig.5) and the 1.4–5 GHz spectral index distributions (Clarke et al. 1992) indicate the possible presence of a flow of relativistic particles toward the E–W direction from the northern hot–spot to the N–component, which coincides with a region of steeper radio spectral index.
Since at the position of the N–component our basic IC model predicts a number of counts 3/4 that of the background (of which 20% from the IC scattering of the nuclear photons), the observed signal can be generated by an increase of a factor 2.5 in the number of relativistic electrons. We have tested this hypothesis under the assumption that the back–flow might provide the required enhancement in the density of relativistic particles leaving the magnetic field strength unchanged, i.e. a factor 3.3 lower than the equipartition value of Sect.4.1. By assuming an electron injection spectrum and radiative losses, we find a synchrotron radio brightness of the western part of the north lobe and a 1.4–5 GHz spectral index both consistent with Clarke et al.(1992) findings. The implied age of the particles reservoir would be years. (For these calculations we have used the SYNAGE package of Murgia & Fanti, 1996).
Let us consider now the S–component. Our basic IC model predicts a number of counts, of which 35% from the IC scattering of the nuclear photons, close to that of the background. Here an enhancement of a factor of 2 in the density of relativistic electrons would be sufficient to account for the observed X–ray flux.
We notice that the S–component lies in a region between the radio jet and the southern hot–spot where there is evidence of a systematic steepening of the radio spectral index and where the magnetic field lines surround a lobe of brighter radio emission, being perpendicular to the line joining the radio–jet with the hot–spot itself (see the polarization map in Clarke et al. 1992). This may suggest a strong interaction between two relativistic plasmas, one of which a back–flow from the hot–spot.
We have also considered the possibility that the S and N–components are of thermal origin. The contribution of these components to the total X–ray flux is 15% and we know from the spectral analysis that at most 10% of the total flux can be thermal ( keV). Thus it is possible that at least one of these components is of thermal origin. From the rotation measure (RM) and depolarization maps Clarke et al.(1992) find that an external clumpy medium is responsible for the observed RM and depolarization features. For the sake of clarity we present in Fig.8 the X–ray brightness overlayed onto the depolarization map.
The coincidence of the S–component with the depolarization structure transverse to the radio–axis is striking, while a spotted distribution of moderate depolarization is also observed on the southern part of the N–component. On the other hand, we notice that the X–ray isophotes of the northern radio lobe appear to carefully avoid regions of larger depolarization. This is a somewhat contradictory result. Therefore, we have concentrated our attention on the S–component only.
Let us suppose that, according to the spectral analysis of Sect.2, the source is surrounded by a magnetized thermal plasma with a temperature 1.5 keV and in pressure equilibrium with the relativistic plasma. In our non–equipartition model the pressure inside the radio lobes is dyne cm-2 and the resulting external gas density would be cm-3. The strength of the S–component entails an emission measure pc cm-6, that is a depth of the emission region kpc, much larger than the observed feature. The thermal model may be eased by assuming that the gas is highly clumped. We find that a structure with an overall size 50 kpc, a filling factor of a few percentage points and clumps with a mean size 1 kpc may account for the observed X–ray intensity and depolarization (). A detailed model would require the knowledge of the RM structure function (Tribble, 1991). We tentatively conclude that a thermal origin of the S–component cannot be ruled out.
Finally, we notice that the hot–spots are not detected at the sensitivity level of our HRI observation. While the binning and smoothing procedures used to enhance the HRI image statistics give a convolved PSF much larger than the southern hot–spot dimension, thus depressing any upper limit on the X–ray flux from the hot–spot itself, the convolved PSF is comparable with the northern hot–spot extension. The northern hot–spot has been resolved at 1.4 GHz with an angular size of 12 arcsec (Clarke et al. 1992). From the analysis of the digitized 1.4 GHz map of 3C 219 we derive a radio flux 250 mJy contributed by the hot–spot within a circular region of 90 arcsec2, comparable with our X–ray beam size, and compute an equipartition () magnetic field strength G. The 2– upper limit of the X–ray brightness of the hot–spot is erg s-1 cm-2 arcsec-2. This allows us to set an upper limit to the density of the relativistic electrons Compton scattering the CMB photons and a lower bound to the magnetic field of G, which is a factor of 4.8 lower than the equipartition value. Therefore, a deviation from the equipartition condition in the hot–spot as well as in the lobes cannot be ruled out.
5 Conclusions
A deep ROSAT HRI X–ray image of the FRII radio galaxy 3C 219 shows a point–like source, coincident with the nucleus of the galaxy and accounting for 74 % of the total net counts (60 % of the total net counts by taking into account the spectral information), and an emission aligned with the radio structure that extends from the innermost region of the radio galaxy to the hundred–kpc scale.
The 0.1–10 keV spectrum is well represented by a partial covering model in which 74% of a power law spectrum () is absorbed by a column density cm-2. This spectral slope coincides with that of the synchrotron emission of the radio lobes. The spectral analysis indicates that at most 10% of the X–ray flux could be due to a thermalized gas with a temperature of 1.5 keV. The point–like source, whose de–absorbed (isotropic) luminosity in the 0.1–2.4 keV band is erg s-1, can be identified with the emission of a quasar hidden in the nucleus of 3C 219. This lends further support to the unification of FRII radio galaxies with radio loud quasars.
Subtraction of the point–like source leaves an extended, unabsorbed circumnuclear component (named C) whose luminosity in the 0.1–2.4 keV band is erg s-1. It appears unlikely that a cooling flow may explain this component because the X–ray emission from the associated intracluster gas would exceed by far the observed counts. As a matter of fact, we have no evidence of a diffuse hot intracluster gas.
In agreement with the unification scheme, we have constructed a simplified model in which the main features of the C–component can be satisfactorily explained as IC scattering of the IR–optical radiation from the hidden quasar, and surrounding dusty/molecular torus, with the relativistic electrons uniformly distributed in the radio lobes. Since the C–component is significantly inclined with respect to the direction of the radio–jet, our model implies a large tilt () between the radio jet and the torus axis. Because of the limits one can place on the luminosity of the hidden quasar, we find that the X–ray flux of the C–component can be accounted for if the equipartition condition is violated, the energy in the relativistic particles being at least a factor 10 larger than that in equipartition conditions. The electrons mainly involved in the IC production of the soft X–rays have energies much lower () than those of the electrons producing the synchrotron radio emission. Therefore, if our model is correct, it can provide useful constraints on the particle acceleration mechanisms and aging of the radio source.
The X–ray structures (named S and N–components) observed in the outer regions cannot be explained by our model in which the relativistic particles are uniformly distributed within the radio lobes (it should be borne in mind that we have consistently included in our computations the contribution from the IC scattering of the CMB photons, which is of minor importance for the C–component, but dominant as one goes further out in the radio lobes). Accounting for these structures by the IC process requires positive fluctuations of a factor 2–2.5 in the column densities of the relativistic electrons. We tentatively associate this possibility with the evidence of back flows from the hot–spots. Alternatively, we cannot exclude the possibility of a thermal contribution from a hot (kT 1.5 keV) clumpy gas surrounding the radio lobes in localized regions. The presence of moderate depolarization and RM gradients from the radio maps supports this hypothesis in the case of the S–component. Observations with AXAF will provide an invaluable tool to verify our model and the nature of the X–ray emission of 3C 219.
Acknowledgements.
We warmly thank Ingo Lehmann and Günther Hasinger for their help in the wobble correction procedure for the analysis of the HRI data, and Gianni Zamorani for helpful discussions. We also thanks the referee for halpful comments. The radio image has been retrieved by the web archive of the DRAGNs by Leahy, Bridle and Strom (http://www.jb.man.ac.uk/atlas/). This research has made use of the NASA/IPAC Extragalactic Database (NED) which is operating by the Jet Propulsion Laboratory, California Institute of Technology under contract with the National Areonautic and Space Administration. This work has been partially supported by the Italian Space Agency (ASI–ARS–96–70).References
- [] Allen W., Fabian A.C., 1992, MNRAS 258,29P
- [] Barthel P. D., 1989, ApJ 336, 606
- [] Baum S.A., Heckman T.M., Bridle A., van Breugel W.J.M., Miley G.K., 1988, ApJS 68, 643
- [] Böhringer H., Voges W., Fabian A.C., Edge A.C., Neumann D.M., 1993, MNRAS 264L, 25
- [] Bridle A.H., Perley R.A., Henriksen R.N., 1986, AJ 92, 534
- [] Browne I.W.A., Murphy D.W., 1987, MNRAS 226, 601
- [] Brunetti G., Setti G., Comastri A., 1997, A&A 325, 898
- [] Brunner H., Lamer G., Worrall D.M., Staubert R., 1994, A&A 287, 436
- [] Burbidge G., Crowne A.H., 1979, ApJS 40, 583
- [] Cappi M., Matsuoka M., Comastri A., Brinkmann W., Elvis M., et al., 1997, ApJ 478, 492
- [] Carilli C.L., Perley R.A., Harris D.E., 1994, MNRAS 270, 173
- [] Clarke D.A., Bridle A.H., Burns J.O., Perley R.A., Norman M.L., 1992, ApJ 385, 173
- [] Crawford C.S., Fabian A.C., 1995, MNRAS 273, 827
- [] Crawford C.S., Fabian A.C., 1996, MNRAS 282, 1483
- [] Cruddace R.G., Hasinger G., Schmitt J.H.M.M., 1988, Proceedings of : Astronomy for large database : Scientific objectives and methodological approaches, Garching (Germany), 177
- [] de Koff S., Baum S.A., Sparks W.B., Biretta J., Golombek D., et al., 1996, ApJS 107, 621
- [] de Juan L., Colina L., Golombek D., 1996, A&A 305, 776
- [] Dickey J.M., Lockman F.J., 1990, ARA&A 28, 215
- [] Dotani T., et al. 1996, ASCA Newsl. 4, 3
- [] Fabbiano G., Trincheri G., Elvis M., Miller L., Longair M., 1984, ApJ 277, 115
- [] Fabbiano G., Willner S.P., Carleton N.P., Elvis M., 1986, ApJ 304, L37
- [] Fabian A.C., 1994, ARA&A 32, 277
- [] Feigelson E. D., Laurent-Muehleisen S. A., Kollgaard R. I., Fomalont E. B., 1995, ApJ 449, L149
- [] Ford H.C., Harms R.J., Tsvetanov Z.I., Hartig G.F., Dressel L.L., et al., 1994, ApJ 435L, 27
- [] Garrington S.T., Conway R.G., 1991, MNRAS 250, 198
- [] Golombek D., Miley G.K., Neugebauer G., 1988, AJ 95, 26
- [] Hardcastle M.J., Birkinshaw M., Worrall D.M., 1998a, MNRAS 294, 615
- [] Hardcastle M.J., Worrall D.M., Birkinshaw M., 1998b, astro–ph/9802175
- [] Harris D. E., Carilli C. L., Perley R. A., 1994, Nature 367, 713
- [] Harris D.E., Silverman J.D., Hasinger G., Lehmann I., 1998, submitted to A&A
- [] Heckman T.M., Chambers K.C., Postman M., 1992, ApJ 391, 39
- [] Heckman T.M., O’Dea C. P., Baum S. A., Laurikainen E., 1994, ApJ 428, 65
- [] Hes R., Barthel P.D., Hoekstra H., 1995, A&A 303, 8
- [] Hill G.J., Lilly S.J., 1991, ApJ 367, 1
- [] Kaneda H., Tashiro M., Ikebe Y., Ishisaki Y., Kubo H., et al., 1995, ApJ 453, L13
- [] Kembhavi A., 1993, MNRAS 264, 683
- [] Impey C., Gregorini L., 1993, AJ 105, 853
- [] Laing R.A., Riley J.M., Longair M.S., 1983, MNRAS 204, 151
- [] Lampton M., Margon B., Bowyer S., 1976, ApJ 208L, 177
- [] Lawrence C.R., Zucker J.R., Readhead A.C.S., Unwin S.C., Pearson T.J., Xu W., 1996, ApJS 107, 541
- [] Lawson A.J., Turner M.J.L., 1997, MNRAS 288, 920
- [] Möllenhoff C., Hummel E., Bender R., 1992, A&A 255, 35
- [] Morrison R., McCammon D., 1983, ApJ 270, 119
- [] Murgia M., Fanti R., 1996, Internal Report, IRA 228/96
- [] Mushotzky R.F., Szymkowiak A.E., in ’Cooling flows in cluster and galaxies’;Proc. of the NATO Adv. Research Workshop, Cambridge, UK, June 22–26, 1987. Dordrecht, Netherlands, Kluwer Academic Publishers, 1988, 53
- [] Perley R.A., Bridle A.H., Willis A.G., Fomalont E.B., 1980, AJ 85, 499
- [] Pfeffermann, E., Briel U.G., Hippmann H. et al., 1986, in Proc. SPIE 733, Soft X-ray optics and Technology, p. 519
- [] Pier E.A., Krolik J.H., 1992, ApJ 401, 99
- [] Prieto M.A., 1996, MNRAS 282, 421
- [] Reynolds C.S., Fabian A.C., 1996, MNRAS 278, 479
- [] Richstone D.O., Schmidt M., 1980, ApJ 235, 361
- [] Shafer, R.A., Haberl, F., Arnaud, K.A., Tennant, A.F. 1991, XSPEC User’s Guide, ESA TM–09, Noordwijk, The Netherlands
- [] Tanaka Y., Inoue H., Holt S.S., 1994, PASJ 46, L37
- [] Tashiro M., Kaneda H., Makishima N., Iyomoto N., Idesawa E., et al., 1998, ApJ 499, 713
- [] Taylor G.L., Dunlop J.S., Hughes D.H., Robson E.I., 1996, MNRAS 283, 930
- [] Tribble P.C., 1991, MNRAS 250, 726
- [] Ueno S., Koyama K., Nishida M., Yamauchi S., Ward M.J., 1994, ApJ 431, L1
- [] Urry C.M., Padovani P., 1995, PASP 107, 803
- [] Worrall D.M., Lawrence C.R., Pearson T.J., Readhead A.C.S., 1994, ApJ 420, L17
- [] Yates M.G., Miller L., Peacock J.A., 1989, MNRAS 240, 129
- [] Zimmermann, H.U., Belloni, T., Izzo, C., Kahabka, P., Schwentker, O. 1993, EXSAS User’s Guide, MPE Report 244