Recent X-ray observations of intermediate BL Lac objects
Abstract
We present recent ROSAT, ASCA and SAX observations of intermediate BL Lac objects (IBLs), i.e. BL Lacs which are located between high-energy and low-energy peaked BL Lac objects with respect to . Both the statistical properties of IBLs from the RGB sample and a detailed broad band X-ray spectral analysis of two objects (1424+2401, 1055+5644) point towards a continuous distribution of synchrotron emission peak frequencies among BL Lac objects.
Max-Planck-Institut für extraterrestrische Physik, Postfach 1603, 85740 Garching, Germany
IGPP/LLNL, 7000 East Ave., Livermore, CA 94550, USA
1. Introduction
The spectral energy distribution (SED) of BL Lac objects is dominated by non-thermal emission from a relativistic jet oriented close to the line of sight. It is characterised by two peaks, where the first lies in the IR to soft X-ray range and is thought to be due to synchrotron radiation. The second peak is in the -ray range and most likely due to inverse–Compton radiation.
It is well established that BL Lac objects detected in radio surveys (RBLs) show markedly different properties compared to BL Lacs detected in X-ray surveys (XBLs). In general, the latter are less extreme in terms of variability, polarization, superluminal motion and luminosity. Also, RBLs show stronger optical emission lines than XBLs and most of the BL Lac objects detected in –rays belong to the RBL class.
The unification of RBLs and XBLs is still a matter of debate. The angle between the relativistic jet and the line of sight is certainly an important parameter (e.g. Celotti et al. 1993), but it has been shown (e.g. Sambruna et al. 1996) that orientation alone cannot explain the large differences in the spectral energy distribution of the two classes. A second parameter could for example be the jet kinetic luminosity (Georgantopoulos & Marscher 1998) or the frequency of the synchrotron peak (e.g. Padovani & Giommi 1995). The latter suggestion has led to a re-classification of BL Lacs into HBLs and LBLs, i.e. high– and low–frequency peaked BL Lac objects, where most of the XBLs and RBLs belong to the HBL and LBL class, respectively.
Selection effects, caused by the high flux limits of previous samples (e.g. 1-Jy sample, EMSS sample), clearly are important and might explain much of the apparent dichotomy of BL Lac objects. Therefore it is desirable to establish new, large and complete samples of BL Lac objects with deeper flux limits. In particular, the properties of intermediate BL Lacs (IBLs), i.e. those which fill the gap between LBLs and HBLs, play an important role for BL Lac unification theories.
2. Statistical properties of the RGB sample of intermediate BL Lacs
Recently, a new large sample of BL Lac objects has become available (cf. Laurent-Muehleisen et al., this volume). It is a subsample of the so-called RGB sample, which resulted from the cross-correlation of the ROSAT All-Sky Survey and the 87GB 5GHz radio survey. After accurate radio positions were obtained by VLA observations of more than 1900 sources of this sample (Laurent-Muehleisen et al. 1997), the optical identification of a properly selected subgroup resulted in more than 50 new BL Lacs, adding to the about 100 previously known BL Lac objects contained in the RGB sample.
The distribution in , the spectral index between 5GHz and 1 keV, is shown in Fig. 1 for the RGB BL Lacs. For comparison the distributions for the 1-Jy and the EMSS sample are also shown. Clearly, there is a continuous distribution in and the gap between HBLs and LBLs is filled with a number of objects. There are 22 BL Lacs with 0.70.8, which constitute our sample of intermediate BL Lac objects.
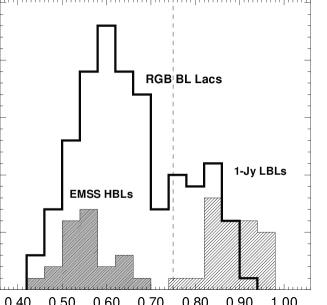

Fig. 2 shows the soft X-ray photon index in the 0.1–2.4 keV energy band as a function of the peak frequency of the synchrotron component . The peak frequencies were simply determined by parabolic fits to the radio, optical and X-ray fluxes. The photon indices for LBLs and HBLs were taken from Urry et al. (1996) and Perlman et al. (1996), whereas the values for the IBLs were derived from hardness ratios. Only datapoints with are shown. As already noted by Padovani & Giommi (1996), LBLs follow a positive and HBLs a negative correlation in this diagram, which is nicely explained within the two component emission model. In this scenario, IBLs are expected to show intermediate peak frequencies (in the optical) and rather steep soft X-ray spectra. Indeed, the average peak frequency for IBLs is , compared to and for LBLs and HBLs, respectively. Also the photon indices for the IBL sample are consistent with the two component model and a continuous distribution of synchrotron peak frequencies.
3. Broad band X-ray spectra of two IBLs
3.1. 1424+2401


A representation of the ASCA spectrum of the IBL 1424+2401 is shown in Fig. 3. This source was originally considered to be a white dwarf, but was re-classified as a BL Lac by Impey & Tapia (1988) and Fleming (1993). The ratio of data to model, where the model is a simple power law fit between 2 and 5 keV, indicates a curved spectrum, i.e. a flattening at the low and the high energy end. A model with two energy breaks around 1 and 5 keV significantly improves the fit. The flattening towards higher energies might be interpreted in terms of a flat inverse–Compton component that starts to dominate the X-ray spectrum. The flux deficit at lower energies cannot be due to absorption, since the necessary NH values would be inconsistent with the ROSAT PSPC spectrum.
The spectral energy distribution SED of 1424+2401 is compared to Mrk 501 and OJ 287 in Fig. 4. The latter represent typical HBLs and LBLs, respectively. The vertical bars denote the peak frequencies of a third-order polynomial fit to the datapoints (dashed lines) and the open triangles represent the ROSAT PSPC spectrum of 1424+2401. The peak frequency and the very steep X-ray spectrum confirm the intermediate nature of 1424+2401 and hence indicate a continuous distribution of peak frequencies in BL Lac objects.
3.2. 1055+5644
1055+5644 is one of the newly identified BL Lac objects from the RGB sample. The combined SAX LECS/MECS data of 1055+5644 indicate a steep X-ray spectrum (). No significant curvature is seen, apart from a marginal flattening in the spectrum above 5 keV in the MECS data. In this context we note that 1055+5644 is included in the third EGRET catalog (Hartmann et al., this volume). The SED of 1055+5644 is again typical for IBLs, i.e. it shows a peak frequency in the optical/NIR.
4. Conclusions
The RGB sample for the first time allows to study the bulk properties of BL Lac objects over a broad range of SEDs. In particular, a large number of intermediate BL Lac objects (IBLs) is contained in the sample. The statistical properties of this first sample of IBLs are consistent with the hypothesis that the BL Lac population can be described by a continuous distribution of synchrotron peak frequencies.
The ASCA spectrum of 1424+2401 is steep and displays significant curvature. In particular, the flattening at energies 5 keV points towards a flat IC component, which begins to dominate at these energies. The SEDs of both 1424+2401 and 1055+5644 confirm the intermediate nature of these BL Lac objects.
References
Celotti A., Maraschi L., Ghisellini G., Caccianiga A., Maccacaro T. 1993, ApJ, 416, 118
Fleming T.A., Green R.F., Januzzi B.T., Liebert J., Smith P.S., Fink H.H. 1993, AJ, 106, 1729
Georganopoulos M., Marscher A.P. 1998, ApJ, in press
Impey C.D., Tapia S. 1988, ApJ, 333, 666
Laurent-Muehleisen S.A., Kollgaard R.I., Ryan P.J., Feigelson E.D., Brinkmann W., Siebert J. 1997, A&AS, 122, 235
Padovani P., Giommi P. 1995, ApJ, 444, 567
Padovani P., Giommi P. 1996, MNRAS, 279, 526
Perlman E.S., Stocke J.T., Wang Q.D., Morris S.L. 1996, ApJ, 456, 451
Urry C.M., Sambruna R.M., Worrall D.M., Kollgaard R.I., Feigelson E.D., Perlman E.S., Stocke J.T. 1996, ApJ, 463, 424