Early Type galaxies in the Hierarchical Universe
Abstract
Any realistic theory of galaxy formation must be set in the context of a model for the formation of structure in the universe. We describe a powerful approach – semi-analytic modelling – that combines a set of simple rules describing the gas processes involved in galaxy formation with a scheme to follow the hierarchical growth of dark matter haloes. Surprisingly few free parameters are required to specify the model, and these are fixed with reference to a subset of local observational data. The model produces the full star formation history of a galaxy, allowing a wide range of predictions to be made. We review some of the successes of the models, namely the star formation history of the universe and the evolution of galaxy clustering, before focusing our attention on early-type galaxies. We discuss the observational evidence against the classical picture in which early-type galaxies form at some arbitrarily high redshift in a single monolithic collapse and burst of star formation. The alternative scenario in which spheroidal systems are formed by the merger of disk galaxies is outlined. We review some of the predictions of this model, namely the colour-magnitude relation, the faint counts and the evolution of cluster membership.
Department of Physics, Durham University, South Road, Durham, DH1 3LE, UK
Theoretical Astrophysics Center, Juliane Maries Vej 30, Copenhagen, Denmark
1. Introduction
The classical picture of the formation of early type galaxies, in which the stars form in an intense burst at high redshift and then passively evolve to the present day, was worked out in the late 1960’s and early 1970’s (see for example Larson 1975 and references therein). Since this time, significant advances have been made in our understanding of the formation of structure in the universe. This is due to two reasons; the development of powerful theoretical techniques to follow the development of cosmological structures. and the completion of increasingly large surveys of the local universe.
Several galaxy surveys have recently been completed that probe structure in the universe to a depth of Mpc (e.g. Saunders etal. 1991; Loveday etal. 1992). The largest of these contains more than 20000 redshifts (Schectman etal. 1996). The next generation of redshift surveys, which will be completed early in the next millenium, will contain an order of magnitude more redshifts. Angular catalogues currently probe even larger volumes; the APM Survey contains two million galaxies and extends to more than Mpc (Maddox etal. 1996). These surveys allow galaxy clustering to be measured on scales of tens of megaparsecs, which can reveal the nature of the primordial density fluctuations, subject to the uncertainty in the way that the galaxies trace out the underlying density field. Clustering studies at high redshift are also now becoming a reality, as exemplified by the measurement of strong clustering in the population of Lyman-break galaxies at (Adelberger etal. 1998 - see also Section 4).
Models for the primordial density fluctuations have developed in response to our changing knowledge of the structure in the universe. The Cold Dark Matter (CDM) model is the most successful and long-lived of these scenarios, despite the fact that a suitable candidate CDM particle has yet to be discovered. The amplitude of density fluctuations is constrained on large scales by the measurement of anisotropies in the cosmic microwave background radiation by the COBE satellite (Smoot etal. 1992). On Mpc scales, the local abundance of hot X-ray clusters provides tight constraints on the density fluctuation amplitude (White, Efstathiou & Frenk 1993; Eke, Cole & Frenk 1996). The simplest choice of parameters in the CDM model, known as standard CDM, cannot simultaneously satisfy these constraints. This has led to interest in variants of the model such as the currently popular low density universes, either with or without a vacuum energy or cosmological constant term.
The development of structure formation theory has been greatly aided by N-body simulations, which can follow the growth of density fluctuations well into the nonlinear regime. The current state of the art is represented by the Hubble volume simulation with one billion particles in a cube of Mpc on a side (The Virgo Consortium - see Glanz 1998) and by high resolution simulations of individual dark matter haloes with several million particles (Moore etal. 1998a).
The conclusion reached from these studies is that there is a lot of evidence, though most of it circumstantial, in support of a hierarchical sequence of structure formation in a universe in which most of the mass is in the form of collisionless dark matter.
2. Semi-analytic galaxy formation

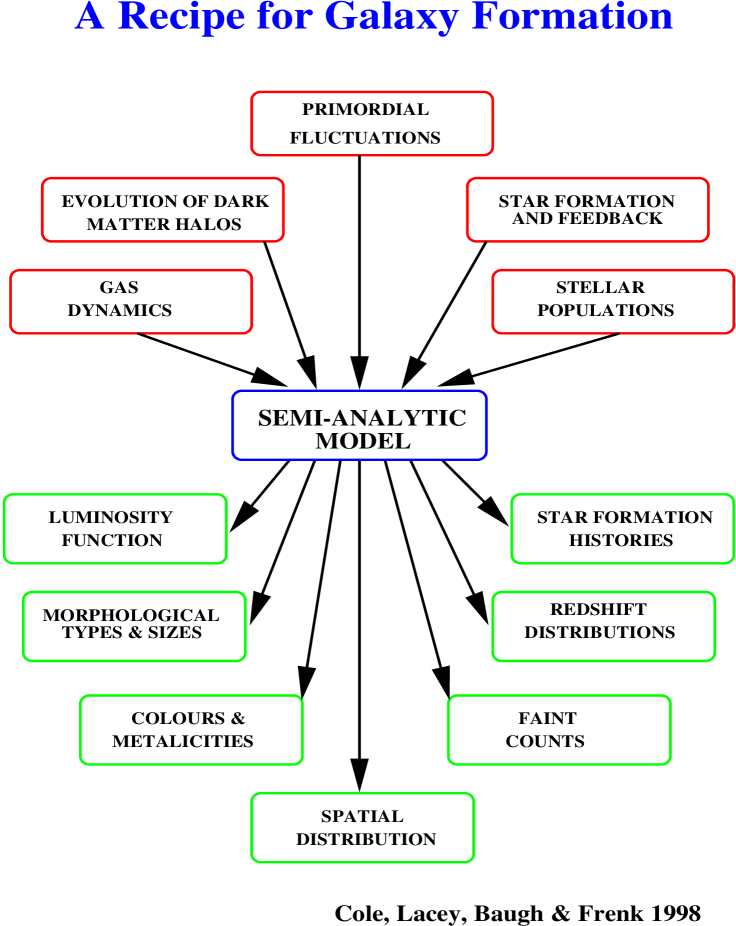
The basic idea of hierarchical galaxy formation was outlined twenty years ago by White & Rees (1978). Galaxies form when shock heated gas cools and condenses inside dark matter haloes. The haloes themselves form via mergers and the accretion of smaller sub-units. Following on from the work of White & Frenk (1991) and Cole (1991), several groups have developed semi-analytic models of galaxy formation that can track the entire star formation and merger histories of galaxies (Kauffmann, White & Guiderdoni 1993; Lacey etal. 1993; Cole etal. 1994; Somerville & Primack 1998).
There are two main components to any such model: a scheme to describe the growth of dark matter haloes and a set of rules to describe both the gas processes involved in star formation and the mergers of galaxies within the dark matter haloes.
The growth of dark matter haloes is the best understood of these components, due to the extensive tests of the analytic theories that have been made against the results of N-body simulations (e.g. Lacey & Cole 1994). The majority of models use a Monte-Carlo scheme (e.g. Kauffmann & White 1993; Somerville & Kolatt 1998) to generate a merger history for each dark matter halo; the distribution of progenitor masses at a given redshift can be compared with the extension of Press & Schechter’s (1974) theory for the mass function of bound objects, derived by Bower (1991) and by Bond etal. (1991). Alternatively, one could extract the merger history of a dark matter halo directly from a N-body simulation, using closely spaced output times (Kauffmann etal. 1998). Statistically, the merger trees generated with a Monte-Carlo algorithm and those extracted from simulations appear to be equivalent; furthermore, the merger history of a dark matter halo is independent of its local environment (Lemson & Kauffmann 1998).
Our present understanding of the complex physical processes involved in star formation can be encapsulated into a set of simple rules that describe the following stages:
-
(i)
Gas is shock heated to the virial temperature of its host dark matter halo.
-
(ii)
Hot gas cools radiatively at a rate that depends upon its density and chemical composition (Rees & Ostriker 1977; Silk 1977; Binney 1977).
-
(iii)
Cold gas turns into stars.
-
(iv)
Some form of regularisation or feedback of the star formation process prevents all the gas from cooling in small objects at high redshift, when cooling is most efficient due to the high density.
-
(v)
Stellar population synthesis gives a luminosity and colour for each galaxy (Bruzual & Charlot 1993, 1998).
-
(vi)
Galaxies may merge together - see Section 5.
The interplay of these various processes is illustrated by Figure 1. This shows the fraction of baryons that are in the form of cold gas or stars as a function of the mass of the host dark matter halo. Within a particular halo, we have added the contribution of the satellite galaxies to the cold baryons in the galaxy that resides at the centre of the halo. For haloes less massive than , the fraction of cold baryons is low due to feedback; this is parameterised in such a way that star formation is suppressed more strongly in low mass haloes. Higher mass haloes form relatively recently and have a lower mean and central gas density; cooling in these haloes is therefore inefficient.
A surprisingly small number of parameters are needed to produce a fully specified galaxy formation model. These are set with reference to a subset of the observational data at low redshift; either the normalisation of the local luminosity function (Cole etal. 1994) or the zero-point of the Tully & Fisher (1977) relation between the rotation speed and luminosity of spiral galaxies (Kauffmann etal. 1993). This gives the models tremendous predictive power. The Durham group have recently overhauled the model described by Cole etal. (1994); the main additions are a new method to generate merger histories for dark matter haloes, a prescription for chemical enrichment, a treatment of galaxy sizes and the inclusion of dust (Cole etal. 1998). The model predicts an enormous range of individual and global properties of galaxies: bulge and disk scale lengths, bulge and disk magnitudes and stellar metallicities, star formation rates, morphological type, colour, luminosity function, number counts, redshift distributions and clustering.
This physical approach can be contrasted with the one adopted in empirical models, which extrapolate the properties of present day galaxies back in time. It is instructive to count the parameters that are involved in such a model, for example to reproduce the number counts of faint galaxies. One starts with a range of morphological types, each of which has a template form for the spectral energy distribution, in order to compute the bandshift and evolutionary corrections to the galaxy magnitude when viewed at different redshifts. Two parameters are needed to reproduce this spectrum - an initial time when star formation is switched on and a star formation timescale. Next, a luminosity function is specified for each type. This requires three parameters, the normalisation, the characteristic luminosity and the faint end slope. If we want to use five different morphological or spectral types in this kind of model, we already need to specify parameters. This is before adding an empirical dust correction or invoking fading populations of dwarf galaxies to improve the match with the observed counts. Furthermore, there are two important limitations of this approach that should be borne in mind. Firstly, structure formation in the universe is ignored. No account is taken of how much cold gas is available at high redshift, when the star formation rates are chosen. Secondly, after all this effort, all that one has gained is a model for number counts. To predict any other galaxy properties, further ingredients and parameters have to be added.
3. The star formation history of the universe

Hierarchical models in which star formation in low mass haloes is suppressed by feedback, naturally predict that a large fraction of the stars that we see today formed at fairly low redshifts. Typically of the stars form since a redshift of – (see the solid line in Figure 5). The global star formation rate per unit volume predicted by our upgraded model, in a low density universe with a cosmological constant, is shown by the solid line in the panels of Figure 3. The star formation rate is computed from the flux density and includes obscuration by dust; the effects of dust depend upon the mass of cold gas and metals in the galaxy and the angle it is viewed at. There are small differences between this curve and that shown in Figure 16c of Baugh etal. (1998a), due to improvements in our modelling of gas cooling, the star formation timescale and feedback, which are described fully in Cole etal. (1998). Note that the parameters in this model are set with reference to the local and -band luminosity functions, and have not been readjusted to ‘fit’ the data points in Figure 3 . The predicted star formation rate rises with increasing redshift to –. The star formation rate thereafter remains relatively flat to z, varying by less than an order of magnitude over the entire history of the universe.
New techniques for selecting high redshift galaxies from deep images – the ‘Lyman-break’ galaxies, so-called because they appear red in one colour, due to the redshifted Lyman-limit discontinuity and blue in another colour, due to ongoing star formation (Steidel & Hamilton 1992; Madau etal. 1996) – have allowed the star formation history of the universe to be pieced together. The filled symbols in the top panel of Figure 3 show a compilation of observational determinations of the global star formation rate – full references are given in Baugh etal. (1998a).
We plot the star formation history as a function of lookback time in the lower panel of Figure 3. The area under this curve gives the mass of stars formed. The open symbols show recent determinations of the global star formation rate; the open triangle is a measurement of the star formation rate using the H- flux density at a lookback time of Gyr, taken from Tresse & Maddox (1998). The open stars are inferred from the OII luminosity density measured by Hogg etal. (1998).
4. The evolution of galaxy clustering

We can apply exactly the same colour selection technique to our model galaxies that is applied to deep images of the sky to isolate high redshift galaxies. Our model predicts that galaxies that can be detected as Lyman-break galaxies reside in dark matter haloes of mass . We can compute the correlation function of Lyman break galaxies in our model (Baugh etal. 1998a), using a simple analytic prescription for the bias of their host dark matter haloes (Mo & White 1996; see also Cole & Kaiser 1989). The Lyman break galaxies are predicted to have a correlation length, in comoving units, of around Mpc, similar to that of bright galaxies at the present day (e.g. Baugh 1996). However, at , such a correlation length implies strong clustering relative to the dark matter; we find that the bias parameter of Lyman break galaxies in a critical density universe is – this means that the amplitude of the correlation function of Lyman-break galaxies is more than an order of magnitude greater than that of the dark matter. Governato etal. (1998) combined our semi-analytic model for galaxy formation with an N-body simulation to obtain the spatial distribution of Lyman break galaxies. This allowed the clustering of the Lyman break galaxies to be measured directly; the results are in good agreement with the simple analytic calculation carried out by Baugh etal. (1998a). The predicted correlation length was confirmed by the subsequent measurements of the clustering of Lyman break galaxies (Steidel etal. 1998; Giavalisco etal. 1998; Adelberger etal. 1998).
In general, the correlation function of galaxies evolves with redshift in a much more complicated fashion than the correlation function of the dark matter. The amount of clustering that is measured is sensitive to the observational selection applied to the galaxy population. At a fixed apparent magnitude limit, galaxies at higher redshift have higher intrinsic luminosities, and so are predicted by our model to reside in progressively rarer dark matter haloes, compared with the general population of galaxies in place at that redshift. This means that the high redshift galaxies tend to be biased tracers of the dark matter distribution i.e. they exhibit stronger clustering than the dark matter because they form at the rare peaks of the density field. We contrast the evolution of the galaxy correlation function with that of the dark matter in Figure 4 (Baugh etal. 1998b). The solid lines correspond to , the dotted lines to and the dashed lines to . The comoving correlation length of the dark matter, defined as the length scale at which the correlation function is equal to unity, changes by a factor of over this redshift interval. The change in the galaxy correlation function is much smaller; the galaxy correlation length decreases slightly by before rising to attain essentially the present day value at . The exact factor by which the correlation length changes is sensitive to the magnitude limit applied.
5. The formation of early type galaxies
A natural model for the formation of elliptical galaxies in a universe in which structure formation is hierarchical is through galaxy mergers. This is sometimes called the nurture hypothesis – the environment of a galaxy rather than initial conditions determines its final morphology.
There are a number of pieces of observational evidence in support of the nurture hypothesis. Kauffmann, Charlot & White (1996) used data from the Canada-France Redshift Survey (Lilly etal. 1995) and from the Hawaii Deep Survey (Cowie etal. 1996) to study the fraction of galaxies that have the colour of passively evolving ellipticals out to . The fraction of galaxies with these colours falls to one third of the present day value by , indicating either that the present day ellipticals have not all been assembled by , or that there is some ongoing star formation that changes their colour from that expected for an old, passively evolving population. Zepf (1997) has analysed deep optical and infrared images to search for very red galaxies. If ellipticals formed all their stars in a burst at high redshift, they would have rapidly attained a red colour after the burst epoch. In this case, given the local abundance of early type galaxies, there should be many times more red objects per square degree on the sky than are observed.
The formation of elliptical galaxies in semi-analytic models is outlined by Kauffmann, White & Guiderdoni (1993) and Baugh, Cole & Frenk (1996a). The models assume that gas initially cools into a disk and forms stars. When two dark matter haloes merge, the galaxies within them can coalesce on a quite different timescale. If the dynamical friction timescale for a galaxy is shorter than the lifetime of the dark matter halo it resides in (the lifetime is usually defined as the time until the mass of the halo doubles through accretion and mergers), then the galaxy merges with the central galaxy in the halo. Numerical simulations indicate that some fraction of the accreted satellite mass moves to the central region of the galaxy and the rest is spread out over the disk of the central galaxy (Walker etal. 1996). In our model, we assume that all the accreted stellar material is transferred to the bulge of the central galaxy and that the cold gas of the satellite is added to the disk. If the accreted satellite is above a certain fraction of the mass in cold baryons of the central galaxy, typically taken to be in the range 30%–50%, then the merger is termed a violent merger. In this case, the disk of the central galaxy is destroyed and the stars are moved to the bulge. Furthermore, any cold gas present is turned into stars in a burst and added to the bulge. Hence, immediately after a violent merger, the galaxy will have a pure bulge morphology. Subsequently, more cooling gas can be accreted in a disk and turned into stars, reducing the bulge to disk ratio of the galaxy; this is the quantity that we use to assign a morphological type to the galaxy. The morphology of a galaxy is therefore a function of time in our model.
6. The predicted properties of early type galaxies

6.1. The epoch of bulge formation
The epoch of bulge formation may be defined as the formation time of the stars that make up the bulge or the time at which the bulge is actually assembled – these times can be very different (see Figure 3 of Kauffmann 1996).
Star formation in galaxies that reside in a cluster at the present day is advanced with respect to the field. This is shown by the dashed line in Figure 5, which shows the fraction of the present day stellar mass in place by a given redshift, for galaxies found today in haloes with velocity dispersions in excess of a . Half the stars are in place by a redshift of , compared with a redshift of just over unity for field galaxies. The collapse of the haloes in which the cluster galaxies form is shifted to higher redshifts because they are part of an unusually large overdensity – the cluster halo – today.
The epoch of the last major merger depends upon the present day environment of the galaxy. The median redshift of the last violent or major merger event is for field ellipticals in a critical density universe. For ellipticals found in clusters at the present day, the median redshift of the last major merger is higher, (Baugh etal. 1996a). The amount of cold gas involved in a merger falls as the redshift of the merger decreases. This is a result of the global cold gas fraction peaking around a redshift of –, the epoch when more massive haloes start to collapse in significant numbers – the feedback associated with star formation in these haloes is less severe than it is in low mass systems (see Figure 17 of Baugh etal. 1998a); the cold gas fraction declines after when several e-folding times of the star formation timescale have elapsed. Typically only of the final stellar mass of an elliptical is formed in the burst that accompanies a major merger, if the last major merger takes place after ; between and , the burst of star formation that accompanies a major merger can account for – of the final stellar mass. The stars formed in the burst could be responsible for the ‘intermediate age populations’ detected in some ellipticals (e.g. Rose & Tripicco 1986).
The picture that emerges from the semi-analytic models is that the stellar content of the spheroidal component of a galaxy is formed at high redshift, in smaller fragments. The spheroid is assembled in a violent merger at relatively low redshift.
6.2. The colour magnitude relation of cluster ellipticals
Early-type galaxies in clusters display a remarkably tight sequence of colour as a function of intrinsic brightness (Bower, Lucey & Ellis 1992; Gladders etal. 1998 - see also the contributions of Richard Bower and Omar Lopez-Cruz in this volume). This has been interpreted as a strong indication for a coeval formation epoch for the ellipticals and places strong constraints on any recent star formation.
The semi-analytic models produce a similarly small scatter in the colour-magnitude relation (Baugh etal. 1996a; Kauffmann 1996). The explanation for this is that although the assembly of the bulge or elliptical may be a relatively recent event, the stars involved are old. Baugh etal. obtained a flat colour magnitude relation – this version of the semi-analytic model did not include chemical evolution and only used a solar metallity stellar population model (Bruzual & Charlot 1993). Kauffmann & Charlot (1998) demonstrated that the observed slope of the colour-magnitude relation can be recovered once chemical enrichment is accounted for. These authors argue that big elliptical galaxies are produced by the merger of big spiral galaxies – galaxies in deeper potential wells are better at retaining the metals produced in star formation. The tilt of the colour-magnitude relation is thus interpreted as a result of a sequence in metallicity with intrinsic luminosity.
The scatter in the colour-magnitude relation recovered in the models changes little out to a redshift of (Baugh etal. 1996a). There is a general blueing of the galaxies, which matches that observed (Aragón-Salamanca etal. 1993).
6.3. The evolution of cluster membership
Clusters at high redshift are observed to have a higher fraction of blue or spiral galaxies than low redshift clusters (e.g. Butcher & Oemler 1984; Dressler etal. 1994). One important point to be wary of when comparing observations of clusters at different redshifts, is that an object of a given mass today would correspond to a much rarer object if it was found at higher redshift. It is necessary to take into account the effect this would have on the rate at which the cluster mass is assembled and on the star formation in the progenitor haloes.
Many mechanisms have been proposed for changing the morphologies of galaxies once they fall inside a cluster potential e.g. the harassment of spiral galaxies through numerous impulsive encounters with other galaxies in the cluster (Moore etal. 1998b). An alternative explanation is that the distribution of morphological types of the galaxies that become cluster members changes with redshift (Kauffmann 1995; Baugh etal. 1996a). The number of elliptical galaxies that are in place to become cluster members at is lower than that at . This results from an interplay among the timescales for gas cooling, star formation and galaxy mergers; by more cold baryons are in place and there is more time for galaxy mergers to have occured.
6.4. Number counts of early-type galaxies
The one-tenth arcsecond resolution of images from the Hubble Space Telescope has made it possible to divide the number counts of faint galaxies into the contributions from different morphological types (e.g. Driver etal. 1995, Glazebrook etal. 1995). The counts obtained from our semi-analytic model are in remarkably good agreement with the observations, especially in view of the fact that the one free parameter involved in determining the morphological types – the threshold used in the definition of a violent merger – is set so that the model reproduces the local morphological mix (Baugh etal. 1996b).
7. Summary
We have argued in this review that our knowledge of structure formation has improved tremendously in the past twenty years, and that it would seem both prudent and necessary to incorporate the growth of structure when building models for galaxy formation. Several groups around the world have developed semi-analytic prescriptions for galaxy formation with this in mind. The aim of these models is ambitious – to follow the entire star formation and merger history of a galaxy, from the collapse of primordial density fluctuations to the present day. In such models, the ‘identity’ of a galaxy is not indelible – a luminous galaxy today could have been in several fragments at or it may have been in one, much smaller piece.
The power of the semi-analytic technique is illustrated by the example provided by Lyman break galaxies. We are able to take the same filters used by the observers and apply them to the galaxies in our model. Real galaxies and model galaxies are subject to the same selection criteria. A range of models recover the observed abundance of Lyman break galaxies, which is very sensitive to the choice of stellar IMF or to the normalisation of the density fluctuations. The models predict the size of the Lyman-break galaxy, the stellar mass, star formation rate and the mass of the host dark matter halo. The halo mass is relatively large compared to the rest of the dark matter halo population in place by this redshift – this led to the prediction that the Lyman break galaxies should be strongly clustered relative to the dark matter, which was confirmed by subsequent observations.
One of the themes running through this meeting was that the classical or monolithic picture and the ‘merger’ model of elliptical galaxy formation in clusters give essentially the same result – in both cases the stars that make up an elliptical galaxy are old; the main difference between the two models is the time when the stars are actually arranged into their final morphology. This represents a triumph for the hierarchical galaxy formation model. The classical model is designed to explain one observation – the small scatter in the colour-magnitude relation for cluster ellipticals. This is not a difficult result to achieve in isolation. The parameters in the semi-analytic model described here were set to reproduce as closely as possible the local field luminosity functions. The colour magnitude relation is simply one of the many outputs that come out of the model. This would seem to vindicate the physically motivated approach we have taken and suggests that many of the key ingredients of a successful theory of galaxy formation are in place, though the details still have to be worked out.
Acknowledgments.
CMB acknowledges financial assistance from the organisers to make attendance at this meeting possible.
References
Adelberger, K.A., etal. 1998, astro-ph/9804236
Aragón-Salamanca, A., Ellis, R.S., Couch, W.J., Smail, I., Sharples, R.M., 1996, MNRAS, 262, 764.
Baugh, C.M., 1996, MNRAS, 280, 267.
Baugh, C.M., Cole, S., Frenk, C.S., 1996a, MNRAS, 283, 1361
Baugh, C.M., Cole, S., Frenk, C.S., 1996b, MNRAS, 282, L27
Baugh, C.M., Cole, S., Frenk, C.S., Lacey, C.G., 1998a, ApJ, 498, 504.
Baugh, C.M., Benson, A.J., Cole, S., Frenk, C.S., Lacey, C.G., 1998b, MNRAS, submitted
Binney, J.J., 1997, ApJ, 215, 483
Bond, J.R., Cole, S., Efstathiou, G., Kaiser, N., 1991, ApJ, 379, 440
Bower, R.G., 1991, MNRAS, 248, 332
Bower, R.G., Lucey, J.R., Ellis, R.S., 1992, MNRAS, 254, 589.
Bruzual, G., Charlot, S., 1993, ApJ, 405, 538
Bruzual, G., Charlot, S., 1998, in preparation
Butcher, H.R., Oemler, A., 1984, ApJ, 285, 426.
Cole, S., 1991, ApJ, 367, 45
Cole, S., Kaiser, N., 1989, MNRAS, 237, 1127
Cole, S., Aragón-Salamanca, A., Frenk, C.S., Navarro, J.F., Zepf, S.E., 1994, MNRAS, 271, 781
Cole, S., Lacey, C.G., Baugh, C.M., Frenk, C.S., 1998, in preparation
Cowie, L.L., Songaila, A., Hu, E.M., Cohen, J.G., 1996, AJ,
Dressler, A., Oemler, A., Sparks, W.B., Lucas, R.A., 1994, ApJ, 435, L23
Driver, S.P., Windhorst, R.A., Griffiths, R.E., 1995, ApJ, 453, 48.
Eke, V.R., Cole, S., Frenk, C.S., 1996 MNRAS, 282, 263
Giavalisco, M., etal. 1998, astro-ph/9802318
Gladders, M.D., Lopez-Cruz, O., Yee, H.K.C., Kodama, T., 1998, ApJ, 501, 571.
Glanz, J., 1998, Science, 280, 1522
Glazebrook, K., Ellis, R., Santiago, B., Griffiths, R., 1995, MNRAS, 275, L19
Governato, F., Baugh, C.M., Frenk, C.S., Cole, S., Lacey, C.G., Quinn, T., Stadel, J., 1998, Nature, 392, 359.
Hogg, D.W., Cohen, J.G., Blandford, R., Pahre, M.A., 1998, ApJ, in press, astro-ph/9804129
Kauffmann, G., 1995, MNRAS, 274, 161
Kauffmann, G., 1996, MNRAS, 281, 487
Kauffmann, G., White, S.D.M., 1993, MNRAS, 261, 921
Kauffmann, G., White, S.D.M., Guiderdoni, B., 1993, MNRAS, 264, 201
Kauffmann, G., Guiderdoni, B., White, S.D.M., 1994, MNRAS, 267, 981
Kauffmann, G., Charlot, S., 1998, MNRAS, 294, 705
Kauffmann, G., Charlot, S., White, S.D.M., 1996 MNRAS, 283, L117
Kauffmann, G., Colberg, J.M., Diaferio, A., White, S.D.M., 1998, astro-ph/9805283
Kennicutt, R.C., 1983, ApJ, 272, 54
Lacey, C.G., Cole, S. 1994 MNRAS, 271, 676
Lacey, C.G., Guiderdoni, B., Rocca-Volmerange, B., Silk, J., 1993, ApJ, 402, 15
Larson, R.B., 1975, MNRAS, 173, 671
Lemson, G., Kauffmann, G., 1998, astro-ph/9710125
Lilly, S.J., LeFevre, O., Crampton, D., Hammer, F., tresse, L., 1995, ApJ, 455, 50.
Loveday, J., Efstathiou, G., Peterson, B.A., Maddox, S.J., 1992, ApJ, 400, L43
Madau, P., Ferguson, H.C, Dickinson, M., Giavalisco, M., Steidel, C.C., Fruchter, A., 1996, MNRAS, 283, 1388
Maddox, S.J., Efstathiou, G., Sutherland, W., 1996 MNRAS, 283, 1227
Mo, H.J., White, S.D.M., 1996, MNRAS, 282, 347
Moore, B., Governato, F., Quinn, T., Stadel, J., Lake, G., 1998a, ApJ, 499, L5
Moore, B., Lake, G., Katz, N., 1998b, ApJ, 495, 139
Press, W.H., Schechter, P.L., 1974, ApJ, 187, 425
Rees, M.J., Ostriker, J.P., 1997, MNRAS, 179, 541.
Rose, J.A., Tripicco, M.J., 1986, AJ, 92, 610
Saunders, W., etal. 1991, Nature, 349, 32
Schectman, S.A., etal. 1996, ApJ, 470, 172.
Silk, J., 1997, ApJ, 211, 638
Smoot, G., etal. 1992, ApJ, 396, L1
Somerville, R.S., Kolatt, T.S., 1998, astro-ph/9711080
Somerville, R.S., Primack, J.R., 1998, astro-ph/9802268
Steidel, C.C., Hamilton, D., 1992, AJ, 104, 941
Steidel, C.C., Adelberger, K.L., Dickinson, M., Pettini, M., Kellogg, M., 1998, ApJ, 492, 428.
Tully, R.B., Fisher, J.R., 1977, A&A, 54, 661
Tresse, M., Maddox, S.J., 1998, ApJ, 495,
Walker, I.R., Mihos, J.C., Hernquist, L., 1996, ApJ, 460, 121.
White, S.D.M., Efstathiou, G., Frenk, C.S., 1993, MNRAS, 262, 1023
White, S.D.M., Rees, M.J., 1978, MNRAS, 183, 341
White, S.D.M., Frenk C.S., 1991 ApJ, 379, 52.
Zepf, S.E., 1997, Nature 390, 377.