Accretion Disk Line Emission in AGN: A Devil’s Advocacy
Abstract
We review the evidence for AGN optical and X-ray broad line emission from an accretion disk. We argue that there is little, if any, statistical evidence to support this assertion. The inconsistency is strongest for the rare class of Balmer profiles that show double peaks. The line profiles predicted by a simple illuminated disk model are often incompatible with the observations. We suggest that the Fe K line in Seyfert 1 galaxies, where a broad line is most often and most strongly detected, is actually a composite of two lines both with Gaussian profiles; one narrow/unshifted and the other broad/redshifted.
1 Introduction
One can ask two questions about accretion disks in connection with active galactic nuclei (AGN). Do AGN host a supermassive black hole (BH) and associated accretion disk (AD)? Can we see line emission directly from the putative AD? The latter question has come to represent the best hope for obtaining a positive answer to the former one (a “proof” of the BH/AD paradigm) since the central broad line region (BLR) of AGN will remain unresolved even with space telescopes for the foreseeable future (for NGC 1068 at 12 Mpc, 1pc = 0.02 arcsec). Excellent theoretical arguments have been made both to show the necessity for a BH/AD and also to explain some serious observational problems (see, for example, Collin-Souffrin et al. 1990): (i) a medium for producing the optical FeII emission, (ii) a means of explaining the implied density and observed profile velocity differences between high (HIL: e.g., CIV 1549) and low (LIL: e.g., Balmer lines) ionization broad lines.
The hope of detecting accretion disk line emission received a boost when the double peaked H profile for Arp 102B was shown to be well fit by a relativistic Keplerian disk model (Chen & Halpern 1989; Chen, Halpern & Filippenko 1989). New encouragement came later from the detection of broad and redshifted Fe K line profiles with the ASCA satellite (e.g., Tanaka et al. 1995). Seyfert 1 galaxies, in particular, appear to show a broad and complex line near 6.4 keV which has been fit with a wide range of disk models (see, for example, Nandra et al. 1997a,b). In this case we are presumably seeing line emission from the innermost regions of the disk where relativistic effects are more pronounced. In § 2 we consider four categories of problems for optical emission from accretion disks. This is followed in § 3 by a discussion of problems with the interpretation of the X-ray line emission. In § 4 we describe the problems arising if both Fe K and Balmer lines are assumed to arise in a disk.
2 Double-Peaked Optical Lines: from AD?
2.1 Double-Peaked Profiles are Rare
Disk model fits to the Arp 102B Balmer lines were remarkably good and accounted for both the redshifted base of the profile and the brighter blue peak. A subsequent attempt to find more sources with profiles like Arp 102B however was disappointing. Only 12/94 sources studied in a (biased) sample of radio loud sources with peculiar profiles (like Arp 102B) could be satisfactorily fit with a disk model (Eracleous & Halpern 1994). This was especially disturbing because the disk inclination derived from the fit to Arp 102B implied an intermediate viewing angle where many sources should be found. More generally, double peaked profiles are found only among the radio-loud AGN which represent no more than 15% of all AGN (Kellermann et al. 1989). This implies that double peaked profiles are found in less than 1% of AGN which is consistent with the results of spectroscopic surveys. The rarity of sources similar to Arp 102B imply that double peaked sources are: (1) pathological, (2) miraculous or (3) orientationally constrained. There is no indication that the double-peaked sources differ significantly from other radio-loud AGN except in the shape of their line profiles (Eracleous & Halpern 1994). Explanation (2) requires either that most sources, where double peaked lines should be seen, have an additional source of line emission that fills in the gap between the peaks, or that most disks emit lines at much larger radii in the disk. The “additional source” possibility cannot provide a general solution because double-peaked profiles, with or without a filled in center, are broader than the majority of AGN. In either case then the detection of a few sources line Arp 102B becomes disturbingly miraculous. We prefer an explanation where double peak rarity is explained because they represent sources seen at near pole-on orientation. In that case the peaks might arise from opposite sides of a biconical outflow (Zheng et al. 1990, Sulentic et al. 1995a). While bicone models are not without difficulties (see, for example, Livio & Xu 1997), they provide the simplest explanation for the rarity of double-peaked profiles.
2.2 Double-peaked Profiles are not Strong Fe Emitters
Double-peaked sources appear to be exclusively radio-loud AGN while optical FeII emission is found to be, on average, stronger in the radio-quiet majority of AGN (Marziani et al. 1996). Examination of the H region in the spectra of sources like Arp 102B suggest a lower than (radio-loud) average Fe II optical strength. We estimate FeII optical/H for Arp 102B while we found a mean value near 0.8 for radio-loud sources in general (Marziani et al. 1996). Ironically, one of the original reasons for advocating disk emission was because it provided a suitable medium for FeII line production. There is also evidence that FeII optical and Balmer emission correlate in the sense that both H and the FeII lines broaden in the same way – suggesting that they might arise from the same emitting region (Phillips 1978; Boroson & Green 1992). If one argues that Balmer lines are produced in an accretion disk it would therefore be difficult not to expect significant FeII emission, especially, from double-peaked sources where it is argued that the Balmer lines arise in the disk.
2.3 The Peaks Vary Out of Phase
The red and blue peaks in the double-peaked sources vary out of phase (3C390.3: Gaskell 1988, Zheng, Veilleux & Grandi 1991, Arp 102B: Miller & Peterson 1990)). Pictor A (Sulentic et al. 1995a) originally showed single-peak Balmer profiles, but both red and blue peaks appeared independently over the past ten years. The double peaks appear to be transient in NGC 1097 (Storchi-Bergmann et al. 1997). Various, more complex, disk models (spotted, warped, elliptical disk/ring) have been advanced to account for the peak variability. We find the ring model (Storchi-Bergmann et al. 1997) particularly attractive, but not in support of disk emission. It would replace the disk with an emitting accretion ring that might remove a major problem for the bicone scenario (Livio & Xu 1997) involving the difficulty for observing emission from the far-side clouds.
2.4 Statistical Confrontations Between AD Models and Spectra
The first studies of line profile shifts and asymmetries (Gaskell 1982; Wilkes 1984) found evidence for a systematic blueshift of the HIL relative to the LIL. This difference was cited as an argument for a two component BLR where the LIL, with mean shift near zero (assumed to be the AGN rest frame) arose in a disk (Collin-Souffrin et al. 1980, 1982). Larger studies utilizing HST observations of HIL in the same sources where the LIL were measured (Sulentic et al. 1995b; Marziani et al. 1996) reveal that the HIL blueshift is present only in radio-quiet sources where double-peaked profiles have not been observed. The statistical results of such studies are generally bad for disk models. We earlier (Sulentic et al. 1990) made a general comparison between model predictions and observed Balmer line shift/asymmetry properties. The general trends predicted by disk models (blue shifted/asymmetric peaks and redshifted line profile bases are not observed. Figure 1 shows the half maximum line shift vs. width parameter space for both radio-loud and radio-quiet sources (Marziani et al. 1996) compared to the predictions of the disk model summarized in § 4.

The situation for disk emission is therefore bad in both observational and disk model parameter spaces. In the latter case, the scatter in disk model fits (inclination, inner emitting radius and emissivity power-law) show no convergence towards a single physical model (see, for example, Sulentic et al. 1998). The models that have the greatest potential to produce BLR emission in the bulk of (especially radio-quiet) quasars must move the emitting region of the disk to 104 rg ( = GM/c2, the gravitational radius of the central black hole). This has the unsatisfactory result of making the double-peak sources miraculous in a new way – the only sources where emission is primarily observed from the inner parts of the disk (i.e., a special emissivity law).
3 X-ray Lines from AD?
The ASCA mission has opened up a new spectroscopic window for the study of AGN. Emission at 6.4 keV was detected previously but without sufficient spectral resolution or S/N to characterize the line profile. MCG -06-30-15 has become almost a prototype for the characteristic line profile of the 6.4 keV feature in Seyfert 1 galaxies. The discussion now shifts from radio-loud to radio-quiet sources. The picture for X-ray line emission in the optical double-peakers is not yet clear. 3C390.3 has been detected (Eracleous et al. 1996) while Pictor A shows no detectable Fe line emission (Halpern et al. 1997).
Fe line emission at 6.4 keV is not really double peaked. It almost always shows a strong blue (high energy) peak near 6.4 keV and a very broad red wing extending down to 4-5 keV. This is generally consistent with disk models where the X-ray line arises in the innermost (R 20 rg) part of the AD. Line emission can arise at three different energies in this part of the spectrum: (i) at 6.4keV, from fluorescence reflection by “cold” Fe; (ii) in the range 6.45-6.7 keV, from highly ionized Fe or (iii) at 6.97 keV, from H-like Fe. The general consensus that cold Fe dominates the emission is supported by the frequent detection of an expected reflection component in the continuum. In the following subsections we consider the problems with a disk interpretation for the 6.4 keV line.
3.1 A Two Component Profile For the 6.4 keV Line?
Nandra et al. (1997a,b) recently reported a study of 16 of the (mostly Seyfert 1) sources with a strong 6.4 keV line. They generated an average profile from this data both with and without MCG -06-30-15 and NGC 4151. Both average profiles show a 6.4 keV narrow component and a broader redshifted feature. The redshifted feature is better defined in the average profiles and looks Gaussian in shape. In the presence of a complex line one can: (1) look for an obvious deconvolution into symmetrical components before (2) try to fit it with a more complex model based upon a popular but unproven hypothesis. This approach suggests that the 6.4 keV line may be a composite of two independent (roughly symmetric and Gaussian) features: (1) a narrow (FWHM = 0.24 keV) unshifted (En = 6.40.05 keV) line and (2) a broad (FWHM = 1.6 keV) redshifted (En = 5.90.1 keV) line. We recently showed (Sulentic, Marziani & Calvani 1998) that the of our own model fit to the low stage was no better than that obtained from a Gaussian fit with En=5.2 keV and = 0.75 keV. If the Gaussian interpretation is correct then it immediately invalidates all published disk model fits.
An important justification for adopting this deconvolution involves the blue side of the Fe profile. Most disk models explored so far show a sharp decrease in intensity on that side of the line due to Doppler boosting. As the data has improved, the observations have shown a softening of this wing. The excess blue wing flux is well seen in MCG -05-23-16 (Weaver et al. 1997) and, most significantly, in the average spectra of Nandra et al. (1997a,b). While we cannot rule out a contribution from “hot” Fe in this high energy wing, it appears to form a smooth extension, under the 6.4 keV narrow peak, of the broad redshifted component of the line. We have recently discussed possible origins (and references) for the Fe emission viewed as two independent lines (Sulentic et al. 1998; Sulentic, Marziani & Calvani 1998). No obvious disk model can account for the Gaussian components interpreted as independent lines unless the X-ray emission arises at the outer edge of the disk (104–105 rg).
3.2 Variability in MCG -06-30-15: More Trouble for AD
The extensive observations of the Seyfert 1 source MCG -06-30-15 reveal considerable variability in the 6.4 keV line. High, medium and low variability line profiles have been derived (Iwasawa et al. 1996b). The medium stage of variability resembles the typical Fe profile characterized by the average Fe spectrum (Nandra et al. 1997a,b). During the low phase the narrow 6.4 keV peak appears to disappear completely while at high phase the broad red component either remains constant or decreases in equivalent width. This is consistent with the above suggestion that the broad and narrow components of the line are independent. The situation may be more complex, especially if one removes the X-ray data associated with the most extreme variability, but there are scarcely enough photons to allow a clear interpretation beyond what is summarized here.
We attempted (Sulentic, Marziani & Calvani 1998) to find an illuminated AD model (details in final section) that could reproduce all three stages of the Fe profile variability in MCG -06-30-15. We obtained physically consistent fits by varying the index of the power law emissivity between 0.7 (high phase) and 3.0 (low phase). Actually the fit to the high phase profile was too high. This reflects the fact that we could only obtain self consistent fits to all phases by requiring that the broad redshifted component remains constant. Iwasawa et al. (1996b) present evidence for almost an order of magnitude change in the broad component EW between high and low phase. In any case the fit requires a nearly maximally rotating BH which is not otherwise physically justified.
3.3 Why is the Peak always at 6.4 keV?
The position of the Doppler boosted peak in disk models will change with the inclination of the AD to our line of sight. In a unification model we therefore expect to see the peak move to higher energy as the disk is viewed at higher inclinations. The data for “AD-like” profiles currently shows a strong concentration of narrow blue peaks at 6.4 keV. In the Nandra et al. (1997a,b) sample no source shows a peak higher than 6.45 keV. Admittedly the statistics are still poor, but the wavelength (energy) “stability” of the blue peak is more consistent with the interpretation that it is an independent line than with the predictions of disk models.
3.4 Recent Results for Seyfert 2 Sources
In a “unification” picture, the Seyfert 2 galaxies are Seyfert 1’s with near edge-on inclination where the BLR is hidden by an obscuring torus. Such a scenario can be coupled with the assumption that the Fe line arises from a disk. If the obscuring torus is optically thick at 6.4 keV then we would expect to detect little or no line emission. With the exception of IRAS 1832-5926 (Iwasawa et al. 1996a) and MCG -05-23-16 (Weaver et al. 1997), initial results suggested that Seyfert 2 emission was confined to a narrow feature at 6.4 keV. This already presented a challenge for disk models because the AD fits to Sy1 profiles left little residual flux in the peak for attribution to a second source that would be common to both Seyfert classes (analogous to the narrow emission lines). The most likely source of the non-AD Seyfert component would have been the obscuring torus which might contribute significant cold Fe. The variability results for MCG -06-30-15 however suggest that the blue peak responds almost instantaneously to continuum changes. This is inconsistent with Fe emission from a torus believed to lie up to a parsec from the central engine.
A further challenge to disk models has emerged from a study of the Fe line profiles for 25 Sy 2 galaxies (Turner et al. 1998). The average Sy 2 profile appears to show the same shape (although sometimes much less flux) as the average Sy 1 which is at variance with unification predictions. Two of us have argued that many or most Seyfert 2 galaxies are not edge-on Seyfert 1’s on independent grounds (see Dultzin-Hacyan et al. 1998). This result amplifies the problem for AD that was raised in the previous section. It is independent of the role of absorption in reconciling the observed profile similarities. The narrow peak centroid is the most robust measure of the line profiles and it again shows a strong clustering at 6.4 keV. Figure 2 compares model predictions (solid circles, for different values of inclination and and of power-law emissivity index ) with the observed Fe narrow peak energy and full profile FWHM for Seyfert 1 (open circles; Nandra et al. 1997a,b) sources and Seyfert 2 group averages (see Turner et al. 1998).

The concentration of narrow peak centroids at 6.4 keV represent a strong challenge to an AD origin for the line emission.
4 An Attempt at “Unification” of Optical and X-ray Line Emission
The parallel arguments for AD line emission from the Balmer and X-ray Fe lines suggest that it would be useful to explore illumination models that might simultaneously produce both lines. One of the biggest criticisms that can be leveled against model fits to optical and X-ray line profiles is the lack of convergence of the solutions in the parameter space. In most cases each line profile is fit without constraint on any of the principal disk parameters. If these fail to provide an adequate solution then various “epicyclic” modifications of the disk are employed. The disk model parameter space is effectively three dimensional since, disk inclination, inner emitting radius and index of the emissivity law govern the profile shape. We recently reported an attempt at developing a simple disk illumination model that would produce both Balmer lines and the 6.4 keV feature (Sulentic et al. 1998).
4.1 The Illuminated Disk Model
We tried to make the fewest possible assumptions in developing this model so we started with a standard geometrically thin disk with corrective terms given by Novikov & Thorne (1973) for a Kerr BH with angular momentum per unit mass a= 0.998. This is probably reasonable for a Seyfert 1 source like MCG -06-30-15 where the Eddington ratio is Lbol/LEdd 0.34. A BH mass M107M⊙ and 21023g s-1 was adopted. We assumed that the disk is illuminated by radiation produced at the center and scattered both by a sphere with radius 100 rg and by a spherical halo of free electrons with radius 106rg, both with electron-scattering optical depth . We chose two extreme models for the continuum shape that should represent over- and underestimates of the real continuum. The flux scale was provided by observations of MCG -06-30-15. The radial disk structure appropriate for a Kerr metric was employed with a = 0.998 GM/c (Thorne 1974). The CLOUDY photoionization code (Ferland 1996) was used. The cold Fe K line profile was computed following Fanton et al. (1997) which incorporates all relevant relativistic effects for a Kerr metric.
4.2 Results of the Disk Model
We derived line emissivity as a function of disk radius for both Fe K and H using CLOUDY. The bulk of the cold Fe emission originated between 1.25 and 20 rg, with the total contribution of hot to cold Fe 0.3, while H peaks at 103–104 rg. These predictions are generally consistent with many previous model fits to the Fe line. They also suggest that AGN should strongly favor symmetric single-peaked Balmer line profiles. The double peaked profiles are again found to have a “miraculous” character even if the broad line emission from most sources is dominated by disk emission. They are miraculous in the sense that they would represent a very rare population of AGN with H emission originating from radii an order of magnitude closer to the center than expected (e.g., 350 – 1000rg for Arp 102B; Eracleous & Halpern 1994). The latter limit on the outer emitting radius is also completely ad hoc since there is no physical reason to truncate the optical line emission so close to the center.
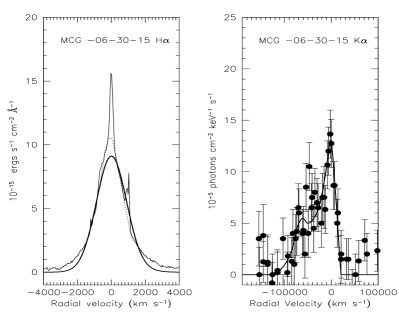
We obtained optical H spectra for 15 of the sources that show broad Fe K emission (Sulentic et al. 1998). This enables us to compare our model predictions about the line profiles of both Fe K and H. In addition we can use the line profiles to derive the disk inclination which is the single free parameter in the models. We discussed earlier the model profiles for MCG -06-30-15 in three stages of variability. Predicted profiles for Fe are generally in better agreement than those for H. This may be more the result of the poor S/N of the Fe spectra than anything else. The agreement between optical profiles and model predictions is poor. The fit is particularly bad in the wings where the disk emission might be expected to dominate. In addition the observed Balmer line shifts and asymmetries are not predicted by the model (see Calvani et al. 1997 for a possible solution). Another problem involves the inconsistencies between disk inclinations derived from optical and X-ray spectra for the same source. MCG -06-30-15 shows a very narrow H profile that constrains it to a small inclination angle while Fe K is constrained to a value near 30∘. Figure 3 shows the observed optical and X-ray line profiles with our best model fits superposed.
Few sources show agreement in the derived inclinations but, of course, many X-ray derived inclinations are poorly constrained.
We conclude that, aside from some individual fits to a few unusual sources, there is no compelling observation evidence for line emission from the putative accretion disk in AGN.
References
- [1]
- [2] oroson, T. A., & Green, R. F. 1992, ApJS, 80, 109
- [3] alvani, M., Marziani, P., & Sulentic, J. W. 1997, Mem. SAI, 68, 93
- [4] hen, K., & Halpern, J. P. 1989, ApJ, 344, 115
- [5] hen, K, Halpern, J. P., & Filippenko, A. V. 1989, ApJ, 339, 742
- [6] ollin-Souffrin, S., et al. 1980, A&A, 83, 190
- [7] ollin-Souffrin, S., Dumont, S., & Tully, J. 1982, A&A, 106, 362
- [8] ollin-Souffrin, S., & Dumont, A.-M. 1990, A&A, 229, 292
- [9] ultzin-Hacyan, D, Krongold, Y., Fuentes-Guridi, I., & Marziani, P. 1988 in Structure and Kinematics of Quasar Broad Line Regions, ed. C. M. Gaskell, W. N. Brandt, D. Dultzin-Hacyan, M. Dietrich, & M. Eracleous (San Francisco: Astronomical Society of the Pacific), 000
- [10] racleous, M., & Halpern, J. P. 1994, ApJS, 90, 1
- [11] racleous, M., Halpern, J. P., & Livio, M. 1996, 459, 89
- [12] anton, C., Calvani, M., de Felice, F., Cadez, A. 1997, PASJ, 49, 159
- [13] askell, C. M. 1982, ApJ, 263, 79
- [14] askell, C. M. 1988, in Active Galactic Nuclei, ed. H. R. Miller & P. J. Wiita (Berlin: Springer), 61
- [15] alpern, J. P., et al. 1997, unpublished talk: ASCA Cherry Blossom Conference
- [16] wasawa, K., Fabian, A. C., Mushotzky, R. F., Brandt, W. N., Awaki, H., Kunieda, H. 1996a, MNRAS, 279, 837
- [17] wasawa, K., et al. 1996b, MNRAS, 282, 1038
- [18] ellermann, K. I., Sramek, R., Schmidt, M., Shaffer, D. B., Green, R. 1989, AJ, 98, 1195
- [19] ivio, M., & Xu, C. 1997, ApJ, 478, L63
- [20] arziani, P., Sulentic, J. W., Dultzin-Hacyan, D., Calvani, M., Moles, M. 1996, ApJS, 104, 37
- [21] iller, J. S., & Peterson, B. M. 1990, ApJ, 361, 98
- [22] andra, K., George, I. M., Mushotzky, R. F., Turner, T. J., Yaqoob, T. 1997a, ApJ, 476, 70
- [23] andra, K., Nandra, K., George, I. M., Mushotzky, R. F., Turner, T. J., Yaqoob, T. 1997b, ApJ, 477, 602
- [24] ovikov, I. D., & Thorne, K. S. 1973, in Black Holes, eds. B. De Witt & C. De Witt, (New York: Gordon & Breach)
- [25] hillips, M., 1978, ApJS, 38, 187
- [26] torchi-Bergmann, T., Eracleous, M., Ruiz, M. T., Livio, M., Wilson, A. S., Filippenko, A. V. 1997, ApJ, 489, 87
- [27] ulentic, J. W., Zheng, W., Calvani, M., Marziani, P. 1990, ApJ, 355, L15
- [28] ulentic, J. W., Marziani, P., Zwitter, T., & Calvani, M. 1995a, ApJ, 438, L1
- [29] ulentic, J. W., Marziani, P., Dultzin-Hacyan, D., Calvani, M., Moles, M. 1995b, ApJ, 445, L85
- [30] ulentic, J. W., Marziani, P., & Calvani, M. 1998, ApJ, 497, L65
- [31] ulentic, J. W., Marziani, P. Zwitter, T. Calvani, M., & Dultzin-Hacyan, D. 1998, ApJ, 501, 54
- [32] anaka, Y., et al. 1995, Nature, 375, 659
- [33] horne, K. 1974, ApJ, 191, 507
- [34] urner, J., George, I. M., Nandra, K., Mushotzky, R. F. 1998, ApJ, 493, 91
- [35] eaver, K. A., Yaqoob, T., Mushotzky, R. F., Nousek, J., Hayashi, I., Koyama, K. 1997, ApJ, 474, 675
- [36] ilkes, B. 1984, MNRAS, 207, 73
- [37] heng, W., Binette, L., & Sulentic, J. W. 1990, ApJ, 365, 115
- [38] heng, W., Veilleux, S., & Grandi, S. A. 1991, ApJ, 418, 196