New H I-detected Galaxies in the Zone of Avoidance
Abstract
We present the first results of a blind H I survey for galaxies in the southern Zone of Avoidance with a multibeam receiver on the Parkes telescope. This survey is eventually expected to catalog several thousand galaxies within Galactic latitude , mostly unrecognised before due to Galactic extinction and confusion. We present here results of the first three detections to have been imaged with the Australia Telescope Compact Array (ATCA). The galaxies all lie near Galactic longitude 325° and were selected because of their large angular sizes, up to 13. Linear sizes range from 53 to 108 kpc. The first galaxy is a massive disk galaxy with a faint optical counterpart, SGC 1511.1–5249. The second is probably an interacting group of galaxies straddling the Galactic equator. No optical identification is possible. The third object appears to be an interacting pair of low column density galaxies, possibly belonging to an extended Circinus or Centaurus A galaxy group. No optical counterpart has been seen despite the predicted extinction ( – mag) not being excessive. We discuss the implications of the results, in particular the low H I column densities () found for two of the three galaxies.
1 INTRODUCTION
Within a Galactic latitude of , extinction and foreground confusion can considerably affect the quality of optical studies of galaxies. Within , most optical observations are challenging, and observations at infrared wavelengths become competitive with optical observations for the purposes of galaxy identification (e.g. Saunders et al. 1994). Within of the Plane, even infrared observations are impossible for most extragalactic studies. However, in this latitude range, H I observations at 21 cm wavelength have been used with considerable success, since the Galactic neutral hydrogen has optical depth only over the narrow velocity range covered by its emission. Blind searches in the Galactic Plane, or Zone of Avoidance (ZOA), were pioneered by Kerr & Henning (1987) and a survey with the Dwingeloo 25 m telescope has been successful in discovering several new nearby galaxies, including Dwingeloo-1 (Kraan-Korteweg et al. 1994; Henning et al. 1998).
In the past, large-area blind H I surveys have had limited sensitivity because of the time it takes to scan significant areas of sky. However, the new Parkes 21 cm multibeam receiver with its array of 13 feed horns (Staveley-Smith et al. 1996) allows much more rapid mapping of the nearby Universe. We have begun a survey with this receiver for galaxies within of the southern Galactic Plane. This survey should eventually produce a list of several thousand new galaxies behind the Plane, and give us information about massive nearby galaxies such as Dwingeloo-1 (Kraan-Korteweg et al. 1994) and Circinus (Freeman et al. 1977) which may have been previously overlooked. It will also help fill in our knowledge of the structure of the Centaurus-Pavo and Abell 3627 superclusters (Fairall 1988, Kraan-Korteweg et al. 1996) and the Puppis and Vela regions (Kraan-Korteweg & Huchtmeier 1992, Lahav et al. 1993, Kraan-Korteweg & Woudt 1994, Yamada et al. 1994) as they disappear behind the Galaxy, as well as uncover unknown large-scale structure across or behind the Galactic Plane.
In this paper, we present results for three galaxies found during the course of the survey. These galaxies are selected from a preliminary list of galaxies found near longitude 325° (Juraszek et al. 1998). Each of the galaxies is resolved in the beam of the Parkes telescope, and thus must be fairly nearby. In § 2, we describe the Parkes survey observations for the three galaxies. In § 3, we present the more detailed ATCA observations and optical CCD observations. Finally, in § 4, we discuss the implications of the findings.
2 MULTIBEAM SURVEY OBSERVATIONS
The ZOA survey began at the Parkes telescope111The Parkes Telescope and the Australia Telescope are funded by the Commonwealth of Australia for operation as a National Facility managed by CSIRO. on 1997 March 22, and is expected to be completed by early 1999. The survey will map the southern ZOA between longitudes and , and between latitudes and . Data are taken by scanning the telescope in Galactic longitude. Each scan is of length 8° with the position angle of the multibeam receiver lying nominally at 15° from the Galactic equator. The final survey will be heavily oversampled in the spatial domain.
| Property | J | J | J |
|---|---|---|---|
| RA (J2000)† | |||
| DEC (J2000)† | |||
| Galactic longitude † | 32359 | 32407 | 32906 |
| Galactic latitude † | |||
| Heliocentric velocity, (km s-1) ∗ | 1452 | 1383 | 421 |
| Velocity width at 50% (km s-1) ∗ | 441 | 90 | 55 |
| Distance () (Mpc) | 17.0 | 16.0 | 3.7 |
| H I Diameter (kpc) † | 53 | 108 | 86 |
| Peak H I column density (atoms cm-2) ∗ | |||
| H I mass () ∗ | |||
| Inclination † | 62° | – | – |
| Position Angle † | 156° | – | – |
| Absorption, (dust) | 4.3 mag | 57 mag | 2.7 mag |
| Absorption, (gas) | 3.4 mag | 16 mag | 4.4 mag |
| Type | SBb? | Interacting? | Interacting LSB? |
The multibeam correlator has a bandwidth of 64 MHz and covers the frequency range 1362.5 to 1426.5 MHz. This corresponds to a velocity () range of approximately to km s-1. The channel spacing is 13 km s-1, but to suppress ringing caused by the strong narrow-band Galactic H I emission, the data shown here are Hanning smoothed to a resolution of 26 km s-1. The average FWHP beamwidth of the multibeam receiver is , though the gridding process increases this to . The average system temperature is 20 K. The data used here have an rms noise of about 15 mJy beam-1, corresponding to an H I column density of around atoms cm-2 in each 26 km s-1 resolution element. The data were calibrated and baseline-subtracted using a real-time system based on aips++ (Barnes et al. 1997). Cubes were also made using specially developed aips++ routines (Barnes 1997). Miriad, aips and aips++ were used for cube concatenation, Hanning smoothing and making moment maps. All spectral calibration and cube-forming routines use robust statistics. In combination with high oversampling of the sky, this allows enormous suppression of any non-continuous interference.
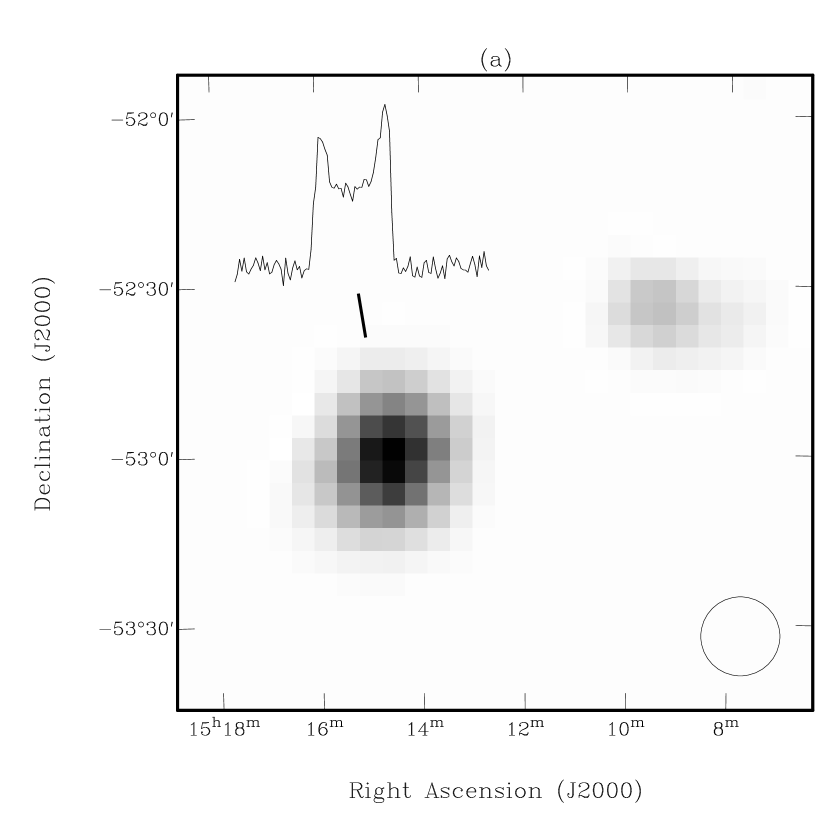
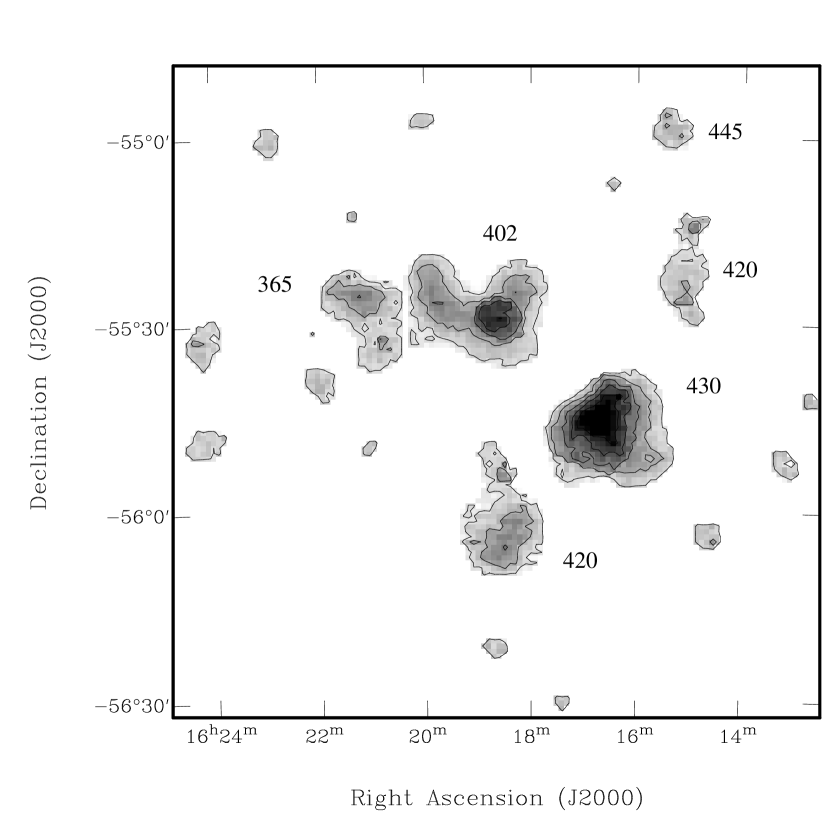
The galaxies chosen for follow-up observations are shown in Table 1 together with positions and other measured properties. The column-density images for J, J and J from the multibeam survey are shown in Figure 1. All the galaxies are near and are well-resolved, implying large overall sizes. Only J, at has a previously identified optical counterpart, SGC (Corwin et al. 1985). J is also notable for having a close companion, ESO 223–G 12, visible in the multibeam image (Figure 1). The companion has an almost identical velocity and velocity width to J. The H I masses of the three new galaxies range from (J) to (J) and peak column densities from (J) to (J) (at the multibeam resolution). The linewidths range from 55 km s-1 (J) to 441 km s-1 (J). The large H I mass and linewidth for J are typical of a massive spiral galaxy. The low H I mass and linewidth for J are typical of a low-mass dwarf system. However, the large linear size (86 kpc, see below) and low column density of J is not typical of an H I-rich dwarf galaxy, a point to which we return in § 4.
3 RADIO AND OPTICAL FOLLOW-UP OBSERVATIONS
| J | J | J | |
| Observation Date(s) | 97/06/08 | 97/06/08, 97/10/01 | 97/06/06, 97/07/16 |
| Array(s) | 750A | 750A, 375 | 750A, 122B |
| Integration time (h) | 4 | 4.5+9 | 13+12 |
| Bandwidth (MHz) | 8 | 8 | 8 |
| Number of pointings | 1 | 1 | 12 |
| Velocity resolution (km s-1) | 6.6 | 6.6 | 6.6/26.4 |
| Synthesised beamwidth | |||
| Position angle | 31° | 0° | 0° |
| Combined with multibeam data? |
High-resolution H I and optical CCD observations were made of the multibeam-detected galaxies. Table 2 lists the observing parameters for the ATCA H I observations. The CCD observations are discussed in the text.
3.1 J
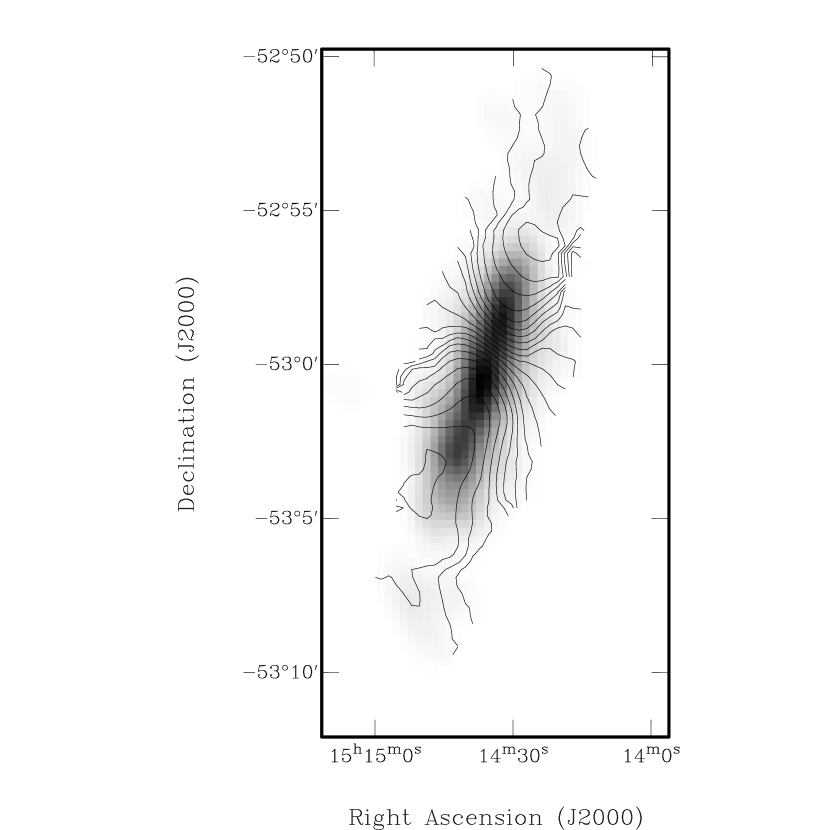
The ATCA column density image is shown in Figure 2. J is clearly resolved and is a highly inclined, rotating disk galaxy. The H I mass measured from the primary-beam-corrected ATCA column density image is M⊙. This is only 60% of the H I mass measured in the multibeam observations ( M⊙, Table 1). The difference is due to the lack of short spacings in the 750A array, and primary beam attenuation222The FWHP primary beamwidth of the ATCA at 21 cm is 34′. which forces the signal below the threshhold level for detection of significant H I. The diameter at a projected H I surface density of 1 M⊙ pc-2 ( cm-2) is 53 kpc (Table 1). However, the total H I extent is much larger. A tilted ring analysis (which gives the rotation curve shown in Figure 3) extends to a radius of 55 kpc. Given the relatively short observation and the fact that the ATCA primary beam correction is significant, the galaxy may extend considerably further still. The kinematically derived inclination is 62° and the pa is 156°. The dynamical center is given in Table 1, and is only 6″ from the precise optical position listed by Woudt & Kraan-Korteweg (1998).
An approximate decomposition of the rotation curve into an exponential disk, H I disk, and dark halo is reasonably successful (Figure 3). The portion of the rotation curve due to H I was fixed according to the measured ATCA H I density profile (corrected for primary beam attenuation) but normalised so that the H I mass agrees with the multibeam mass in Table 1. It is assumed that the H I lies in a flat, infinitely thin disk. A 30% (by mass) He contribution was also allowed for. The steep initial rise in the rotation curve was well-fitted by an infinitely thin exponential disk with a scale length of 8 kpc and central density 500 M⊙ pc-2 (and total mass M⊙). Finally, a pseudo-isothermal halo (e.g. Walsh et al. 1997) with a core radius of 30 kpc and central density of M⊙ pc-3 was required to fit the outer part of the rotation curve.
J is therefore a very massive system. The mass of the dark halo within a radius of 60 kpc is M⊙. The combined mass of the halo and both disk components is M⊙. The gentle decline of rotation velocity even at the largest radii suggests that the extent and total mass of the galaxy are significantly larger.

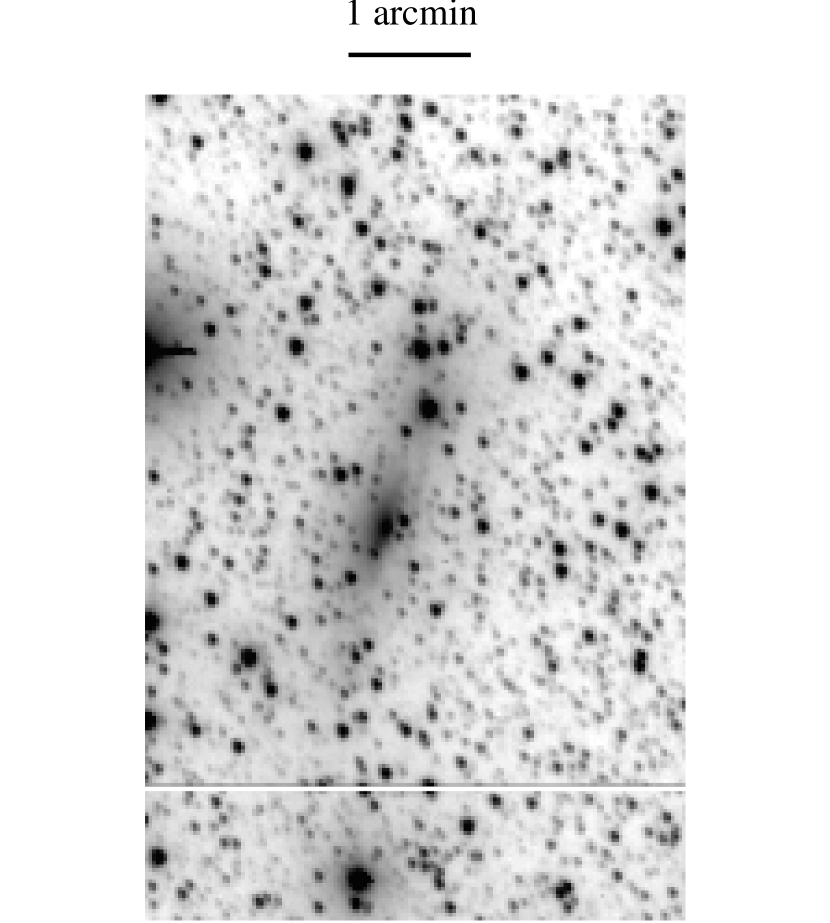
Optically, this galaxy is quite visible on sky-survey plates despite its Galactic latitude of 404. An -band image taken with the Mount Stromlo and Siding Spring Observatories (MSSSO) 40-inch telescope on 1997 July 4 is shown in Figure 4. The exposure time is 16 min, and the pixel size (after binning) is 18. The maximum optical diameter of J on Figure 4 is 220″ (17 kpc). Woudt & Kraan-Korteweg (1998) list this galaxy as WKK 4748 in their catalog and give a diameter of and a magnitude of mag. The Galactic column density of atoms cm-2 (Dickey & Lockman 1990) gives rise to an estimated absorption mag. More recent reddening estimates based on modelling of IRAS and DIRBE far-infrared data (Schlegel et al. 1998) suggests mag (Table 1) and therefore an absolute magnitude mag. The corresponding H I mass-to-light ratio is below the median value of 0.20 – 0.21 for the Sab/Sb samples listed by Roberts & Haynes (1994), but well within the range of these galaxies. The rotation curve analysis above also gives a reasonable value for the disk mass-to-light ratio .
With its optical size, J should have been be included in the Lauberts (1982) ESO catalog. However, it seems to have first been listed as a galaxy by Corwin et al. (1985) who catalog it as SCG 1511.1-5249. Improved coordinates are given by Spellman et al. (1989). It is a very strong infrared source (IRAS 15109-5248) with a m flux density of 60 Jy. Its far-infrared luminosity of lies in between two other moderately active galaxies: Circinus () and NGC 253 (). The far-infrared luminosity may be indicative of nuclear activity, possibly triggered by the nearby companion, ESO 223-G012, which also appears in Figure 1. J has also been listed as a galaxy candidate by Yamada et al (1993), Weinberger et al. (1995) and Takata et al. (1996).
3.2 J
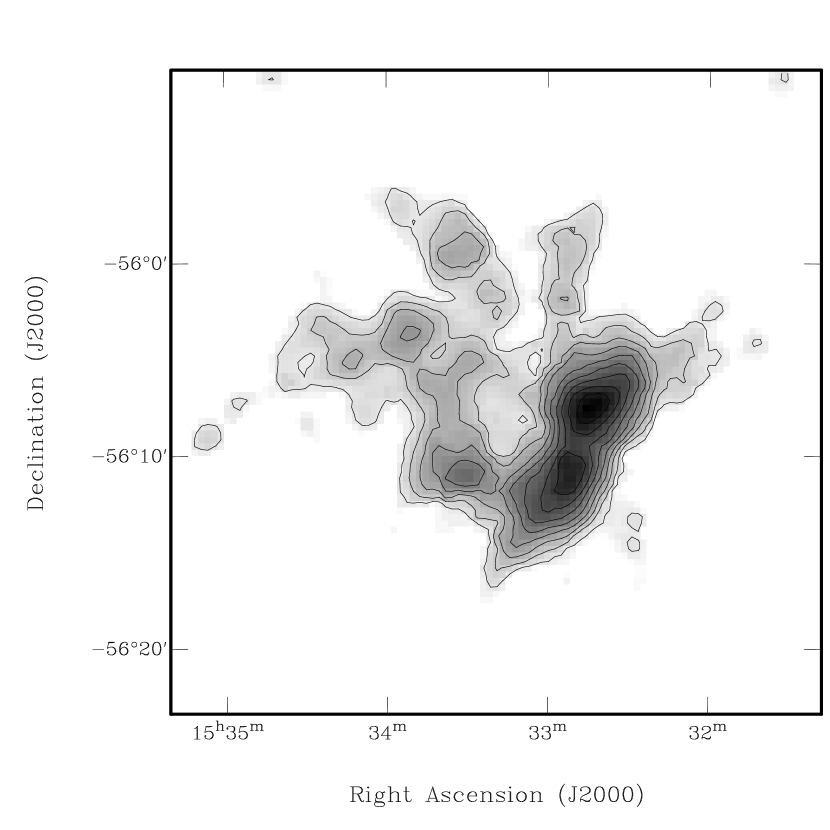
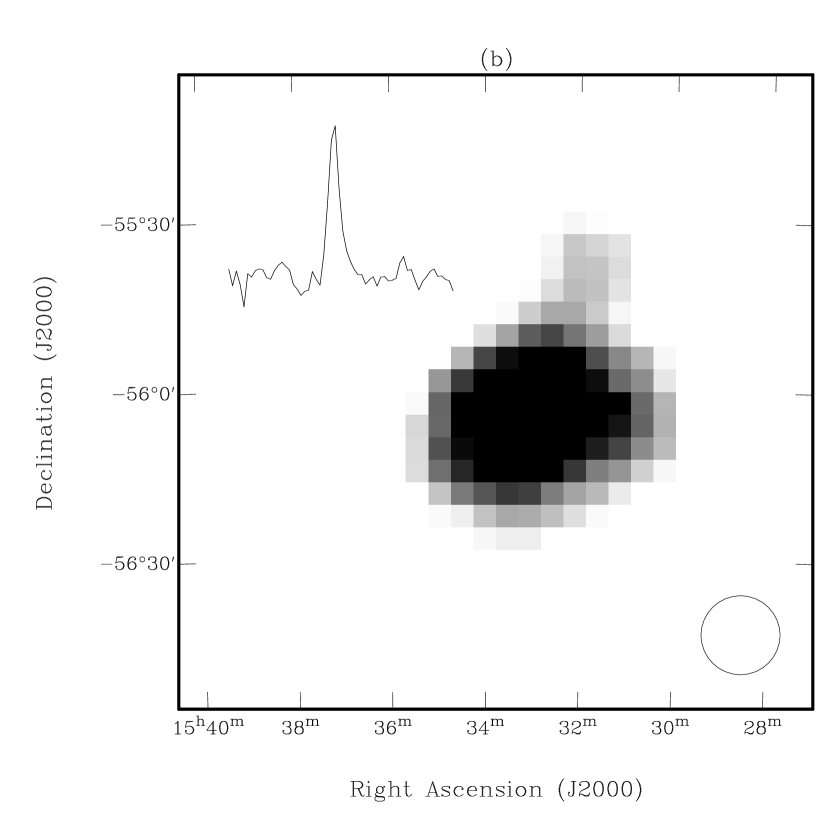
J required more ATCA integration time and a shorter array to detect (see Table 2). The column-density image is shown in Figure 5. In H I, J is resolved into a relatively bright region at RA , DEC (J2000) which is surrounded by a diffuse H I halo and a bright extension of length (28 kpc) at pa 150°. At the southern end of the extension, an arm-like feature twists back in a manner reminiscent of the tidal tails in the M81 group of galaxies (Yun et al. 1994). In the ATCA image, the overall system appears to have a diameter of 108 kpc at atoms cm-2, which is very similar to the 105 kpc diameter of the M81/M82/NGC3077 system as measured by the VLA (Yun et al. 1994). The extent of J is probably underestimated by the ATCA observations because of the primary beam cutoff. The multibeam data suggest a value as high as 200 kpc. The ATCA peak column density is atoms cm-2 and the average column density in the tail is atoms cm-2. Both these values are around two orders of magnitude smaller than for the M81 group, though some of this is may be due to the large resolution difference.
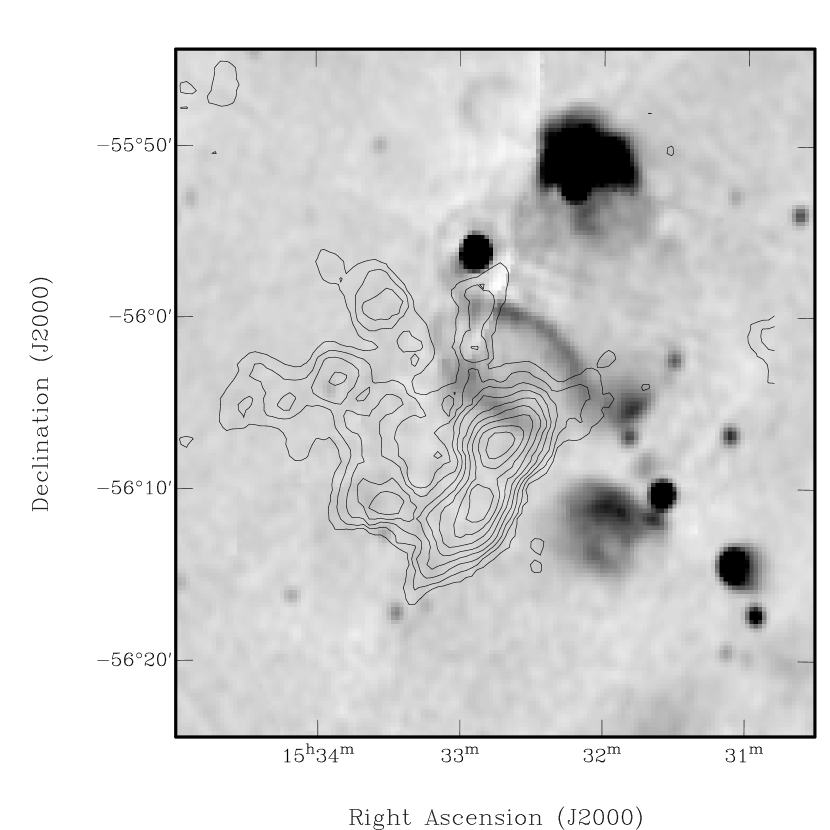
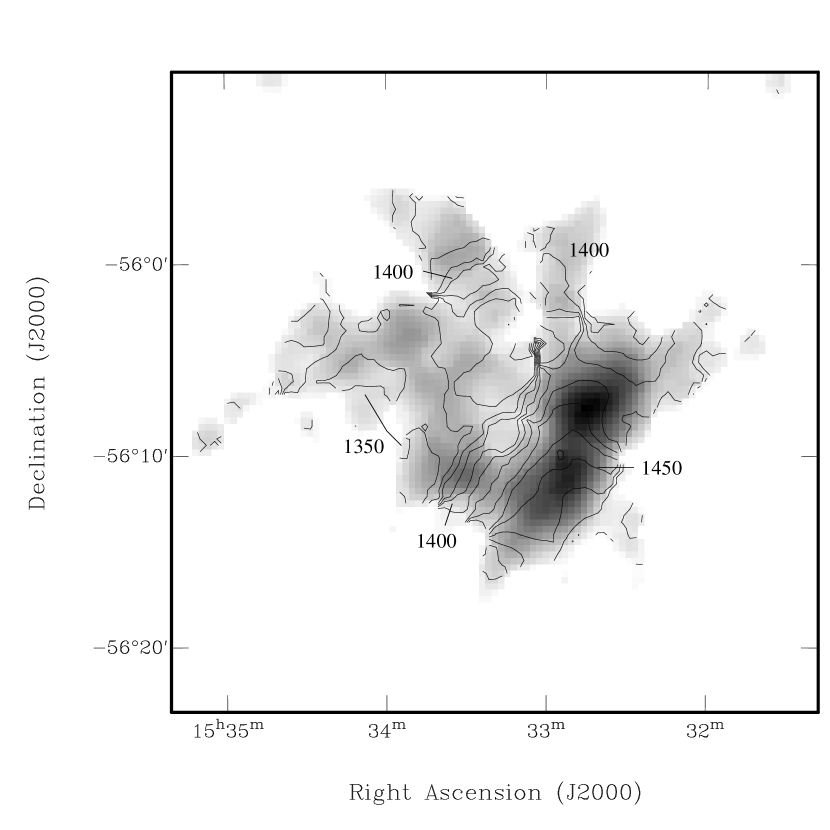
J lies at where the estimated absorption is – 57 mag (Table 1), thus making optical and IR detection unlikely. An 843 MHz radio continuum image from the Molonglo Observatory Synthesis Telescope (MOST, Green et al. 1998) in Figure 6 reveals a close proximity (separation 15′) to the extended H II region G324.147+0.231, and even closer to the compact H II region G324.192+0.109 (Caswell & Haynes 1987). This and the fact that the heliocentric velocity of 1380 km s-1 corresponds to a frequency (1413.9 MHz) which is reasonably close to the H263 recombination line rest frequency (1413.6 MHz) prompted us to check whether were being confused by Galactic emission. However, within the 64 MHz bandwidth of the multibeam data, we failed to find any other recombination lines. The absence of sufficient continuum emission at the position of J also makes this explanation untenable.
More interestingly, Figure 6 also shows J to be close to an elliptical ring listed as a Galactic supernova remnant (SNR) candidate by Whiteoak & Green (1996). However, we think it is unlikely that J is a high-velocity cloud (HVC) associated with an expanding SNR. The velocity of J in the Galactic rest frame is 1251 km s-1, which is well outside the range, km s-1, quoted by Stark et al. (1992) for Galactic HVCs. A search for molecular gas may help to evaluate this possibility.
3.3 J
This object required even an even longer integration and a more compact ATCA configuration to detect successfully with the ATCA. J is large, so a mosaic of 12 pointing positions each separated by 15′, was required.
This object was imaged by making a dirty mosaic cube and beam cube following the method of Sault et al. (1996). Natural weighting was used. The cube was then re-gridded to the velocity spacing of the multibeam data (which in turn was re-gridded to the pixel size of the ATCA data) and deconvolved using a maximum entropy task in miriad. The multibeam data were used as the ‘default image’, thereby constraining the final deconvolved image to be consistent with the ATCA data on small spatial scales, while being consistent with the multibeam data on large spatial scales. The resolution of the restored cube is 45. Column-density and velocity images were made by applying a flux cutoff of 7 mJy beam-1 to a smoothed version of the cube. The final column-density image is shown in Figure 7.
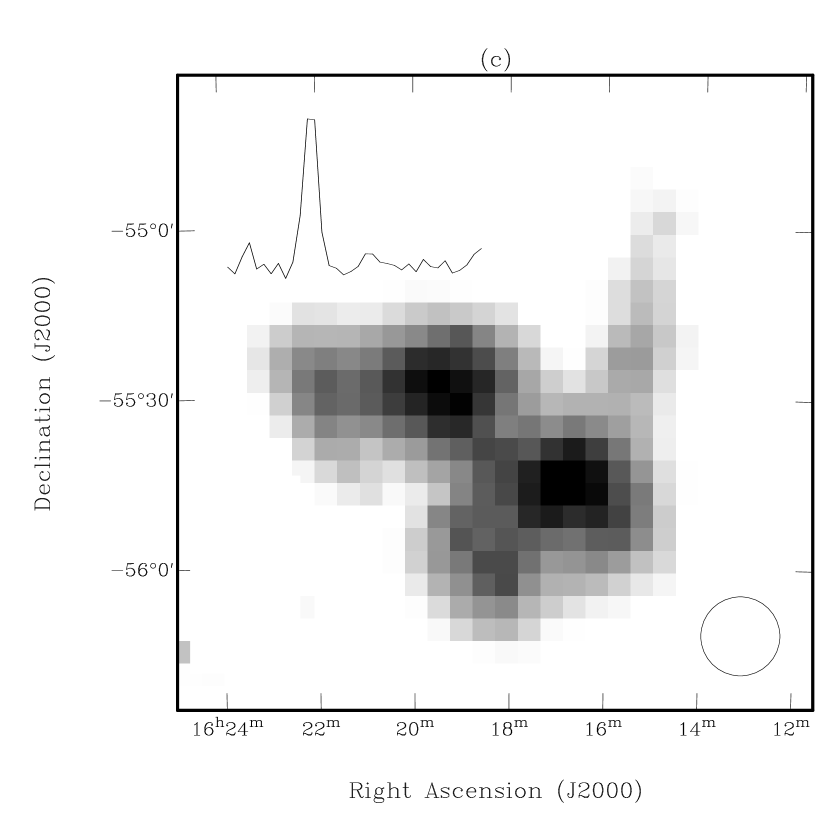
The ATCA observations show that the object appears to be resolved into two bright components, at least four fainter components and, most probably, a diffuse halo (Figure 7). The brightest component lies in the southwest at RA , DEC (J2000). A fainter ‘butterfly’ feature lies about 25′ to the northeast at RA , DEC (J2000). The velocities agree with the multibeam observations: 430 km s-1 in the southwest and 402 km s-1 in the northeast. Because of the increased resolution, the peak column density is higher in the ATCA image – about atoms cm-2.
The morphology of this system is unusual. It may be a single, very low column density galaxy where much of the disk has dropped below our detection level. However, we suspect that, like J, it is better explained by a tidal interaction between two smaller galaxies. The fainter outlying features in Figure 7 would then represent tidal debris. The combined H I mass of the whole system, if placed at 3.7 Mpc, is about a fifth of the mass of that of the Small Magellanic Cloud. The projected separation between the two main components is 27 kpc. The Galactic extinction in this region is between and 4.4 mag (Table 1). This is low enough for a bright spiral such as J to be seen, but could easily mask a lower surface brightness system. We have inspected Sky Survey plates of the region, and have taken MSSSO 40 inch CCD frames in , and H (exposure times 5 – 15 min) without obtaining an optical identification. Thus we propose that J is an interacting pair of binary LSB galaxies not unlike, though lower in mass than, the H I cloud discovered by Giovanelli & Haynes (1989).
The J system appears to have no immediate extragalactic neighbors. However, its heliocentric velocity (430 km s-1, Table 1) is almost identical to that of the Circinus galaxy (439 km s-1, Jones et al. 1998). Circinus lies at , about distant, or a distance of only 1.2 Mpc if both objects are 3.7 Mpc distant. Coincidentally, both galaxies lie at almost identical Galactic latitudes. It is therefore a possibility that that Circinus is not an isolated galaxy, but has the J system as a distant companion. In turn, both galaxies in turn lie at the southern extremity of the Centaurus A group which also has a mean distance of Mpc (Coté et al. 1997).
4 DISCUSSION
The present sample is too small to predict the nature of the galaxies that will be found in the Parkes multibeam surveys of the Galactic Plane and the southern sky. It may, however, be significant that tidal interactions are hypothesised for two of the three objects discussed in this paper. Such systems are clearly under-represented in optical surveys. The Magellanic Stream, for which no stars appear to be associated (Wayte 1991), and the relatively recent discovery of the extent of the tidal interaction in the M81 group (§ 3.2, Yun et al. 1994), are good examples. The discovery of significant numbers of such systems may put on a firmer footing the relationship between tidal interactions, mergers and nuclear activity in nearby galaxies.

The same two objects (J and J) are also significant in having low column densities – peaking at around cm-2 at the multibeam resolution of ( after gridding). This corresponds to M⊙ pc-2 projected H I column density, which is more than an order of magnitude below the star-formation threshold proposed by Kennicutt (1989). The properties of the new galaxies are compared in Figure 8 with the optically selected sample of ‘normal’ galaxies observed by Broeils & van Woerden (1994, hereafter BW) in a search for extended H I disks. The BW sample, which includes a wide range of morphological types, H I masses and luminosities, has a narrowly defined range of mean H I surface densities – around 3 M⊙ pc-2. J has an H I mass and an H I diameter (which has been measured at the same surface density of 1 M⊙ pc-2 – Table 1) close to the high end of the BW sample. It therefore has a similar mean (deprojected) surface density, M⊙ pc-2. In contrast, J and J have mean surface densities of 0.23 and 0.015 M⊙ pc-2, respectively. The diameters of these objects are hard to compare with their bright counterparts as their peak surface density does not exceed the 1 M⊙ pc-2 level. Similarly, the BW data is too insensitive to measure diameters at a fainter level (i.e. BW would not have been able to detect J and J with their observing parameters). Instead, we note that 1 M⊙ pc-2 is reasonably close to 10% of the peak surface density for galaxies in the BW sample, and use this criterion to define diameters for J and J. This level corresponds to contours at and M⊙ pc-2, respectively.
What is the reason for the low H I surface densities in J and J? Are these rare tidal systems? Or are these common objects, akin to the optical low surface brightness galaxy population (e.g. McGaugh 1996)? Morphologically, it appears that the systems chosen may have had a strong tidal influence. However, it should be noted that even the central H I surface densities are extremely low. For example, the peak (projected) surface density of J is a factor of 18 below the mean surface density ( M⊙ pc-2) of the BW sample. The answer to these questions awaits further multibeam observations. However, the resolution of the Parkes telescope (14′) is such that the numbers of low column-density galaxies which are close enough to be resolved may be small.
5 SUMMARY
Three large galaxies have been found in a blind multibeam H I survey of the southern Galactic Plane. These galaxies are the first of several thousand expected detections. One of them is a bright spiral (or would be except for the several magnitudes of optical extinction) and has been noted before by several authors. The remaining two are new discoveries for which we have been unable to find optical/IR counterparts, even with targeted observations. One of the new objects lies precisely on the Galactic equator.
High-resolution (ATCA) H I observations as well as optical CCD observations have helped to reveal the nature of the three galaxies:
-
1.
J (SGC 1511.1-5249 = WKK 4748) is an inclined () disk galaxy with a flat rotation curve which extends to a radius of almost 60 kpc. The H I mass is M⊙ and the total mass is M⊙. This galaxy appears to have a moderately active nucleus L⊙. This activity may be associated with having a nearby companion, ESO 223-G012.
-
2.
J appears as a very large (200 kpc) system in the multibeam images, although the ATCA diameter is 108 kpc. Its complex velocity field suggests the presence of more than one galaxy, a view which seems to be supported by the ATCA images which show the system to have morphological similarities with other tidally interacting systems such as the M81 group. The Galactic equator cuts through the middle of this system, thus demonstrating the effectiveness of the blind H I technique for finding galaxies even in the deepest obscuring layer of the Milky Way.
-
3.
J is the closest, lowest column density, and lowest mass of all the objects studied here. It appears to be a binary pair of LSB galaxies. A high (optical) surface brightness galaxy would probably have been seen at this position, where the predicted obscuration is to 4.4 mag (although predictions such as these, based on IRAS data and Galactic H I column densities, are extremely uncertain). This system is also interacting, and is possibly associated with the Circinus galaxy and/or the Centaurus A group.
We speculate that interacting and low-column-density galaxies may be found in significant numbers in blind H I surveys with the Parkes multibeam receiver and other systems.
References
- (1)
- (2) Barnes, D.G., 1997, ADASS VII, in press (San Francisco: ASP)
- (3) Barnes, D.G., Staveley-Smith, L., Ye, T., and Oosterloo, T. 1997, ADASS VII, in press (San Francisco: ASP)
- (4) Broeils, A.H., and van Woerden, H. 1994, A&A Suppl., 107, 129 (BW)
- (5) Caswell, J.L., and Haynes, R.F. 1987, A&A, 171, 261
- (6) Corwin, H.G., de Vaucouleurs, A., and de Vaucouleurs, G. 1985, Southern Galaxy Catalogue, The University of Texas Monographs in Astronomy no. 4 (Austin: Univ. of Texas)
- (7) Coté, S., Freeman, K.C., Carignan, C., and Quinn, P.J. 1997, AJ, 114, 1313
- (8) Dickey, J.M., and Lockman, F.J. 1990, ARA&A, 28, 215
- (9) Fairall, A.P. 1988, MNRAS, 230, 69
- (10) Freeman, K.C., Karlsson, B., Lynga, G., Burrell, J.F., van Woerden, H., and Goss, W.M. 1977, A&A, 55, 445
- (11) Giovanelli, R., and Haynes, M.P. 1989, ApJ, 346, L5
- (12) Green, A.J., Cram, L.E., Large, M.I., and Ye, T.-S. 1998, ApJ(submitted)
- (13) Henning, P.A., Kraan-Korteweg, R.C., Rivers, A.J., Loan, A.J., Lahav, O., and Burton, W.B. 1998, AJ, 115, 584
- (14) Jones, K.L., Koribalski, B.S., Elmouttie, M., and Haynes, R.F. 1998, MNRAS, (in press)
- (15) Juraszek, S. et al., (in preparation)
- (16) Kennicutt, R.C. 1989, ApJ, 344, 685
- (17) Kerr, F.J., and Henning, P.A. 1987, ApJ, 320, L99
- (18) Kraan-Korteweg, R.C., and Huchtmeier, W.K. 1992, A&A, 266, 150
- (19) Kraan-Korteweg, R.C., Loan, A.J., Burton, W.B., Lahav, O., Ferguson, H.C., Henning, P.A., and Lynden-Bell, D. 1994, Nature, 372, 77
- (20) Kraan-Korteweg, R.C., and Woudt, P. 1994, 9th IAP Astrophysics Meeting and 3rd Meeting of the EARA on ‘Cosmic Velocity Fields’, eds. F. Bouchet and M. Lachièze-Rey, (Gif-sur-Yvette: Editions Frontières), p.557
- (21) Kraan-Korteweg, R.C., Woudt, P.A., Cayatte, V., Fairall, A.P., Balkowski, C., and Henning, P.A. 1996, Nature, 379, 519
- (22) Lahav, O., Yamada, T., Scharf, C., and Kraan-Korteweg, R.C. 1993, MNRAS, 262, 711
- (23) Lauberts, A. 1982, The ESO/Uppsala Survey of the ESO(B) Atlas (Garching: ESO)
- (24) McGaugh, S.S. 1996, MNRAS, 280, 337
- (25) Roberts, M.S., and Haynes, M.P. 1994, ARA&A, 32, 115
- (26) Sault, R.J., Staveley-Smith, L., and Brouw, W.N. 1996, A&A Suppl., 120, 375
- (27) Saunders, W., et al. 1994, in Unveiling Large-Scale Structures behind the Milky Way, ASP Conf Ser. 67, eds Balkowski, C., and Kraan-Korteweg, R.C. (San Francisco: ASP), p.257
- (28) Schlegel, D.J., Finkbeiner, D.P., and Davis, M. 1998, ApJ500, 525
- (29) Spellman, K., Madore, B.F., and Helou, G. 1989, PASP, 101, 360
- (30) Stark, A.A., Gammie, C.F., Wilson, R.W., Bally, J., and Linke, R.A. 1992, ApJS, 79, 77
- (31) Staveley-Smith, L. et al. 1996, Publ. Astr. Soc. Australia, 13, 243
- (32) Takata, T., Yamada, T., and Saito, M. 1996, ApJ, 457, 693
- (33) Walsh, W., Staveley-Smith, L., and Oosterloo, T. 1997, AJ, 113, 1591
- (34) Wayte, S.R. 1991, in The Magellanic Clouds, IAU Symp 148, eds Haynes, R., and Milne, D. (Dordrecht: Kluwer), p.447
- (35) Weinberger, R., Saurer, W., and Seeberger, R. 1995, A&A Suppl., 110, 269
- (36) Whiteoak, J.B.Z., and Green, A.J. 1996, A&A Suppl., 118, 329
- (37) Woudt, P.A., and Kraan-Korteweg, R.C. 1998, (in preparation)
- (38) Yamada, T., Takata, T., Djamaluddin, T., Tomita, A., Aoki, K., Takeda, A., and Saito, M. 1993, ApJS, 89, 57
- (39) Yamada, T., Tomita, A., Saito, M., Chamaraux, P., and Kazes, I. 1994, MNRAS, 270, 93
- (40) Yun, M.S., Ho, P.T.P., and Lo, K.Y. 1994, Nature, 372, 530
- (41)