The Peak Brightness of SN1974G in NGC4414 and the Hubble Constant
Abstract
The light curve of the Type Ia supernova SN1974G (in NGC4414) is important because the Hubble Space Telescope has measured the distance to the host galaxy by means of Cepheid variables and thus the Hubble Constant can be derived. Light curves from the secondary literature are inadequate since the majority of data is misreported, the majority of the published data is overlooked, and the majority of all data is unpublished, while comparison star sequences have offsets of over half a magnitude. I have recovered and validated all data, remeasured the comparison stars, and performed light curve template fits. I find the observed peak B and V magnitudes to be and , with a decline rate of . For , the unabsorbed peak magnitudes are and . With the distance modulus to NGC4414 as , I find .
1 Introduction
Type Ia supernovae are perhaps the best standard candle (Branch & Tammann 1992 and references therein, Hamuy et al. 1996a) which can be used to measure the Hubble Constant (). However, to calibrate the peak absolute magnitude relation of Hamuy et al. (1996a), both distances and peak magnitudes of historical supernovae are needed. The Hubble Space Telescope has recently measured the distance to several host galaxies containing Type Ia events (Saha et al. 1994, 1995, 1996ab; Sandage et al. 1996). The key program on the distance scale has now observed NGC 4414, the host galaxy for SN1974G. Before this Cepheid distance can be of use, a reliable peak magnitude for the event must be known.
How can the light curve of SN1974G be improved at this late date? (1) I have made accurate measures of the brightnesses of the old comparison stars on the B and V magnitude systems, to allow modern reduction of the old observations. Indeed, I find errors of up to 0.72 mag in the old literature. (2) The majority of the observations are either unpublished in archives or recently published. Indeed, even the majority of old published observations have been overlooked in the modern secondary literature. (3) A variety of errors have appeared in the secondary literature, in particular, about half of the observations are assigned the wrong color including most of the pre-maximum and near-maximum data. (4) Modern template fitting techniques can significantly improve the derived peak magnitudes, provide quantitative measures of the uncertainties, and supply the needed decline rate.
This paper is the eighth in a series (Schaefer 1994, 1995abcd, 1996ab) where I provide modern peak brightnesses for Hubble Constant purposes.
2 Comparison Stars
SN1960F was discovered by W. Burgat (Burgat et al. 1974) on 1974 April 20, roughly a dozen days before maximum. The new star appeared in the outskirts of the Sc galaxy NGC 4414 at around thirteenth magnitude. Spectra revealed a normal Type Ia event with a peak around JD2442170 (Ciatti & Rosino 1977 [C&R], Patchett & Wood 1976 [P&W], and Iye et al. 1975). Many photometric observations are available; in Burgat et al. (1974), P&W, C&R, Howarth (1974), Burkholder (1995), and various IAU Circulars (numbers 2664, 2666, 2668, 2671, and 2678). In addition, the AAVSO data base has provided 164 V magnitudes.
Almost all the IAU Circular magnitudes are correctly reported in either Burgat et al. (1974), Howarth (1974, the BAA data), or in the AAVSO data. The observations reported in Burgat et al. (1974) use the AAVSO sequence (Scovil 1974), while most of the visual data are in the AAVSO archives (the few exceptions were added to the AAVSO data). The two visual estimates of Hopp (1974) could not be used since the sequence is not stated.
The comparison stars for all utilized observations were explicitly identified by the observer. A concordance of the various labels is presented in Table 1. Previous experience with photometric data from the 1970’s suggests that the comparison sequences are likely to have typical errors of a third of a magnitude (see also Figure 2 of Patat et al. 1997). Such problems would cause important systematic errors in a Hubble Constant determination for SN1974G. Fortunately, such errors can be corrected even today by measuring accurate comparison star magnitudes.
I have measured the Johnson B and V magnitudes for all comparison stars on four separate and independent nights. CCD images of the comparison stars were obtained with the 2.4 m Hiltner telescope on Kitt Peak (February 1998) and the 0.9 m telescope on Cerro Tololo (June 1995). All nights were definitely photometric. The calibration from standards (Landolt 1992) was carried out independently for each night, with standard star observations being made immediately before and after the SN1974G comparison star images. Standard stars were chosen to provide a wide range of colors, with B-V generally ranging from -0.2 to +1.4 mag. For the Kitt Peak observations, twelve standard stars were observed multiple times between air masses of 1.30 and 2.10. For the Cerro Tololo observations, the nightly number of standard star measures is 25 over air mass ranging from 1.16 to 2.41, with about half around an air mass of 2.0. Each comparison star was measured from three to eight times, with the usual rms scatter in these values of 0.01 to 0.02 mag.
The individual CCD images were bias subtracted and flattened (with sky flats) by the normal procedures. The APPHOT package in IRAF was used to perform aperture photometry on both standard and comparison stars. The FWHM of the seeing disk was 1.5” or better, so a photometry aperture of 10” diameter was chosen. All stars (other than one standard star which was excluded) had no significant contamination by stars or galaxies within this photometry aperture. For the standard stars, the measured instrumental magnitudes were fit to a linear transformation equation with terms for the air mass and for the B-V color. The fitted extinction coefficients agree well with previous measures for the sites both by myself and from the literature. The color terms were in all cases small, with coefficients less than 0.05. The rms scatter of the standard stars around the fitted transformation equation was typically from 0.01 to 0.02 mag. The night-to-night agreement was better than 0.01 mag in the B band, but was 0.02 mag in the V band. The statistical uncertainties associated with the individual measures of the standard and comparison stars were always less than 0.01 mag. For each image, the comparison star magnitudes were derived from the measured instrumental magnitude and that night’s fitted transformation equation. The true color of the comparison stars were found after one iteration with convergence of better than 0.01 mag. The final B and V magnitudes for each comparison star (see Table 1) are calculated as an average over all measures. The overall reliability of my comparison star magnitudes is likely mag.
With these accurate comparison star magnitudes, I have searched for systematic errors in the values adopted for each series of photometric measures of SN1974G. I find that in all cases there is a simple relation between the adopted magnitudes and my modern values:
| (1) |
| (2) |
| (3) |
| (4) |
| (5) |
| (6) |
The observed rms scatters are 0.07, 0.08, 0.07, 0.07, 0.18, and 0.06 mag. Color terms were sought in each case, but in no case was a significant color term found. Tsvetkov (1986) measured some comparison stars photographically, but he was 0.09 and 0.06 mag in error on average with rms scatters of 0.09 and 0.06 in B and V respectively.
Typical magnitude errors for the comparison stars from the literature are 0.2 mag, with up to 0.72 mag error. Equations 1-6 show that the deviations are complex, so any evaluation of the peak brightness of SN1974G based on uncorrected magnitudes will have comparable errors.
3 Light Curve
With accurate comparison star magnitudes, the original observations can be reduced to provide the brightness of the supernova on a modern magnitude scale. The details of this analysis will vary with the original observer’s procedure.
C&R report both B and V measures from the Asiago supernova survey. Patat et al. (1997) point out that the observations are close to the B and V magnitude systems. They also point out that the measurements of the supernova brightness were made by interpolating between the brightness of the next brighter and next fainter comparison stars. In practice, I correct for the changed comparison star magnitudes by constructing a plot of the versus for the comparison stars with line segments connecting successively fainter stars, and apply the interpolated correction appropriate for to the value. So for example, if C&R had said that SN1974G has B = 14.45 (i.e., halfway between their magnitudes for comparison stars F and G), then I would deduce that the actual magnitude was B = 14.48 (i.e., halfway between F and G). This procedure is identical with that recommended by Patat et al. (1997) in their equation 3.
The P&W magnitudes and comparison star sequence are both explicitly stated to be Johnson B. Their comparison star sequence was established with iris diaphragm photometry and a quadratic calibration curve (magnitude versus iris reading) was fitted from all comparison stars for each plate. The magnitude of the supernova was then determined from the iris reading for the supernova and the calibration curve. For errors in the comparison star magnitudes that follow equation 2, the calibration curve and the supernova magnitude can be corrected by an application of equation 2.
The AAVSO and BAA observations are from many visual observers. Multiple observations on the same night (or within a few days for late in the light curve) have been combined to form normal points. The visual estimates taken before the AAVSO sequence was established (1974 April 27) are not used because their comparison stars are unknown. Visual observers generally will interpolate the brightness between the next fainter and brighter comparison stars, so it is best to use a procedure similar to that used for the C&R analysis (i.e., like equation 3 of Patat et al. 1997). The visual observations have a color sensitivity very close to Johnson V (Schaefer 1996a).
The observations of Burgat et al. (1974) were on panchromatic film with the AAVSO visual sequence, and hence are closest to the V magnitude system. The color term for the panchromatic plates is unknown and could be very large (Schaefer 1996a). I will assume that the magnitudes were extracted from the plates by visual comparison with the next brighter and fainter stars, so I used the same analysis procedure as for the AAVSO data.
Burkholder (1995) reports microdensitometry of five plates, and she presents instrumental magnitudes for both comparison stars and the supernova in the photographic magnitude system. The relation is valid for stars and was used to convert the comparison star magnitudes to the photographic system. My reanalysis followed Burkholder’s Table 4, except with the substitution of these modern comparison star magnitudes. The resulting photographic magnitudes for the supernova were then converted to B magnitudes with the above relation (which is known to be valid for supernovae) for B-V colors iteratively determined from all SN1974G observations.
A concern with all supernova photometry is the contamination from the background galaxy light. Fortunately, SN1974G appeared on the outside edge of NGC4414 so the contamination is minimal. This can be explicitly seen for the plates of Burgat, P&W, C&R, and Howarth (see their Figure 1, Plate II, Figure 8, and Figure 2 respectively), in that the SN image is at a location of no significant recorded flux from NGC4414. To be quantitative, I have measured the surface brightness of NGC4414 at the location of the supernova, with surface brightnesses of and magnitudes per square arc-second. This is to be compared with typical dark zenith sky brightnesses of and magnitudes per square arc-second, or with sky brightnesses of and magnitudes per square arc-second on nights (JD around 2442171, 2442198, and 2442228) with the near full Moon away. Within the typical aperture for iris diaphragm photometry (close to the star size with radius of for the late-time plates of P&W and C&R; Schaefer 1982), the galaxy contributes only the brightness of a 18.6 and a 17.9 mag star (in B and in V). For iris diaphragm photometry, the measurement is essentially that of the image radius to some isophotal level, while this radius will increase slightly with light from the host galaxy. For the P&W images, the plate limiting magnitude () corresponds to a toe radius with an isophotal level of magnitudes per square arc-second, such that the galactic background changes the brightness at the toe by 0.008 magnitudes per square arcsecond, and hence an error in the deduced SN magnitude of 0.008 mag. In all cases, this added light is negligible even for late times in the light curve of SN1974G.
Following Schaefer (1994), I adopt a one-sigma uncertainty of 0.15 mag for magnitudes from photographs. However, the panchromatic photographs will be assigned an uncertainty of 0.5 mag to allow for the expected large and unknown color terms. Individual visual observations are assigned an uncertainty of 0.3 mag (0.6 mag if the magnitude is reported with a “:”), which is then reduced by the square root of the number of observations used to form the normal point.
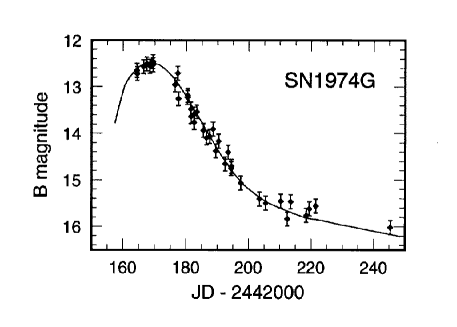
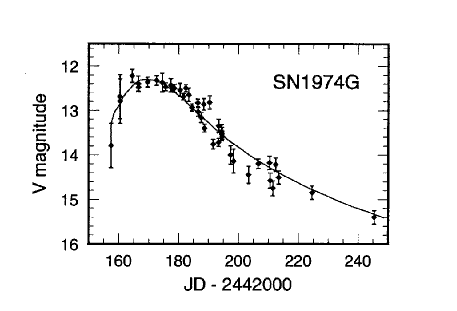
Tables 2 and 3 summarize the B and V light curves for SN1974G, while Figure 1 plots the light curves. The magnitudes from the AAVSO and the BAA are indicated in the ‘Source’ column of Table 3 by either an ‘A’ or a ‘B’ followed in parentheses by the number of contributing observations.
4 Peak Magnitude
This light curve can yield an accurate peak magnitude and decline rate by the normal template fitting techniques. I have used the six templates presented in Hamuy et al. (1996b). Specific procedures that I have used are described in Schaefer (1996b).
The best combined fit to all the B and V data yields a B peak on for the SN1992al template. The peak brightness is and . The decline rate has . The resultant reduced is 1.60 (37 B points and 51 V points), with all the excess above unity coming from four V brightnesses long after peak.
The robustness of this result can be tested by varying the choices used in the above analysis: (1) The B and V data can be fit separately. The best B fit is for the SN1992al template with a peak on at . The best V fit is for the SN1992al template with a peak on at . (2) The 21 B and 27 V data points within 20 days of peak can be fit. The best combined fit is for the SN1992al template with a peak on JD2442169.0 at and (with a reduced of 1.22). (3) The 11 B and 11 V observations of C&R can be fit by themselves. The best combined fit is for the SN1992al template (with a reduced of 0.82) for a peak on at and . (4) If equations 1-6 are used for all data sets, then the best combined fit is for the SN1992al template (with a reduced of 1.58) for a peak on at and . (5) A direct average of the 7 B and 5 V points within 4 days of peak, after corrections for the SN1992al template for a peak on JD2442168.5, is and . A separate linear fit to the B data between 10-20 days after peak gives a fitted magnitude at 15 days after peak of , for a value of equal to mag. The scatter of these five alternative fits is consistent with the quoted error bars for the preferred fit, so I will adopt the best fit from the previous paragraph (, , , and ).
The peak magnitudes should be corrected for the extinction. The extinction from our Milky Way should be near zero (Leibundgut et al. 1991). SN1974G appears far outside NGC4414, so the host galaxy extinction is expected to be small. The E(B-V) value can be quantitatively estimated by three means: (1) The various spectra show no indication of sodium absorption lines, with the most restrictive being the C&R spectra for which the equivalent width is less than roughly 0.25 . The correlation between theequivalent width and E(B-V) is loose (Ho & Filippenko 1995; Richmond et al. 1994; Barbon et al. 1990), but the C&R limit implies E(B-V) can plausibly be as high as mag. (2) The B-V color at peak is , which implies noticeable extinction. With the unreddened color at peak of (Schaefer 1995c), the value of E(B-V) is . (3) The third means of estimating the reddening is to use the result from Riess, Press, & Kirshner (1996) that all Type Ia events have the same intrinsic color at 45 days after peak, with . By fitting the SN1974G light curve from , I find , for a resulting . From these three methods, I conclude that .
For , I find and . Thus, my final peak brightnesses for SN1974G are and .
5 Hubble Constant
In the past several years, I have been calibrating the peak magnitudes of nearby Type Ia supernovae for which Cepheid distances have been measured with the Hubble Space Telescope. Just as with SN1974G, the old light curves often require significant improvements before they can be reasonably used for any analysis of the Hubble constant. It must be realized, that without these reliable light curves, the large number of orbits used by the Hubble Space Telescope have only poor utility for calibrating the supernovae.
Hamuy et al. (1996a) has resolved the debate over the dependence of Type Ia luminosity on the decline rate. Events with varying decline rate can be corrected to a standard decline rate with
| (7) |
Here, is the peak absolute magnitude corrected for reddening and decline rate, is the apparent peak magnitude, A is the extinction, is the distance modulus to the host galaxy, and is the decline rate as measured by the magnitudes below peak in the B filter the light curve is 15 days after peak. The parameter ‘b’ is the slope of the decline rate relation; in B and in V (Hamuy et al. 1996a). Hamuy et al. (1996c) presents a Hubble diagram for distant supernovae, from which they derive values for some assumed fiducial Hubble constant. They find (for ) that values are in the B and in the V.
SN1974G has values of in the B and in the V. When applied to the distant Hubble diagram, the derived Hubble Constant will be . This leads to values of and in B and V respectively. These two values are not independent since the B-V color was used to derive the reddening. So the conclusion is that SN1974G yeilds a calibration of the peak brightness for Type Ia supernovae that corresponds to a Hubble constant of .
I thank the many members of the American Association of Variable Star Observers, as well as Jonathan Kemp for help with the MDM observations.
References
- (1) Barbon, R., Benetti, S., Cappellaro, E., Rosino, L., & Turatto, M. 1990, A &A, 237, 79
- (2) Branch, D. & Tammann, G. A. 1992, ARA&A, 30, 359
- (3) Burgat, W., Wild, P., Heiser, E., & Locher, K. 1974, Orion, 32, 163
- (4) Burkholder, V. 1995, JAAVSO, 23, 127
- (5) Ciatti, F. & Rosino, L. 1977, A & A, 57, 73 (C & R)
- (6) Hamuy, M., Phillips, M., Schommer, R., Suntzeff, N., Maza, J., & Aviles, R. 1996a, AJ, 112, 2391
- (7) Hamuy, M. et al. 1996b, AJ, 112, 2438
- (8) Hamuy, M., Phillips, M. M., Suntzeff, N. B., Schommer, R. A., Maza, J., and Aviles, R. 1996c, AJ, 112, 2398
- (9) Ho, L. C., & Filippenko, A. V. 1995, ApJ, 444, 165
- (10) Hopp, U. 1974, IAU Circ., No. 2671
- (11) Howarth, I. D. 1974, Mitt. Verend. Sterne, 6, 155
- (12) Iye, M., Kodiara, H., Kikuchi, S., & Ohtani, H. 1975, PASJ, 27, 571
- (13) Landolt, A. 1992, AJ, 104, 340
- (14) Patat, F., Barbon, R., Cappellaro, E., & Turatto, M. 1997, A&A, 317, 423
- (15) Patchett, B. & Wood, R. 1976, MNRAS, 175, 595 (P&W)
- (16) Richmond, M. W. et al. 1994, AJ, 107, 1022
- (17) Saha, A. et al. 1994, ApJ, 425, 14
- (18) Saha, A. et al. 1995, ApJ, 438, 8
- (19) Saha, A. et al. 1996a, ApJ, 466, 55
- (20) Saha, A. et al. 1996b, ApJSupp, 107, 693
- (21) Sandage, A. et al. 1996, ApJ, 460, L15
- (22) Schaefer, B. E. 1982, AAS Photo-Bulletin, 29, 14
- (23) Schaefer, B. E. 1994, ApJ, 426, 493
- (24) Schaefer, B. E. 1995a, ApJ, 447, L13
- (25) Schaefer, B. E. 1995b, ApJ, 449, L9
- (26) Schaefer, B. E. 1995c, ApJ, 450, L5
- (27) Schaefer, B. E. 1995d, ApJ, 459, 438
- (28) Schaefer, B. E. 1996a, AJ, 111, 1668
- (29) Schaefer, B. E. 1996b, ApJ, 460, L19
- (30) Scovil, C. E. 1974, AAVSO Circ., No. 42
- (31) Tsvetkov, D. Yu. 1986, Variable Stars, 22, 279
- (32) Turner, A. et al. 1998, ApJ submitted
| P&W | C&R | BAA | AAVSO | B | V |
|---|---|---|---|---|---|
| 1 | 10.73 | 10.05 | |||
| 2 | 11.53 | 10.80 | |||
| 3 | 12.11 | 11.21 | |||
| 4 | C | 12.1 | 123 | 13.12 | 12.44 |
| 5 | 12.5 | 122 | 13.32 | 12.34 | |
| 6 | 13.7 | 138 | 14.50 | 13.93 | |
| 7 | I | 14.3 | 143 | 14.91 | 14.40 |
| 8 | 13.0 | 131 | 14.13 | 13.30 | |
| 9 | 15.35 | 14.56 | |||
| 11 | 15.85 | 15.17 | |||
| B | 12.59 | 11.48 | |||
| D | 13.65 | 12.65 | |||
| E | 13.70 | 12.98 | |||
| F | 14.35 | 13.59 | |||
| G | 14.61 | 13.99 | |||
| L | 14.8 | 148 | 15.90 | 14.89 | |
| N | 151 | 15.85 | 15.11 | ||
| P | 16.52 | 15.40 | |||
| 148 | 16.34 | 14.87 |
| JD- | JD- | ||||
|---|---|---|---|---|---|
| 2442000 | B | Source | 2442000 | B | Source |
| 164.44 | C&R | 187.58 | Burk | ||
| 164.50 | P&W | 188.61 | Burk | ||
| 166.50 | P&W | 189.50 | P&W | ||
| 167.50 | P&W | 190.38 | C&R | ||
| 168.50 | P&W | 192.50 | P&W | ||
| 169.50 | P&W | 193.44 | C&R | ||
| 169.50 | P&W | 194.40 | C&R | ||
| 176.50 | P&W | 194.52 | C&R | ||
| 177.36 | C&R | 197.50 | P&W | ||
| 177.58 | Burk | 203.50 | P&W | ||
| 180.45 | C&R | 205.50 | P&W | ||
| 180.50 | P&W | 210.37 | C&R | ||
| 181.50 | P&W | 212.39 | C&R | ||
| 181.58 | Burk | 213.50 | P&W | ||
| 182.50 | P&W | 218.50 | P&W | ||
| 182.57 | Burk | 219.50 | P&W | ||
| 183.43 | C&R | 221.50 | P&W | ||
| 185.50 | P&W | 245.38 | C&R | ||
| 186.50 | P&W |
| JD- | JD- | ||||
|---|---|---|---|---|---|
| 2442000 | V | Source | 2442000 | V | Source |
| 157.50 | Burgat | 188.70 | A(11) | ||
| 160.40 | Burgat | 190.39 | C&R | ||
| 160.50 | Burgat | 191.60 | A(7) | ||
| 164.46 | C&R | 193.40 | B(11) | ||
| 166.50 | B(3) | 193.46 | C&R | ||
| 166.60 | A(12) | 193.50 | Burgat | ||
| 169.60 | A(7) | 193.50 | Burgat | ||
| 172.60 | A(8) | 193.50 | Burgat | ||
| 174.50 | B(2) | 194.41 | C&R | ||
| 175.60 | A(11) | 194.53 | C&R | ||
| 177.38 | C&R | 194.60 | A(17) | ||
| 177.40 | Burgat | 197.40 | A(2) | ||
| 178.40 | B(5) | 198.40 | B(5) | ||
| 178.60 | A(12) | 203.40 | B(4) | ||
| 180.46 | C&R | 206.60 | A(7) | ||
| 181.60 | A(19) | 210.38 | C&R | ||
| 182.40 | B(14) | 210.60 | A(3) | ||
| 183.40 | Burgat | 211.50 | B(3) | ||
| 183.40 | Burgat | 212.41 | C&R | ||
| 183.42 | C&R | 213.40 | A(4) | ||
| 184.50 | A(13) | 214.50 | Burgat | ||
| 186.40 | Burgat | 217.60 | A(4) | ||
| 186.40 | B(10) | 218.40 | Burgat | ||
| 186.50 | A(9) | 224.60 | A(4) | ||
| 187.60 | A(8) | 245.41 | C&R | ||
| 188.40 | B(5) |