ULTRA-DEEP MID-IR SURVEY OF A LENSING CLUSTER
Abstract
We present the first results of mid-infrared (MIR) ultra-deep observations
towards the lensing cluster Abell 2390 using the ISOCAM infrared camera
on-board ESA’s Infrared Space Observatory (ISO) satellite.
They reveal a large number of luminous MIR sources.
Optical and near-infrared (NIR) cross-identification suggests that almost
all 15m sources and about half of the 7m are identified with
distant lensed galaxies.
Thanks to the gravitational amplification these sources constitute the
faintest MIR sources detected. We confirm that the number counts derived
at 15m show a clear excess of sources with respect to the predictions
of a no-evolution model.
The possible extension of the NGST instrumentation from the near-IR (1-5m)
to the thermal infrared, up to 20m
(as suggested by the NGST task group report, October 1997)
would permit study of this new population of dust-enshrouded
AGN/starburst galaxies detected by ISOCAM, up to very high redshifts and with
vastly improved spatial resolution. The existence of this population demonstrates
that the discrimination of dust contributions, possible in the MIR, must be an
important consideration in reaching an understanding of the Universe at high
redshift. Therefore we stress that the access of NGST to the thermal infrared
would increase tremendously its scientific potential to study the early
universe.
Key words: Gravitational lensing; Mid-infrared (MIR); Source counts.
1. INTRODUCTION
Great progress in the understanding of physical properties of galaxies has been achieved with MIR and Far-infrared (FIR) observations using the ISO satellite (Kessler et al. 1996) and especially with the ISOCAM camera (Cesarsky et al. 1996). 111Based on observations with ISO, an ESA project with instruments funded by ESA Member States (especially the PI countries: France, Germany, the Netherlands and the United Kingdom) with the participation of ISAS and NASA
Deep MIR cosmological surveys have been performed with ISOCAM on empty fields such as the Hubble Deep field (Rowan-Robinson et al. 1997, Aussel et al. 1998) and the Lockman Hole (Taniguchi et al. 1997).
In parallel the ISO programme [LMETCALF ARCS] invested about 30 hours of Science Operations Centre (SOC) Guaranteed Time (GT) aimed at searching for a background IR-luminous galaxy population with the aid of the gravitational amplification of known cluster lenses. That programme (Metcalfe et al. 1998, in preparation), yielded relatively deep ISOCAM images through a number of cluster lenses. Initial results for the cores of Abell 370 and Abell 2218 were reported in Metcalfe et al. (1997) and Altieri et al. (1997), respectively. The success of those observations, which unveiled the MIR emission of the gravitationally lensed arcs and other less distorted distant galaxies, led us to push ISOCAM to its ultimate limit. So we performed, in additional ESA SOC GT, very deep observations towards the core of one of the most studied and rich lensing clusters: Abell 2390 (z=0.23). These new observations are reported here and supersede both in area and deepness the previous ISOCAM observations of this cluster (Lémonon et al. 1998)
2. OBSERVATIONS
One full ISO revolution (16 hours) was allocated for this imaging programme in 2 colours using the broad, high-responsivity, filter bands around 7 and 15 . Observations were split and scheduled in 4 consecutive revolutions between December 26 and 29, 1997, to take advantage of the best observation window near apogee, where the glitch rate is at minimum. The key observational parameters were:
-
a high spatial resolution, with the 3′′ pixel-field-of-view (PFOV), combined with the ’microscanning’ mode to increase spatial resolution to the maximum (stepping by fractions of a physical pixel size)
-
a high redundancy (i.e. the number of different detector pixels seeing each sky pixel), up to 400, in the central part of the field, in order to get the best flat-fielding accuracy and glitch rejection (Altieri et al. 1998).
A small sky area of 7’2 was probed, and only the inner 5’2 had full sensitivity. Other ISOCAM deep cosmological surveys used the 6′′ PFOV: e.g. the Hubble Deep Field (Rowan-Robinson et al. 1998, Aussel et al. 1997, Aussel et al. 1998), the Lockman Hole (Taniguchi et al. 1998) and the Marano fields. These surveys have a poorer spatial resolution, and their absolute astrometry determination of MIR source positions was difficult because of the lack of obvious NIR/optical counterparts.
3. DATA REDUCTION & ANALYSIS
The data reduction was done partly with the the IDL based (ISO)CAM Interactive Analysis Analysis (CIA) package (Ott et al. 1997) and partly using the PRETI method (Elbaz, this conference, Starck et al. 1997), based on a Multiresolution Median Transform (MMT) analysis, of the pixel time histories, which offers the possibility to separate the different constituents of the signals, and to reject signal baseline drifts and glitch-induced responsive transients which can obscure weak sources.
The mosaicing was done using the (now classical) drizzling technique, for the best registration and coaddition of the images. The final pixel size is 1′′ , but the minimal source separation stays close to the original physical pixel size of 3′′ .
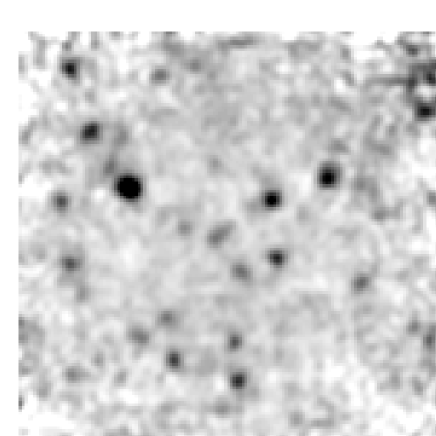
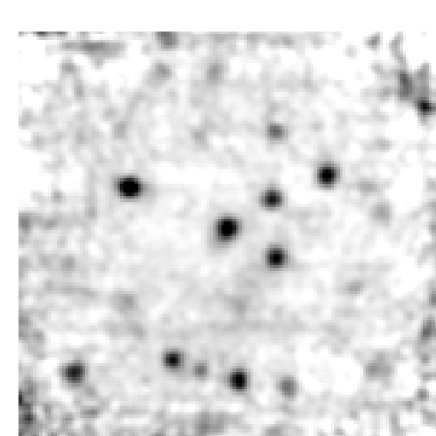
The central areas of the final maps at 7m and 15m are shown in figures 1 & 2. The excellent spatial resolution (by ISO standards) allows a positioning accuracy to optical-NIR images better than 1′′ , by using the 5 brightest sources in the field and unambiguous source cross-identification with the optical-NIR The high spatial resolution is the main advantage of this work over other surveys on ‘blank’ areas of the sky.
Source catalogues were extracted using the Sextractor package (Bertin & Arnouts 1997), searching for 15 contiguous pixels standing 1.5 above the noise. According to our simulations, this scanning of the data returns roughly 3 sources, because there is some correlated noise at short scale due to the 3x3 rebinning of the pixels. However on a wide scale the noise in the maps is very close to Gaussian. The algorithm was also re-run on the negative fluctuations for estimates of the false-positive detections. Finally simulations of the weakest detectable faint sources were made by inserting scaled-down versions of PSFs into the data, to determine the detection completeness level for various source strengths. This was found to be: 80% at 100Jy and 50% at 50Jy for the 15 map. This is close to the limits determined by Aussel et al. 1998 on the ISOCAM HDF. But thanks to the gravitational magnification, these sources constitute the intrinsically faintest MIR sources detected to date.
Because of the wide ISOCAM PSF (FWHM = 6′′ at 15 ) aperture corrected photometry was performed on the core of the source PSFs. This method has been shown to be linear to the faintest flux levels (Aussel et al. 1998)
In order to derive source densities, a detailed lensing model of A2390 has been produced by Kneib et al. (1998) and was used to determine:
-
the surface-area distortion of the probed area, which is a function of the redshift, as can be seen in figures 3 and 4
-
the lensing magnification factor, which is also an increasing function of redshift has values of 1.5 to 2, but much higher, up to 10, near the caustic lines.
Therefore it is essential to have a good estimation of the redshifts to derive the intrinsic fluxes of the sources. The spectroscopic redshifts were used when available (Péllo et al. 1991, Bezecourt & Soucail 1996), otherwise the photometric redshifts (Péllo et al. in preparation) and/or ’lensing’ predicted redshifts (Kneib et al. 1998 in preparation)
4. PRELIMINARY RESULTS
4.1. Sources detection
We derived source catalogues with intrinsic flux densities for the sources, detected at 3 confidence level, all with unambiguous optical-NIR counterparts on our deep HST-I band image. We found :
-
32 sources at 7 , among which are 19 cluster members and 13 lensed sources.
-
31 sources at 15 , that include 3 cluster galaxies and 28 lensed sources.
-
11 sources are detected at both 7 and 15 .
At 7 many E/SO galaxies from the cluster core are detected. This emission corresponds to the 5.5 restframe emission from the Rayleigh-Jeans tail of the cold stellar populations of these elliptical galaxies.
But at 15 the core cluster becomes largely transparent and acts as a natural gravitational telescope, since the 15 emission of the elliptical galaxies from the cluster core goes below the ISOCAM detection threshold. The central cD galaxy is an outstanding exception, because it displays very red colors in the MIR, that could be explained by a very active star forming region located within the envelope of the galaxy (Lémonon et al. 1998) or alternatively by the non-thermal synchrotron emission tail at 15 of these radio galaxy. The absence of 15 emission from core cluster galaxies is consistent with the observations of A1732 (z=0.193, Pierre et al., 1996), where MIR emitters avoid the cluster centre, like galaxies providing the blue excess in the Butcher-Oemler effect, and appear to be morphologically disturbed or spirals. So all but 3 of the 15 sources are lensed distant galaxies.
There is a good agreement between the source counts at 15 with ISOCAM observations of the HDF down to 50Jy, and we can extend the counts down to 30Jy when all factors are taken in account (Altieri et al. in preparation), as more than 6 sources have intrinsic fluxes below 50 Jy, in the tiny central area. We derive a preliminary density of sources above 50Jy of 2.5 104 per square degree, by taking account of the gravitational effects (see § 3) and the variable depth of the map. These counts lie clearly above the no-evolution extrapolation from IRAS counts.
Thanks to the gravitational magnification, these sources constitute the intrinsically faintest MIR sources detected to date.
4.2. Lensed Sources Properties
After the detection of the giant arc at , and other background objects in Abell 370 (Metcalfe et al. 1997, and 1998), the ISOCAM capabilities were confirmed with the nice detections of the complex arc system of Abell 2390 (Lémonon et al. 1998). The giant straight arc consists of three parts, A at (Frye & Broadhurst, 1998), and B-C, at (Pelló et al. 1991). SourceA was not detected in K band (Smail et al. 1993) nor by ISOCAM at either 7 nor 15 . HST images revealed that B and C are probably two interacting galaxies, and ISOCAM images are in full agreement with this picture because the 15 emission is centered perfectly between the two galaxies with a high [15 /7 ] ratio, (Lémonon et al. 1998). The source geometry is reminiscent of a distant version of the NGC4038/4039 interacting system, where the most intense starburst in this colliding system takes place in an off-nucleus region that is inconspicuous at optical wavelengths (Mirabel et al. 1998)
Some of the 15 sources show very red colours in the NIR ( and ) and can be classified as “faint red outlier galaxies” (FROGs), in deep K-band surveys (Moustakas et al. 1997). But other sources can not be distinguished from the other field galaxies from their optical colours alone, e.g. the sources do not show any particular blue or red excess. This effect was also observed for the galaxies seen in the Hubble Deep Field detected by ISO (Aussel et al., 1997), confirming that star formation is only partially sampled in the optical.
At least 3 sources are predicted to be at from their photometric/lensing redshift. But it is very interesting to note that many other lensed galaxies and arclets that are predicted to be at high-z from their optical-NIR photometry were not detected in the MIR. Thus ISOCAM reveals a different population of objects from those selected in the optical.
The optical to NIR Spectral Energy Distribution of one of these sources shown in figure 3 is strikingly similar to the SED predictions of a massive primordial star forming galaxy at an age of 0.2 Gyr (Franceschini et al. 1997). Therefore we believe that we have already evidence of a new population of MIR emitters at the faintest levels, with very red colours ([15 /7 ]1).
The dominant morphology of these sources from HST imaging is faint disturbed/interacting systems, also with very red optical-NIR colours. Some of the sources are too compact for classification. It should be noted that for most of these sources, even the I-band filter probes the restframe UV emission, where the morphology can be very different. There are hints that some of the ISOCAM sources are also detected by SCUBA in the sub-mm. We could be detecting the same population of dusty star-forming/dusty AGNs at intermediate to high redshifts, that show up in the sub-mm (Smail et al. 1997).

5. CONCLUSION: PROSPECTS FOR THE NGST
Our ultra-deep observations with ISOCAM towards the lensing cluster A2390 have revealed a population of MIR emitters. These sources are very faint at optical-NIR wavelengths, probably because of dramatic absorption by dust in the restframe UV and optical. It is very difficult to correlate such ISOCAM measurements of hot dust with the cooler dust that dominates the energy distribution of the galaxies, so the inferred global Star Formation Rate (Rowan-Robinson et al. 1997) is very uncertain. But in any case deep 15 imaging is a good way to select star forming regions which are not easily identifiable in UV/optical surveys. Objects with SED as in figure 3 could not have been found by optical imaging surveys based on the Lyman-continuum break or on strong emission lines (Steidel et al. 1996).
Our observations suggest that star formation in distant galaxies occurs in different modes and that the most vigorous episodes of star formation probably arise in dusty environments, as predicted by Franceschini et al. (1994). Therefore, great caution must be taken to infer global star formation activity based only on continuum luminosity of high-z galaxies, strongly absorbed in the UV. The global star formation history can be fully traced only if the effects of dust are taken into account.
The population of 15 emitters revealed by ISOCAM would probably show up with red colours in the 1-5 range of the NGST. But their SED is dramatically increasing through the MIR and towards the FIR and sub-mm, where most of their energy is emitted. So the extension of the NGST instrument capabilities up to the domain of 20 would tremendously increase the power of the NGST for the observation of these dusty systems at intermediate and high redshifts. With its unprecedented spatial resolution and the access to a wide wavelength range, the NGST will give the opportunity to study the morphology of these galaxies, to understand the origin of this hot dust emission, and to disentangle the scenarios of AGN versus starburst.
A huge scientific potential awaits the NGST with a MIR camera to study the early dust-enshrouded universe.
ACKNOWLEDGMENTS
The ISOCAM data presented in this paper was analyzed using ”CIA”, a joint development by the ESA Astrophysics Division and the ISOCAM Consortium. The ISOCAM Consortium is led by the ISOCAM PI, C. Cesarsky, Direction des Sciences de la Matiere, C.E.A., France.
References
- 1 Altieri B., Metcalfe L. et al., 1997, in The Young Universe, Monteporzio conference proceedings, astro-ph/9703174
- 2 Altieri B., Elbaz D., Metcalfe L. et al., 1998, Experimental Astronomy, in press.
- 3 Aussel H., Elbaz D., Starck J.-L., Cesarsky C.J., 1997, in Extragalactic Astronomy in the infrared, Edt Frontieres, Mamon G.A. et al.
- 4 Aussel H., Cesarsky C.J., Elbaz D., Starck J.L., 1998, A&A in press
- 5 Bertin E. & Arnouts S., 1996, A&A, 177, 393
- 6 Bezecourt J. & Soucail G., 1997, A&A, 317, 661
- 7 Cesarsky C.J. et al. 1996, A&A 315, L32
- 8 Franceschini A., Mazzei P., De Zotti G., Danese L., 1994, ApJ, 427, 140-154
- 9 Franceschini A., Aussel H. et al., 1997, ESA FIRST symposium (ESA SP 401), astro-ph/9707080
- 10 Franceschini A. et al., 1997, in Extragalactic Astronomy in the Infrared, Edt Frontieres, Mamon G.A. et al.
- 11 Frye B. & Broadhurst T., 1998, ApJ, 499, L115
- 12 Kessler M.F. et al. 1996, A&A 315, L27
- 13 Lémonon l., Pierre M., Cesarsky C.J., Elbaz D., Pelló R., Soucail G. and Vigroux L., A&A, 334, L21
- 14 Metcalfe L., Altieri B. et al., 1997, in Extragalactic Astronomy in the Infrared, Edt Frontieres, Mamon G. A. et al.
- 15 Mirabel I.F., Vigroux L., Charmandaris V., Sauvage M., 1998, A&A, 333, L1-L4
- 16 Moustakas L.A., Davis M., Zepf S.E., Bunker A.J., 1997, astro-ph/9712135
- 17 Ott S. et al., 1997, in Hunt G., Payne (eds) ASP Conference Series Vol. 125
- 18 Pelló R., LeBorgne J.F., Soucail G., Meller Y., Sanahuja B., 1991, ApJ, 366, 405
- 19 Pierre M. et al., 1996, A&A, 315L, 297
- 20 Rowan-Robinson M., Mann R.G., Oliver S.J. et al., 1997, MNRAS 289, 490
- 21 Starck J.-L. et al., 1997, in Extragalactic Astronomy in the Infrared, Edt Frontieres, G. Mamon
- 22 Smail I., Ellis R.S., Aragón-Salamanca A., Soucail G., Mellier Y., Giraud E., 1993, MNRAS 263, 628
- 23 Smail I., Ivison R.J., Blain A.W., 1997, ApJ, 490, L5
- 24 Steidel C.S., Giavalisco M, Dickinson M., 1996, AJ 112, 352
- 25 Taniguchi Y., Cowie L.L., Sato Y., et al., 1997, A&A, 328, L9