nicastro@ifcai.pa.cnr.it \thesaurus011 (13.07.1; 13.25.1)
BeppoSAX observations of GRB970402
Abstract
GRB970402 is the fourth gamma-ray burst detected by BeppoSAX simultaneously in the Gamma Ray Burst Monitor (GRBM) and one of the two Wide Field Cameras (WFCs). A rapid pointing of the BeppoSAX Narrow Field Instruments (NFIs) 8 hours after the GRB led to the identification of an unknown weak X-ray source: 1SAX J1450.1–6920. Its position was approximately at the center of the 3 arcmin error circle derived from the WFC image. Both the Medium Energy (MECS, 2–10 keV) and Low Energy (LECS, 0.1–10 keV) concentrators detected the source. A follow-up observation performed 1.5 days later and lasting 54 ks showed that the source had faded almost to, but not below the detectability threshold. The flux decrease between the two observations was a factor . 1SAX J1450.1–6920 was the second X-ray afterglow associated with a GRB. Searches promptly started at other wavelengths (optical, IR, radio) did not reveal any transient event within the 3 arcmin error circle.
keywords:
Gamma-rays: bursts; Gamma-rays: observation; X-rays: observation1 Introduction
The long-investigated nature of Gamma Ray Bursts (GRBs) has been mostly a matter of theoretical speculation for more than twenty years (for a review see e.g. Fishman & Meegan 1995). The rapid identification and accurate ( 1 arcmin) determination of their positions was the only way to initiate a new era in this field of astronomy. This became possible with the launch of the BeppoSAX satellite (Boella et al. 1997a). Descriptions of the BeppoSAX Gamma Ray Burst Monitor (GRBM, 40–700 keV), the two coded mask Wide Field Cameras (WFCs, 1.5–26 keV) and the quick-look analysis performed in order to localize GRB events are given elsewhere (Frontera et al. 1997; Feroci et al. 1997a; Costa et al. 1998; Jager et al. 1997; Costa et al. 1997a).
GRB970402 is the fourth GRB detected by one of the two BeppoSAX WFCs. The burst was also detected by Ulysses but not by BATSE. As for GRB970228 (Costa et al. 1997a), thanks to a prompt observation by the BeppoSAX NFIs, an X-ray afterglow was identified, but, unlike that event, no detection at other wavelengths has been reported for GRB970402.
In this paper we report and discuss the gamma-ray and X-ray results of GRB970402 and its afterglow.
2 BeppoSAX detection, TOO observations and data analysis
The GRBM was triggered on April 2, 22:19:39 UT (Feroci et al. 1997b). The 40–700 keV light curve showed a weak, structured burst with two major broad peaks with durations of and s respectively. Analysis of the ratemeters from the WFC1 confirmed the GRBM results of a burst lasting s (see Fig. 1).
In the 40–700 keV energy range the peak flux was erg cm-2 s-1 and the fluence (over 150 s) erg cm-2. In the WFC unit 1 the 2–10 keV burst peak flux was erg cm-2 s-1 and the fluence erg cm-2 with the ratios and . Spectral evolution analysis using the WFC and GRBM data indicate that all the spectra can be well fitted with a single power law. The spectral photon index () of the combined WFC + GRBM data of the entire burst is almost constant at a value of . Fitting only the WFC data gives an index of for the first peak and for the second one.

The burst position derived from the WFC image was (equinox 2000) R.A.=, Decl.= with an error radius of 3 arcmin (Heise et al. 1997). Triangulation using Ulysses and BeppoSAX-GRBM arrival times gives an annulus consistent with this position, but does not reduce the size of the error circle (Hurley et al. 1997).
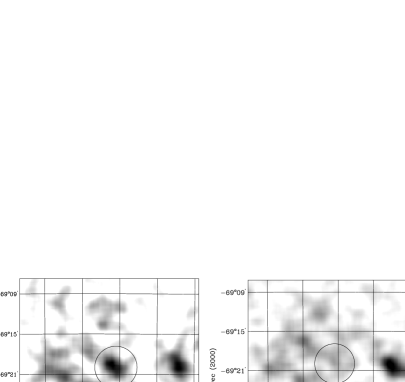
BeppoSAX performed two target of opportunity (TOO) observations of GRB970402 with its NFIs. The first observation started on April 3.280 UT, hours after the burst trigger. The total exposure time was 34.5 ks in the MECS and 11.6 ks in the LECS. Two sources are detected at a high statistical significance (see Fig. 2). 1SAX J1450.1–6920 is near the center of the WFC error circle. The second serendipitous source is arcmin west of it and will not be investigated in this paper. GRB970402 seems to lie on the Eastern edge of a diffuse quasi-circular emission region. We suggest that it is an unidentified shell-like SNR. Persistence of the X-ray emission in the second TOO confirms this hypothesis.
Analysis of the three MECS units independently, shows that 1SAX J1450.1–6920 is only marginally detected in unit 1. This is due to the lower sensitivity of this unit at energies below 4 keV. Also the MECS unit 2 shows a more stable background respect to unit 3, so it is more suitable for reconstructing the source position (this is true in particular for weak and off-axis sources). The source position was thus obtained using the MECS2 data only giving (equinox 2000) R.A.=, Decl.= with a conservative error radius of 50 arcsec (90% confidence level). The position obtained with the LECS data is consistent with that of MECS2. We computed the extraction circle giving the highest signal to noise ratio to be 24 for the MECS and for the LECS. For the spectral analysis, due to the presence of the SNR, the standard background subtraction using blank sky maps could not be performed. For the MECS we found that a good background estimate can be derived using the second TOO (longer than the first one), accumulating the counts in a circular annulus, centered on the source position, with radii 24–48. For the LECS we also used the data of the second TOO. In this case, because of the source decay, we could accumulate the background spectrum in an circle centered on the source but using only the data of the second part of the observation.
Spectral fits with a power law model for the LECS and MECS2+3 data together were performed. The best results were obtained using an absorbed power law. For the we obtain only an upper limit of cm-2 (90% confidence level, best value cm-2). The photon index is . The reduced is 1.1 (for 12 degrees of freedom). The average flux in the 2–10 keV MECS band is erg cm-2 s-1, while in 0.1–2 keV band (LECS) we observe a flux of erg cm-2 s-1.
BeppoSAX performed a second observation of GRB970402 on April 4.634, days after the burst, lasting about 65 ks. Exposure times were 54.3 ks for the MECS and 13.7 ks for the LECS. As can be seen from Fig. 2, 1SAX J1450.1–6920 is only marginally detected in the MECS. One can argue that this could be due to the underlying SNR and not to the afterglow itself. We believe this is not the case because, splitting the observation into three parts, we see a statistically significant count rate decrease; in fact we use only the first 50 ks to calculate the source flux. We obtain erg cm-2 s-1 (2–10 keV). In the LECS (0.1–2 keV) we only can derive a upper limit of erg cm-2 s-1.

The 2–10 keV light curve with statistical errors of the MECS, together with the WFC points corresponding to the two GRB peaks, are shown in Fig. 3. The fourth bin of the first TOO is a upper limit. In spite of the low statistics in the two TOOs, it is apparent that there is not a constant flux decay; note the possible flattening after the end of the first TOO. We performed a least squares fit with a power law (where time from the GRB onset) to the first TOO points obtaining in the range . Constraining the fit with the second WFC point (see discussion) and also including the second TOO point, gives . This last value is considerably steeper than the of GRB970228 (Costa et al. 1997a) and the of GRB970508 (Piro et al. 1998).
3 Discussion and conclusions
Optical monitoring was promptly started at various sites, but failed to detect any transient object at a level of R=21.5 (Groot et al. 1997), V=22.5 and I=21.7 (Pedersen et al. 1997). Moreover, two ISO (Infrared Space Observatory) observations performed two and twelve days after the burst did not detect any variable IR object (Castro–Tirado et al. 1998). Radio observations were performed at frequencies between 1.5 and 8.6 GHz using the Australia Telescope Compact Array starting April 3, 15:12 UT and lasting until July 3. No radio source was discovered within the X-ray afterglow error circle (Frail 1997). While the lack of an optical detection could be attributed to a high Galactic extinction in this direction (), the non-detection in the IR and radio suggests it could more likely be due to a rapid decay law.
Including GRB970111 (Feroci et al. 1998), GRB970402 represents the third GRB afterglow discovered at X-ray wavelengths. A comparison of the spectral and temporal behaviour of this burst in the framework of the results from the entire sample of GRBs with detected afterglows is beyond the scope of this paper. A review of the spectral properties of all the GRBs detected by BeppoSAX is presented by Frontera et al. (1998b).
GRB970402 has a peak flux in the GRBM and WFC bands more than one order of magnitude lower than that of GRB970228, while their ratio is comparable to the 0.04 of the February event (Frontera et al. 1998a) and to the 0.01 of GRB970111 (Feroci et al. 1998). On the other hand the fluence ratio is 4 times smaller than that of GRB970228 and 10 time smaller than that of GRB970508, but similar to the 0.04 of GRB970111. This could suggest some correlation with the presence or lack of an optical transient (GRB970228 and GRB980508 have it, not the other two) but at least for another burst, GRB980329, the fluence ratio is only (in ’t Zand et al. 1998) but an optical counterpart was detected (Palazzi et al. 1998). Also, in spite of the many differences in the morphology of GRB970228 and GRB970402, their 2–10 keV mean flux ratio does not change in the afterglow (i.e. after hours from the high energy event).
From the data of the two TOOs alone we note that the decay is not monotonic therefore it is difficult to uniquely determine the flux decay index. However, if we fit the first TOO data taking into account the fourth time bin upper limit, we obtain in the range . The steeper index is obtained by setting the upper limit to its formal value decreased by . Both these values give an extrapolated flux at the time of the GRB consistent with that measured by the WFC (see Fig. 3). This might be an indication that the GRB and afterglow X-ray emission have a common origin and that, as for GRB970228, the afterglow starts some tens of seconds after the gamma-ray burst onset (Frontera et al. 1998a). If we then add the WFC flux of the second GRB peak to the fit we obtain a slope , consistent with the range found from the first TOO alone. This result does not change adding the second TOO point to the fit. This would be the most rapid decay so far measured.
Simple fireball models predict a flux evolution with (Tavani 1997; Wijers et al. 1997). Considering the two decay indices and , we obtain () and () respectively. These values are both in agreement with the we find from the spectral fitting of the first TOO. On the other hand only the first value is fully consistent with the of the entire GRB event and found in the WFC data of the second peak ( s after the burst onset). So, due to the uncertainties on the flux decay index and low statistics, we do not see evidence of X-ray spectral evolution.
GRB970111 has a much higher flux and quite peculiar spectral evolution compared to GRB970402 (Frontera et al. 1998b). However, in addition to the small and , these two bursts are remarkably similar when considering their afterglow X-ray flux of erg cm-2 s-1 after s from the GRB onset, the lack of an optical/IR/radio transient and the . Also the two GRBs profiles have similar multi-peak structure.
Even though the X-ray flux is not intense enough for a study with good statistical significance, the afterglow flux decay does not clearly display a constant behaviour. Again at a low significance, this is also true for GRB970111 and GRB970228. In the case of GRB970508, the flux was ten times higher and allowed a clear demonstration of the departure from a smooth decay (Piro et al. 1998) of the X-ray flux; the same was true of ASCA observations of GRB970828 (Yoshida et al. 1997). A fireball model with a highly radiative, relativistically expanding shell (Cavallo & Rees 1978; Rees & Mészáros 1992) cannot explain such behaviour unless, for example, a variable density for the surrounding environment is invoked (Vietri 1997), or an asymmetric shell with temporally evolving patchy X-ray active regions (Fenimore et al. 1998). Future X-ray afterglows will determine whether (as well could be the case), the non-constant fading is the rule and not the exception.
Acknowledgements.
This research is supported by the Italian Space Agency (ASI) and Consiglio Nazionale delle Ricerche (CNR). BeppoSAX is a major program of ASI with participation of the Netherlands Agency for Aerospace Programs (NIVR). All authors warmly thank the extraordinary teams of the BeppoSAX Scientific Operation Center and Operation Control Center for their enthusiastic support to the GRB program. K. H. is grateful to the US SAX Guest Investigator program for support.References
- [1] Boella G., et al., 1997a, A&AS, 122, 299
- [2] Boella G., et al., 1997b, A&AS, 122, 327
- [3] Castro-Tirado A., et al., 1998, A&A, 330, 14
- [4] Cavallo G., M.J. Rees, 1978, MNRAS, 183, 359
- [5] Costa E., et al., 1997a, Nat, 387, 783
- [6] Costa E., et al., 1997b, IAUC 6533
- [7] Costa E., et al., 1998, Adv. Sp. Res., in press.
- [8] Fenimore E.E., et al., 1998, ApJ (submitted, astro-ph/9802200)
- [9] Feroci M., et al., 1997a, Proc. SPIE 3114, 186
- [10] Feroci M., et al., 1997b, IAUC 6610
- [11] Feroci M., et al., 1998, A&A, in press.
- [12] Fishman G.J., Meegan C.A., 1995, ARA&A, 33, 415
-
[13]
Frail D., WEB page:
http://www.nrao.edu/dfrail/grbvla/grb.html - [14] Frontera F., et al., 1997, A&AS, 122, 357
- [15] Frontera F., et al., 1998a, ApJ, 493, L67
- [16] Frontera F., et al., 1998b, ApJ (in preparation)
- [17] Groot P., et al., 1997, IAUC 6616
- [18] Heise J., et al., 1997, IAUC 6610
- [19] Hurley K., et al., 1997. In: Proc. The Active X-ray Sky, 21–24 Oct. 1997, Rome (I) (in press)
- [20] in ’t Zand J.J.M., et al., 1998, ApJ, submitted
- [21] Jager R. et al., 1997, A&AS, 125, 557
- [22] Katz J.I., Piran T., 1997, ApJ, 490, 772
- [23] Klebesadel R.W., et al., 1973, ApJ, 182, L85
- [24] Palazzi E., et al., 1998, A&A, in press
- [25] Parmar A., et al., 1997, A&AS, 122, 309
- [26] Pedersen H., et al., 1997, IAUC 6628
- [27] Piro L., et al., 1997, IAUC 6617
- [28] Piro L., et al., 1998, A&A 331, L41 (astro-ph/9710355)
- [29] Rees M.J., Mészáros P., 1992, MNRAS, 258, 41
- [30] Tavani M., 1997, ApJ, 483, L87
- [31] van Paradijs J., et al., 1997, Nat, 386, 686
- [32] Vietri M., 1997, ApJ, (submitted, astro-ph/9706060)
- [33] Wijers R.A.M., Rees M.J, Mészáros P., 1997, MNRAS, 288, L51
- [34] Yoshida A., et al., 1997. In: Proc. of the 4-th Huntsville’s GRB Symposium (in press)