Observation of Cen A by the Rossi X-ray Timing Explorer
Abstract
The Rossi X-ray Timing Explorer made a short (10 ks) observation of the radio galaxy Centaurus A on 14 August 1996. Analysis of the combined 2.5240 keV spectrum has revealed a heavily absorbed (NH=9.420.241022 cm-2) primary power law (=1.860.015) and an iron line due to fluorescence of cold matter (E.W.=16225 eV). Flux from either a jet, primary flux scattered into the line of sight, or primary flux seen through a partial absorber was not required. The iron line width is unresolved at the 95% confidence level ( 0.54 keV). No significant variability in the iron line flux is seen from measurements over the last two decades, while the overall continuum flux varied by more than a factor of four, which implies that the line emission region is distant from that of the primary emission. While radio-quiet Seyfert galaxies exhibit spectral components attributable to Compton reflection from cold matter, Cen A reveals no such component (exposed solid angle ratio 0.09). This supports unified models of active galaxies that have little difference between Seyfert 2 and low luminosity radio galaxies.
1 Introduction
Cen A (NGC 5128) was discovered in X-rays over 25 years ago (Bowyer et al. 1970) and has been observed by most X-ray astronomy missions since then (see compilations in Baity et al. 1981 and Jourdain et al. 1993). At a distance of 3.5 Mpc (Hui et al. 1993), Cen A is one of the nearest active galactic nuclei (AGN). Even though the nucleus is heavily obscured (in part by the famous dust-lane that is seen to cross the galaxy), Cen A is one of the brightest extragalactic X-ray sources. Furthermore, Cen A is clearly a radio-loud object, displaying prominent radio jets and lobes (Burns, Feigelson, & Schreier 1983), and, as such, has provided much of our information on the high energy nature of low luminosity radio-loud AGN. A comparison of Cen A to the well-studied Seyfert galaxies (Nandra & Pounds 1994, Nandra et al. 1997, Turner et al. 1997b,c), as well as other radio-loud AGN, in the context of the unified model for AGN (e.g. Antonucci 1993, Woźniak et al. 1998), can yield insight into the differences between radio-loud and radio-quiet AGN.
One area of radio-loud/radio-quiet difference is in the amount of the observed Compton “reflection”component. Compton reflection and line fluorescence (especially from iron) are important diagnostics of the central engine structure. Many Seyfert (i.e., radio-quiet AGN) nuclei show these strong features which are widely believed to result from irradiation of a thin accretion disk by a disk corona (Guilbert & Rees 1988; Lightman & White 1988; George & Fabian 1991). This component manifests itself as an iron line at 6.4 keV, an iron edge at 7.1 keV, and a hardening of the spectral slope above 10 keV compared to the 2–10 keV spectrum. Many radio sources (including Cen A) appear to have significantly weaker reflection features than do Seyfert nuclei (Woźniak et al. 1998, Zdziarski et al. 1995, Grandi et al. 1997). Indeed, in most radio-loud objects there is no strong Compton reflection continuum, and the iron line is interpreted as originating in Thompson-thin circumnuclear material. In addition, for the case of Cen A, the spectrum extends to 1 MeV (Steinle et al. 1998), while in radio-quiet Seyferts there is no indication of flux beyond a few hundred keV (Johnson et al. 1997). This, too, may indicate a difference in the flow of matter in the vicinity of the accretion disk, such as advection dominated accretion flow versus thin disk accretion, and the presence of the collimated radio jet.
Previous observations have shown Cen A to have highly complex X-ray/gamma-ray properties (Döbereiner et al. 1996; Turner et al. 1997a; Feigelson et al. 1981) with multi-temperature diffuse flux, a spatially resolved jet in radio and X-rays, and a nuclear component with complex low energy absorption. The observed iron line at 6.4 keV of equivalent width 100 eV is consistent with reprocessing from the absorbing material (Turner et al. 1997a, Sugizaki et al. 1997). At energies above 10 keV, Woźniak et al. (1998) analyzed Ginga data and found no evidence for a strong Compton reflection component (/20.15) in addition to the heavily absorbed (NH=1.71023cm-2) power law (=1.79). This implies there is little cold, Thompson-thick material in the close vicinity of the AGN (Woźniak et al. 1998) that reflects X-rays into our line of sight. Taken together with the iron line equivalent width, this result is consistent with transmission of the primary flux through the line-of-sight absorber and viewing the accretion disk nearly edge-on. CGRO/OSSE observations reveal a steepening of the spectrum at 140–170 keV, which might be due to a nonthermal electron distribution in the central engine (Kinzer et al. 1995). The CGRO/COMPTEL and CGRO/EGRET instruments indicate that this steepening trend continues to 1 GeV with spectral indices ranging from 2.6 to 3.3 depending upon intensity (Steinle et al. 1998).
In this paper we present the results of a short 10 ks observation of Cen A by the Rossi X-ray Timing Explorer (RXTE) in the range 2.5240 keV. Section 2 details the observations, section 3 presents the data reduction and analysis, section 4 discusses the the results with respect to Cen A itself and in the larger view of AGN unification, and section 5 presents the conclusions.
2 Observations
The RXTE observed Cen A from 2:43 to 8:05 UT on 1996 August 14 with the Proportional Counter Array (PCA) and the High Energy X-ray Timing Experiment (HEXTE). The PCA contains 5 large area, xenon, multiwire, multilayer, gas proportional counter units that cover the energy range 2-60 keV with energy resolution of 1 keV at 6 keV (Jahoda et al. 1996). All 5 proportional counters were used in this observation for a total open area of 7000 cm2. The field of view of each PCA unit is constrained to 1∘ Full Width Half Maximum (FWHM) by a beryllium/copper honeycomb collimator and all 5 are coaligned to within 5 arcminutes to the spacecraft science pointing axis.
The HEXTE consists of two independent clusters of detectors, each cluster containing four NaI(Tl)/CsI(Na) phoswich scintillation counters, each identically collimated by a lead honeycomb (Rothschild et al. 1998). All eight collimators are co-aligned with the PCA on-source to give both clusters a 1∘ FWHM field of view. The net open area of the eight detectors is 1600 cm2, and each detector covers the energy range 15-250 keV with an average energy resolution of 9 keV at 60 keV.
Throughout the RXTE mission, the All-Sky Monitor (ASM) provides an estimate of the 1.5-12 keV flux from the 100 brightest X-ray sources on a 90 minute and a daily basis. The ASM is composed of three scanning shadow cameras, each of which is a position sensitive xenon proportional counter that views a 690∘ FWHM section of sky through a one-dimensional coded mask (Levine et al. 1996). Each camera has 30 cm2 at 5 keV.
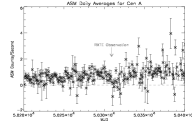
Figure 1 shows the RXTE ASM counting rate for Cen A in the 1.5-12 keV range for 200 days centered on the RXTE pointed observation. The day of the observation (MJD 50309) is indicated in the Figure, and is at or shortly after the beginning of an interval of lower than average flux. Comparison of PCA and ASM fluxes indicates the PCA/HEXTE observations were made at or near the lower flux level. The four PCA/HEXTE viewing intervals, separated by Earth-occults and South Atlantic Anomaly (SAA) passages do not reveal any significant change in intensity over the 5.5 hours of the observation. Also shown are the 20-100 keV fluxes measured on a daily average by CGRO/BATSE using the Earth occultation technique. The BATSE data are not sensitive to the magnitude of temporal variation seen by the ASM, as evidenced by the BATSE error bars. Thus, the RXTE observation appears to have occurred during a temporary period of lower intensity than for the few weeks on either side of the observation. While this rate is low vis-a-vis the weeks surrounding the observation, it is quite typical when compared to past observations.
3 Data Reduction and Analysis
The PCA standard data were used for the accumulation of spectra and light curves, while the HEXTE standard data provided the HEXTE spectral histograms and light curves. The data from both instruments were accumulated on 16 s intervals and no significant variability was noted. The PCA response matrix used was dated 24 April 1998. Estimates of systematic errors were added to the statistical errors for the PCA spectral data to reduce the effects of imperfect knowledge of the instrument response near the K- and L-edges of xenon. These errors were: 0.5% from 2.5 – 5.5 keV, 1% from 5.5 – 8 keV, 0.5% from 8 – 20 keV, and 3% from 20 – 90 keV. These values were determined from residuals to fits to the Crab nebula observations. No additional systematic errors were incorporated in the HEXTE data, because the statistical errors were larger than the few percent systematic errors reported in Rothschild et al. (1998).
3.1 Background Subtraction
The PCA background was estimated using models of the instrument background, activation, and the cosmic diffuse flux derived from blank sky observations obtained throughout 1997. We were able to provide a good background estimate over the entire PCA range by selecting non-SAA and non-occulted data, and removing time intervals of electron precipitation as evidenced by raw rates in various layers of the PCA. The PCA analysis was performed over the 2.560 keV range. PCA source and background rates in various energy channels are given in Table 1.
Contrary to lower energy measurements, hard x-ray observations are made in a background-dominated regime, except for the brightest sources. The background, therefore, must be measured during each observation on timescales short compared to those for background variations. Modeling background from counting rates is at least an order of magnitude less accurate, and is not appropriate for hard x-ray measurements. The HEXTE cluster rocking subsystem moves the viewing direction of the detector arrays in a cluster between on-source and off-source every 16 s in order to obtain the near-real time measurement of the instrument background. The nominal angular offset of 1.5∘ on either side of the on-source position was used in the Cen A observation. Since the rocking axes of the two clusters are orthogonal to each other, four background regions were sampled around Cen A’s position. No confusing sources were detected. This technique provides background subtractions that are not based upon any modeling, and are direct measurements taken during each and every observation. Analysis of blank fields demonstrated that the net blank-field flux was consistent with zero with residuals of 1% of background or less (Rothschild et al. 1998). The HEXTE analysis was performed over the 15240 keV range. HEXTE source and background rates in various energy channels are given in Table 1.
3.2 Spectrum
The PCA and HEXTE data were fit simultaneously using the XSPEC 10.0 package with the relative normalization of the two instruments included as a fitted parameter. We utilized a model that contained a heavily absorbed power law plus gaussian emission line to represent the primary flux. The best-fit values for the case of the emission line width set to zero is given in Table 2. All error bars, unless specified differently, are 95% confidence, and generated by varying one parameter and fitting all others. The decrease in that occurred when the line width was included as a free parameter was 5.2 for one additional degree of freedom out of 540. The F-test indicates that the probability of this being a fluctuation is 0.021, and therefore not significant at the 98% level. The range of the iron line width at the 95% confidence level is 0.11 keV(FWHM)0.54 keV. The energy of the line, 6.460.097 keV, indicates that the emission is from cool, i.e. weakly ionized, material. The best fit model with a narrow line is shown in Figure 2 as the predicted instrument counts histogram compared to the observed counts histogram. This figure has not been corrected for the relative normalization of the two HEXTE clusters with respect to the PCA (see Table 2). The inferred incident spectrum is shown in Figure 3 in the form of Fν versus energy with the HEXTE flux normalized to the PCA and with the points from both detector systems rebinned for display purposes. The data from the two HEXTE clusters have also been combined into a single spectrum.
Turner et al. (1997a) reported an additional component due to ROSAT observations of the jet from Cen A, characterized by a power law with photon index =2.29 or a thermal bremsstrahlung model with kT=1.27. We tested the Cen A spectrum for the presence of an additional unabsorbed component in two ways. The first was by the addition of a power law whose photon index was a free parameter in the fitting. The decrease in was 4.0 for 2 additional parameters. The F-test indicates a probability of 0.13 that a fluctuation could have produced such a value. The second test was to utilize a partial covering fraction model of the absorber that would allow for a percentage of the primary flux to be transmitted through the absorber. In this case the decreased by 7.4, which, again, is less than a 3 improvement. The 95% confidence range is 1.3–6.6% for the fraction of the primary flux that is transmitted. As a result, we conclude that an additional unabsorbed component was not required by the short RXTE observation.
The RXTE data were tested for the presence of a spectral break, or steepening at higher energies, using a broken power law. The best-fit broken power law model was consistent with no break at all, and the power law index above the break energy (held fixed at 140 keV) was essentially unconstrained. This result is due to the small number of counts in HEXTE above 100 keV in this short observation. This is consistent with the CGRO/OSSE (Kinzer et al. 1995) and Welcome-1 (Miyazaki et al. 1996) results which extent to higher energies.
In order to test for the presence of a Compton reflection component, two fits were made to the data. First, an absorption edge at 7.1 keV was added to the heavily absorbed primary power law. This resulted in an upper limit to the absorption depth of 0.016, indicating that no strong reflection component was present. The lack of an iron absorption edge in the data also implies that improper modeling of the continuum does not affect the inferred width of the fitted Fe line (see Zdziarski, Johnson, & Magdziarz 1996 for a discussion of this systematic effect in NGC 4151). This was further confirmed by substituting a power law plus Compton component (XSPEC 10.0 model PEXRAV, Magdziarz & Zdziarski 1995) for the primary power law in the model. The 90% upper limit to a reflection component, expressed as the ratio of the solid angle for primary flux scattered into our line of sight to an infinite slab, was found to be /20.088 for an assumed inclination angle of 70∘.
When we modeled the iron line as coming from a relativistic accretion disk with an r-2 dependence of the emissivity from 10 GM/c2 to 1000 GM/c2, we found the disk inclination not to be constrained by the observations (90% confidence interval includes all angles from 0 to 90 degrees) and the resulting centroid was consistent with the gaussian line fits. The other model parameters are not substantially changed, and the =5.0 with respect to the narrow line model was not significant (probability=0.024). Thus, two indications of observed X-ray emission from an accretion disk – a Compton reflection spectrum and an iron line from a disk – are not required by the present data.
To recapitulate, the RXTE spectrum of Cen A can be best described by a heavily absorbed power law extending above 100 keV and a 16224 eV equivalent width iron line from cold matter. The FWHM of the iron line is less than 0.54 keV, and therefore taken to be narrow. Measurement of a steepening in the power law above 100 keV is precluded by the small number of counts in that range for this short observation. Neither an additional unabsorbed low energy component, nor a Compton reflection component are required to fit the data.
The RXTE best fit can be compared to the ASCA (Sugizaki et al. 1997; Turner et al. 1997a) and the Ginga (Woźniak et al. 1998) results. The RXTE power law index of 1.8570.008 agrees with the ASCA and Ginga values. The measured absorption, however, has decreased about 60% from 1.61023 cm-2 to the RXTE value of 0.940.011023 cm-2 in three years. At the same time the equivalent width of the narrow iron line has increased 33% from 120 eV to 160 eV. The flux of the Fe line, on the other hand, has not changed significantly (see Table 3). The RXTE and Ginga upper limits on the reflection component are in complete agreement, i.e., none is detected to less than /20.09. This can be compared to a weighted mean of 0.720.05 for 27 GINGA Seyfert galaxies (Nandra & Pounds 1994). The latter sample was dominated by radio-quiet objects with only three 3C sources included.
4 Discussion
Observations of molecular lines in emission and absorption from Cen A (Israel et al. 1990) imply that a thick torus with outer radius of 325 pc, inner radius of 80 pc and thickness of 80 pc surrounds the nucleus. The density of the torus decreases as r-2 from an inner edge value of 2104 cm-3. With an estimated mass of 2107 M⊙, the line of sight through the torus would have 1.01023 atoms cm-2, which is consistent with past and present measurements in the X-ray range. Leahy & Creighton (1993) have simulated X-ray spectra for power law fluxes embedded in a spherical absorber, and Figure 1 of Turner et al. (1997b) displays the result for a power law photon index of 2. This calculation predicts about 100 eV equivalent width for a column density of 1 1023 cm-2. If the iron line were due to reprocessing of the primary flux in a cold accretion disk by Compton reflection, on the other hand, equivalent widths close to 300 eV would be expected. The present Cen A result of 16224 eV equivalent width and no evidence of a Compton component is consistent with the iron emission coming from a power law flux embedded in a uniform spherical absorber.
Over the last two decades, the flux from the iron line and the continuum flux have been measured by instruments on OSO-8, EXOSAT, Tenma, Ginga, ASCA, and now RXTE. Table 3 gives the published history of these measurements of the spectral index, absorbing column, iron line equivalent width, iron line line flux, and 2-10 keV flux from Cen A. The multiple observations by OSO-8 and EXOSAT each claim no variation in iron line flux, while reporting changes in 210 keV continuum flux of factors of 2 or more. On the other hand, both the line and continuum fluxes are reported to be essentially constant for the two Ginga observations. Over the last 20 years the absorbing column depth has ranged over 1–2 1023 cm-2 while the equivalent width has values from 50 to 200 eV. Comparison to the Leahy and Creighton (1993) model displayed in Figure 1 of Turner et al. (1997b), shows that the equivalent width/absorbing column values scatter about the calculation for circumnuclear material with, at most, factor of two deviations above and below the model predictions.
Does the iron line flux vary? Fitting the data in Table 3 to a single mean value of 4.6510-4 photons cm-2 s-1 yields a = 1.15 for 10 degrees of freedom. This implies the line fluxes are consistant with a single value. At the same time, the mean continuum flux is 3.8610-10 ergs cm-2 s-1 with a large scatter about this value. Fitting to this mean value yields a in the thousands. Clearly, the iron line originates far away from the nucleus. Due to the sparse sampling of Cen A by instruments capable of measuring the iron line and continuum flux, one cannot test for time delays between continuum variations and those in the line flux, which might support the molecular torus as the site of the iron line emission.
Using ASCA data, Sugizaki et al. (1997) found a hard nuclear and a soft diffuse component plus low-Z lines of Mg, Si, and S and the high-Z line from Fe. The soft component had a factor of ten less absorbing column depth than the hard component, indicating that it was not being viewed through the torus. The equivalent widths of the low-Z lines and the soft continuum were compatible with being produced by the primary hard flux scattered by cold matter. The iron line equivalent width, under the same assumptions, was a factor of two larger than expected. From this, Sugizaki et al. (1997) concluded that the low-Z emitting material and the material responsible for the Fe line must be located in separate regions. This further implies that the covering factor of the primary source must be less than unity for the primary flux to reach the reprocessing site. This is consistent with the unified model where the molecular torus does not cover the poles but does impact observations of the primary flux from high inclination angles.
Nandra et al. (1997) have studied 18 Seyfert 1 galaxies with ASCA and find an average spectral behavior, using the relativistic disk model, that is compatible with unification models, i.e., photon indices averaging 1.9, equivalent widths of iron lines averaging 230 eV, and small (30∘) inclination angles. The line widths are explained by emission from a range of radii in the accretion disk around a supermassive black hole, and emission from another region is not required. Importantly, another component to the iron emission due to observing the primary flux through a dense (N 1023 atoms cm-2) uniform medium is not required. Nandra and Pounds (1994) used the broad-band Ginga observations of 20 Seyfert 1 and 7 Narrow Emission Line Galaxies, that are also classified as Seyfert 2 galaxies (Turner et al., 1997b), to investigate reflection components under the assumption of a face-on geometry. Reflection components were detected in roughly half of the samples of both types of Seyfert galaxy.
Turner et al. (1997b,c) have summarized ASCA observations of 25 Seyfert 2 galaxies and thoroughly discussed the consequences of observing scattered and reflected X-rays. Several radio quiet galaxies in their sample exhibited iron lines (EW200 eV) from cold (EFe=6.4 keV) material, and yet had little or no evidence for Compton reflection components, which is consistent with viewing the accretion disk at a high inclination angle. When combined with the Seyfert 1 observations, this indicates that the inner regions of near edge-on radio galaxies and radio quiet Seyfert 2 galaxies are similar, and that the unified model of active galaxies may be applicable independent of radio character. This further implies that the presence of the highly collimated jet in radio galaxies like Cen A plays a small part in determining the disk/reflection emission from active galaxies. On the other hand, when one is viewing within the collimated beam, as is the case for blazars, the jet dominates the x-ray and gamma-ray emission observed.
5 Conclusions
A short RXTE observation of Cen A during a short period of reduced flux has revealed no temporal variability over 5.5 hours and a complex spectrum in the 2-250 keV range. The best fit spectral model consists of a heavily absorbed primary flux and an emission line from cool iron. The measured column depth, iron line equivalent width, and power law index are consistent with earlier observations. The iron line flux has not been observed to vary in sparce sampling of it over the last two decades, while the continuum flux has varied dramatically, indicating that the iron line emission occurs far from the primary X-ray emission site.
The line equivalent width is consistent with production in the molecular torus by the primary hard X-ray flux, and the weakness or lack of a Compton reprocessing component is consistent with the nearly edge-on view of the accretion disk. In addition, the lack of a line at 6.7 keV and no Compton component indicates that an ionized gas enveloping the broad line region is not scattering a significant amount of X-ray flux into our line of sight. Cen A’s X-ray character is essentially the same as that of radio-quiet Seyfert 2 galaxies. This indicates that the presence of the collimated radio jet does not significantly affect the parameters of the matter within the inner parsec of the system and that the unification model for radio-quiet AGN may be extended to include low luminosity radio galaxies. Future observations of Cen A will be made in 1998 and will be the basis for variability studies that may shed more light on the geometry of the inner region of this active galaxy.
References
- (1)
- (2) Antonucci, R. 1993, ARA&A, 31, 473.
- (3)
- (4) Baity, W.A. et al. 1981, ApJ, 244, 429.
- (5)
- (6) Bowyer, C.S., Lampton, M., Mack, J. & de Mendonca, F. 1970, ApJL, 161, L1.
- (7)
- (8) Burns, J.O., Feigelson, E.D., & Schreier, E.J. 1983, ApJ, 273, L28.
- (9)
- (10) Döbereiner, S. et al. 1996, ApJ, 470, L15.
- (11)
- (12) Feigelson E.D., Schreier, E.J., Delvaille, J.P., Giacconi, R., Grindlay, J.E., & Lightman, A.P. 1981, ApJ, 251, 31.
- (13)
- (14) George, I.M. & Fabian, A.C. 1991, MNRAS, 249, 352
- (15)
- (16) Grandi, P., Sambruna, R.M., Maraschi, L., Matt, G., Urry, C.M., & Mushotzky, R.F. 1997, ApJ, 487, 636.
- (17)
- (18) Guilbert, P.W. & Rees, M.J. 1988, MNRAS, 233, 475
- (19)
- (20) Hui X., Ford, H.C., Freeman, K.C., & Dopita, M.A. 1993, ApJ, 414, 463.
- (21)
- (22) Israel, F.P., van Dishoeck, E.F., Baas, F., Koornneef, J., Black, J.H., & de Graauw, T. 1990, A&A, 227, 342.
- (23)
- (24) Jahoda, K., Swank, J.H., Giles, A.B., Stark, M.J., Strohmayer, T., Zhang, W., & Morgan, E. 1996, EUV, X-Ray, and Gamma-Ray Instrumentation for Astronomy VII, SPIE Proceedings, eds: O.H.V. Sigmund and M. Gummin, 2808, 59.
- (25)
- (26) Johnson W.N., Zdziarski, A.A., Madejski, G.M., Paciesas, W.S., Steinle, H.. & Lin, Y.-C. 1997, Proceedings of the Fourth Compton Symposium, eds: C.D. Dermer, M.S. Strickland, & J.D. Kurfess, (AIP:Woodsbury, NY), 283.
- (27)
- (28) Jourdain, E. et al. 1993, ApJ, 412, 586.
- (29)
- (30) Kinzer, R.L. et al. 1995, ApJ, 449, 105.
- (31)
- (32) Leahy, D.A. & Creighton, J. 1993, MNRAS, 263, 314.
- (33)
- (34) Levine, A.M., Bradt, H., Cui, W., Jernigan, J.G., Morgan, E.H., Remillard, R., Shirey, R.E., & Smith, D.A. 1996, ApJ, 469, L33.
- (35)
- (36) Lightman, A.P. & White, T.R. 1988, ApJ, 335, 57
- (37)
- (38) Magdziarz, P. & Zdziarski, A.A. 1995, MNRAS, 273, 837.
- (39)
- (40) Miyazaki, S. et al. 1996, PASJ, 48, 801.
- (41)
- (42) Morini, M., Anselmo, F., & Molteni, D. 1989, ApJ, 347, 750.
- (43)
- (44) Mushotzky, R.F., Serlemitsos, P.J., Becker, R.H., Boldt, E.A., & Holt, S.S. 1978, ApJ, 220, 790.
- (45)
- (46) Nandra, K. & Pounds, K.A. 1994, MNRAS, 268, 405
- (47)
- (48) Nandra, K. et al. 1997, ApJ, 477, 602.
- (49)
- (50) Rothschild, R. E. et al. 1998, ApJ, 496, 538.
- (51)
- (52) Steinle, H. et al. 1998, A&A 330, 97.
- (53)
- (54) Sugizaki, M., Inoue, H., Sonobe, T., Takahashi, T., & Yamamoto, Y. 1997, PASJ, 49, 59.
- (55)
- (56) Turner, T.J., George, I.M., Mushotzky, R.F., & Nandra, K. 1997a, ApJ, 475, 118.
- (57)
- (58) Turner, T.J., George, I.M., Nandra, K., & Mushotzky, R.F. 1997b, ApJ, 488, 164.
- (59)
- (60) Turner, T.J., George, I.M., Nandra, K., & Mushotzky, R.F. 1997c, ApJS, 113, 23.
- (61)
- (62) Wang, B., Inoue, H., Koyama, K., Tanaka, Y., Hirano, T., & Nagase, F. 1986, PASJ, 38, 685
- (63)
- (64) Woźniak, P.R., Zdziarski, A.A., Smith, D., Madejski, G.M., & Johnson, W.N. 1998, MNRAS, 299, 449.
- (65)
- (66) Zdziarski, A.A., Johnson, W.N., & Magdziarz, P. 1996, MNRAS, 283, 193.
- (67)
- (68) Zdziarski, A.A., Johnson, W.N., Done, C., Smith, D., & McNaron-Brown, K. 1995, ApJ, 438, L63.
| PCA (5 detectors) | Cen A | Background | Cen A/Background |
|---|---|---|---|
| 2–10 keV | 100.50.25 c/s | 31.450.05 c/s | 3.200.008 |
| 10–20 keV | 37.710.11 c/s | 25.270.05 c/s | 1.490.004 |
| 20–60 keV | 7.250.35 c/s | 67.570.08 c/s | 0.110.005 |
| HEXTE A (4 detectors) | |||
| 15–30 keV | 2.990.13 c/s | 24.570.10 c/s | 0.1220.005 |
| 30–100 keV | 2.380.24 c/s | 80.230.18 c/s | 0.0300.003 |
| 100–240 keV | 0.240.20 c/s | 54.880.15 c/s | 0.0040.004 |
| HEXTE B (3 detectors) | |||
| 15–30 keV | 2.210.11 c/s | 15.760.08 c/s | 0.1400.007 |
| 30-100 keV | 1.980.21 c/s | 60.140.16 c/s | 0.0330.003 |
| 100–240 keV | 0.040.17 c/s | 38.860.13 c/s | 0.0010.004 |
| — Best Fit Spectrum — | |
| Absorption | NH = 9.420.24 1022 cm-2 |
| Power Law | = 1.8570.015 |
| F(2–10 keV) = 3.3980.052 10-10 ergs cm-2 s-1 | |
| Iron Line | EFe = 6.460.097 keV |
| (FWHM) = 0. | |
| F(6.46 keV) = 5.37 10-4 photons cm-2 s-1 | |
| E.W. = 16225 eV | |
| Normalization | cluster AaaRatio of HEXTE to PCA Normalization for Cluster A = 0.6880.020 |
| cluster BbbRatio of HEXTE to PCA Normalization for Cluster B = 0.6930.024 | |
| Flux(2–10 keV) = 1.9720.002 10-1 ergs cm-2 s-1 | |
| Fit | /D.O.F. = 517.2/541 |
| = 0.956 |
| Satellite | Observation Date | Photon Index | Absorptionaa1023 cm-2 | E.W.bbEquivalent Width in eV | Line Fluxdd10-4 photons cm-2 s-1 | Source Fluxff10-10 ergs cm-2 s-1 in the 210 keV band | Ref |
|---|---|---|---|---|---|---|---|
| OSO-8 | Jul 27Aug 5, 1975 | 1.660.03ccAverage of the 1975 and 1976 data | 1.330.07ccAverage of the 1975 and 1976 data | 12035 ccAverage of the 1975 and 1976 data | 5.71.7eeCalculated from parameters given in reference | 4.660.06 | 1 |
| OSO-8 | Jul 28Aug 8, 1976 | 1.660.03ccAverage of the 1975 and 1976 data | 1.330.07ccAverage of the 1975 and 1976 data | 12035 ccAverage of the 1975 and 1976 data | 5.71.7eeCalculated from parameters given in reference | 2.390.11 | 1 |
| EXOSAT | Feb 13, 1984 | 1.750.08 | 1.640.08 | 16436 | 4.71.0 | 3.40.5 | 2 |
| TENMA | Mar 29Apr 4, 1984 | 1.800.04 | 1.530.03 | 9020 | 5.51.2eeCalculated from parameters given in reference | 7.60.07 | 3 |
| EXOSAT | Jun 8, 1984 | 1.570.10 | 1.400.10 | 20752 | 3.70.9 | 2.60.5 | 2 |
| EXOSAT | Jul 30, 1984 | 1.610.08 | 1.700.09 | 14543 | 3.10.9 | 2.90.4 | 2 |
| EXOSAT | Jun 29, 1985 | 1.700.02 | 1.440.02 | 639 | 5.70.8 | 11.30.3 | 2 |
| GINGA | Mar 89, 1989 | 1.800.02 | 1.61 | 11032 | 5.2 | 2.30.1 | 4 |
| GINGA | Feb 79, 1990 | 1.810.02 | 1.430.03 | 11032 | 5.20.9 | 2.30.1 | 4 |
| ASCA | Aug 14, 1993 | 1.83 | 1.290.40 | 6839 | 3.071.72eeCalculated from parameters given in reference | 1.780.18 | 5 |
| ASCA | Aug 1415, 1993 | 1.960.01 | 1.10 (59%) | 11418 | 3.91 | 1.80.06 | 6 |
| 3.54 (40%) | |||||||
| RXTE | Aug 14, 1996 | 1.860.015 | 0.940.02 | 16225 | 5.370.83 | 3.400.05 | 7 |