The Recent Star Formation in Sextans A
Abstract
We investigate the relationship between the spatial distributions of stellar populations and of neutral and ionized gas in the Local Group dwarf irregular galaxy Sextans A. This galaxy is currently experiencing a burst of localized star formation, the trigger of which is unknown. We have resolved various populations of stars via deep imaging over an area with diameter . We have compared our photometry with theoretical isochrones appropriate for Sextans A, in order to determine the ages of these populations. We have mapped out the history of star formation, most accurately for times 100 Myr. We find that star formation in Sextans A is correlated both in time and space, especially for the most recent (12 Myr) times. The youngest stars in the galaxy are forming primarily along the inner edge of the large H I shell. Somewhat older populations, 50 Myr, are found inward of the youngest stars. Progressively older star formation, from 50–100 Myr, appears to have some spatially coherent structure and is more centrally concentrated. The oldest stars we can accurately sample appear to have approximately a uniform spatial distribution, which extends beyond a surface brightness of mag arcsec-2 (or, a radius ). Although other processes are also possible, our data provides support for a mechanism of supernova-driven expansion of the neutral gas, resulting in cold gas pileup and compression along the H I shell and sequential star formation in recent times.
1 Introduction
Dwarf galaxies, both irregular and spheroidal, are the most numerous galaxies in the Universe. Dwarf irregular galaxies play a key role in our understanding of galactic evolution, especially with the discoveries of faint, blue galaxies in high-redshift imaging surveys, such as the Hubble Deep Field. Since dwarf irregular galaxies are simpler, less-evolved systems, it should be possible to observe short-lived evolutionary properties in nearby systems, which would be more easily destroyed in more massive, complex systems, such as grand design spiral galaxies. Knowledge of the star formation history of dwarf irregular galaxies is of particular importance; Hunter (1997) recently presented a comprehensive discussion of the topic.
Dwarf irregular galaxies show a larger range in star formation rates than do spiral galaxies. Studies of the stellar populations in dwarf irregulars (e.g., Tosi et al. (1991), Greggio et al. (1993), Marconi et al. (1995)) show that most of these galaxies evolve with approximately constant star formation rates, either high or low, interrupted by variations of factors 2–3 in these rates over the past few Gyrs (Hunter 1997). The question, then, is what governs and regulates star formation in dwarf irregulars. A vital clue to answering this question can be found in the relationship between the structure and kinematics of the gas and the history of star formation. The gas can be traced and analyzed by mapping the neutral, molecular, and ionized components, and the star formation history can best be traced by the distributions of resolved stars of various ages.
A program to study the interstellar medium (ISM) in dwarf irregular galaxies was undertaken by D. Puche, D. Westpfahl, and their collaborators, with the goal of determining if the neutral component of the ISM is distributed differently in low-mass systems than in grand design spirals. Puche et al. (1992), Westpfahl & Puche (1994), and Puche & Westpfahl (1994) found that, based on their high-resolution HI data for a number of dwarf galaxies, the neutral gas component shows an unprecedented amount of structure, in the form of shells or bubbles (Heiles (1979), 1984; Tenorio-Tagle & Bodenheimer (1988)). Low rotation velocities for dwarfs means less shear, and thus, longer lifetimes for these large-scale shells. Furthermore, the gas scale-height in dwarf galaxies must be much larger than in high-mass spirals, resulting in a lower gas density and a higher efficiency for making large holes (Heiles (1979)). Also important, of course, is the absence of spiral density waves (see Hunter, Elmegreen, & Baker 1998).
Puche et al. (1992), Puche & Westpfahl (1994), and Westpfahl & Puche (1994) found that these structures are expanding and argued that they surround hot, low-density bubbles, formed as the result of the combined effects of photoionization, stellar winds, and multiple supernovae from sequential formation of massive stars (Cash et al. (1980)). Supernovae would likely dominate all other sources of energy input, although winds from massive stars also substantially contribute (e.g., Leitherer, Robert, & Drissen (1992)). The models of Chevalier (1974) and Koo & McKee (1992a,b) predict that about 100 supernovae exploding in pre-existing wind-blown bubbles would provide about erg to the ISM and can produce shells with radii of hundreds of parsecs, expansion velocities of 10–20 km s-1, and lifetimes of yr, consistent with those observed.
If supernovae are producing expanding bubbles, Puche & Westpfahl have argued, the current star formation in these galaxies should be concentrated near the high-density regions of the expanding H I shell at the edge of the inner bubble. This is consistent with theories of sequential star formation (e.g., Gerola & Seiden (1978); Gerola, Seiden, & Schulman (1980)), in which the compression associated with the shell triggers the star formation process. If the supernova-driven scenario holds, then we would expect star formation episodes to be not only correlated in age, but also in spatial distribution, along the H I shell structures.
Limited, low-resolution optical data tend to suggest that this scenario is possibly taking place: H appears concentrated on the edges of the nearly circular H I shells in Holmberg II (Puche et al. (1992); Hodge, Strobel, & Kennicutt 1994b ), Holmberg I (Westpfahl & Puche (1994)), and IC 2574 (Martimbeau, Carignan, & Roy (1994)). Another, more local, example where this also may be occurring is Constellation III and the supershell LMC 4 in the LMC (Dopita, Mathewson, & Ford (1985), Grebel & Brandner (1998); although see Reid, Mould, & Thompson (1987), Braun et al. (1997), Olsen et al. (1997)). Additionally, Puche et al. (1992) claim that broad-band imaging shows the possible presence of stars or clusters at the centers of some of the largest shells in Holmberg II, which could be the populations, associated with the supernovae progenitors, which remain long after the explosions.
One of the galaxies Puche & Westpfahl (1994) sampled was Sextans A (DDO 75, UGC 205, A100804), a low surface brightness dwarf irregular galaxy with angular diameter of only (Ables (1971); Tully (1988)) and an oddly square, or, more appropriately, diamond shape. A large number of resolved stars can be seen on a number of published ground-based (and space-based) images of the galaxy. The galaxy is seen nearly face-on (inclination , Skillman et al. (1988); to , Graham & Westpfahl (1998), in preparation). A recent estimate of the distance to Sextans A by Sakai, Madore, & Freedman (1996; SMF, hereafter), based on the tip of the red giant branch (TRGB) brightness, is 1.42 Mpc (), placing it near the edge of the Local Group. At this distance, the angular diameter corresponds to a linear diameter of only 1.8 kpc for the galaxy. The galaxy has and (somewhat bluer than the mean for Magellanic irregulars; Ables (1971)); at the TRGB distance modulus, . The morphology of Sextans A in H I had been initially studied by Skillman et al. (1988). Skillman et al. estimate a gas mass of and a total mass of .
From higher resolution and greater sensitivity maps, Puche & Westpfahl (1994) found that Sextans A looks similar in H I morphology to other small dwarf irregulars, such as Holmberg I and M81dwA (Westpfahl & Puche (1994)), in that one H I hole appears to dominate the overall structure, although Sextans A is a slightly faster rotator than these other small dwarfs ( km s-1 for Sextans A, compared to 15 km s-1 for Ho I and 5 km s-1 for M81dwA; Puche & Westpfahl (1994)), consistent with the central large cavity appearing to have undergone some shearing and twisting.
This galaxy has also been the object of previous intense optical study, both from the ground and, recently, from space. Its resolved stellar populations have been observed in a number of different bands. Sandage & Carlson (1982, 1985; hereafter, SC82 and SC85, respectively; SC85 revises the photometry presented in SC82) published an early photometric study, consisting of photographic ; Hoessel, Schommer, & Danielson (1983; hereafter, HSD) obtained CCD Gunn-Thuan photometry; Walker (1987; hereafter, W87) published CCD photometry of bright stars; Aparicio et al. (1987; hereafter, A87) presented deep CCD photometry; and SMF recently analyzed deep CCD photometry. Based on their deep imaging data, A87 presented a history of recent star formation in Sextans A, but they considered the star formation over only quite broad regions of the galaxy. SMF, although their imaging was quite deep, did not address in depth the star formation in Sextans A, dealing primarily with their distance estimate.
Recently, Dohm-Palmer et al. (1997a,b) presented reports on photometric results based on deep Hubble Space Telescope (HST) imaging. Dohm-Palmer et al. (1997b) provide a detailed description of the star formation history in Sextans A over the last 1 Gyr, and illustrated the correlation of the history both in time and in space. Their results are unhampered by the problems of crowding and blending which beset ground-based studies, and the number of stars that they can statistically analyze is truly formidable.
Based on their results, Dohm-Palmer et al. (1997b) conclude that from 100 – 600 Myr ago, the star formation rate (2000 Myr-1 kpc-2) was about six times larger than the rate (310 Myr-1 kpc-2) averaged over the lifetime of the galaxy, and that since about 80–100 Myr ago, the rate has become remarkably higher (by a factor 20, at 5000 Myr-1 kpc-2) and more densely concentrated than in the past, suggesting that some unusual event has occurred in the past 100 Myr to trigger the recent star formation. (Their movie of star formation in Dohm-Palmer et al. (1998) seems to indicate that the trigger might have begun as early as 350 Myr.)
Dohm-Palmer et al. speculate on possible scenarios for this mysterious event, including a tidal interaction with neighboring Sextans B; however, they point out that these two galaxies may be separated by nearly 300 kpc, a distance over which the dynamical effects would be minimal. The trigger could also be the recent onset of a bar potential, which Skillman et al. (1988) suggest possibly exists in Sextans A, based on their data; although Puche disagrees, Westpfahl (private communication) states that the gas kinematics based on their recent H I data could also indicate the presence of a bar. Graham & Westpfahl (1998) suggest a possible merger or accretion event. Finally, the supernova-induced star formation mechanism could be the trigger for recent star formation. Combinations of one or more of these scenarios is, of course, also possible.
In this paper, we present deep imaging of Sextans A, in which a large number of stars are resolved. Through our ground-based five-band imaging we have sampled nearly the entire main body of the optical galaxy, and therefore we can more completely describe the temporal and spatial history of star formation over a large area, particularly for the last 100 Myr, and (with far less certainty) back to about 1 Gyr. Furthermore, we examine the correlation of the recent star formation history with both the neutral H I and the ionized gas components.
2 The Data
2.1 Observations and Reductions
The observations were conducted at the Kitt Peak National Observatory (KPNO) 2.1-m telescope in on 1994 Feb 11 UT, as part of a program to image several dwarf irregular galaxies showing significant structure in H I. The KPNO “T1KA” CCD was used in direct imaging mode at ; the pixel scale was , resulting in a field size of . An area of Sextans A with diameter could therefore be imaged on the chip. All images exhibited large numbers of resolved stars in the galaxy. Total exposures in each band were divided into three separate exposures, dithering the telescope slightly between exposures to reduce pixel-to-pixel and position-dependent effects on stellar profiles and magnitudes. Total exposure times were 1800 sec in each of the five filters. Unfortunately, although the seeing was good (), the night was not photometric (nor was the entire run). Figure 1 shows a three-color composite image of the galaxy.
Observations were subsequently made on 1995 April 24 UT using the Lick Observatory Nickel 1.0-m telescope in , under photometric conditions, for the purpose of calibration. The Nickel telescope imaging system, consisting of an Orbit CCD (binned ), with pixel scale and field size , however, has essentially no response in . Fortunately, a service observing campaign (1996 April 1–5 UT) was undertaken during bright time at the KPNO 0.9-m telescope by Mr. R. Young Shuping, to provide calibration observations for previous KPNO imaging programs conducted under non-photometric conditions. Shuping obtained images for us. Shorter (600–900 sec) exposures of Sextans A were made during both sets of calibration observations.
Additionally, we obtained H+[N II] and -band images of Sextans A at the old KPNO “No. 1” 0.9-m telescope in 1989 May 31 UT. These observations employed the old “RCA3” chip, with pixel scale and field size . Three individual images through a narrow-band filter with central wavelength 6563 Å (bandpass 75 Å) were made. The -band image taken during that observing run had an exposure time of 300 sec.
The usual bias and flatfield images were obtained during all observing runs. All image processing was performed using IRAF111IRAF (Image Reduction and Analysis Facility) is distributed by the National Optical Astronomy Observatories, which are operated by the Association of Universities for Research in Astronomy, Inc., under cooperative agreement with the National Science Foundation.. As mentioned above, the separate 2.1-m exposures of Sextans A were combined into a single total image, using cosmic-ray rejection, for each filter. Additionally, the three H+[N II] images were combined into a single 1500-sec image.
A continuum-subtracted H+[N II] image was produced using the combined narrow-band “on-line” observation and the broad-band observation, where was employed as the “off-line” filter, assuming that H+[N II] are the only emission lines dominating the bandpass (see Waller (1990)). The scale factor for the subtraction was derived from the intrumental photometry of the field stars in common between the two sets of images. The subtracted image was not flux calibrated.
2.2 Photometry Methods
The DAOPHOT and ALLSTAR (Stetson (1987); Stetson, Davis, & Crabtree (1990)) routines in IRAF were used to derive the magnitudes of the resolved stars on all the images made of Sextans A (including those made with the KPNO 2.1-m, the Lick 1-m, and the KPNO 0.9-m telescopes). These routines perform multiple fittings of a semi-empirical point spread function (PSF) to the individual stellar profiles. The PSF was established by assuming a Moffat analytical function, plus a table of residuals, using a number (30) of well-shaped stars on each image. Figure 2 shows the residuals of the fitting, , given by ALLSTAR for all stars in each band on the images made at the KPNO 2.1-m telescope (after elimination of probable foreground stars, obviously blended stars, and erroneous detections; see §3 below). These values are representative of the internal errors in the photometry presented in this paper.
Our Lick 1-m and Shuping’s KPNO 0.9-m telescope observations not only consisted of images of Sextans A, but also images of a number of standard star fields, spanning a wide range of colors, from Landolt (1992). The standard star instrumental magnitudes were determined through large (radius 7″) synthetic apertures, which significantly included the wings of the stellar profiles, and sky annuli with radii larger than the apertures. The photometric transformations to the absolute system were computed using these instrumental magnitudes.
The ALLSTAR PSF-fitting magnitudes for stars in Sextans A imaged during the two sets of calibration observations were corrected to synthetic aperture magnitudes, using the aperture-curves-of-growth method (Stetson 1990). However, this method was only reliable for the 15 brightest stars (or fewer) on these shorter-exposure images of the galaxy in each band. The ALLSTAR magnitudes from the KPNO 2.1-m images were, of course, not aperture-corrected, since these observations were not photometric, but had to be “bootstrapped” to the absolute system using the observations of Sextans A during the calibration runs.
2.3 Transformation to the Standard Johnson-Cousins System
For the Lick calibration run, an adequate number (30) of standard stars were observed over a large range in airmass. The aperture magnitudes of the standard stars were then used to determine the atmospheric extinction in each band and the transformation to Johnson-Cousins magnitudes. The transformation equations, derived using the PHOTCAL tasks in IRAF, for the Lick Nickel 1-m run are
| (1) |
| (2) |
| (3) |
| (4) |
where the lower-case letters represent the aperture (instrumental) magnitudes and the upper-case letters represent the true Johnson-Cousins magnitudes, and is the airmass of the observation. The formal errors in the coefficients are also given.
Although standard stars over a large range of color were observed during Shuping’s photometric night on the KPNO 0.9-m, a smaller number (17) of stars were observed without adequately sampling over airmass. As a result we had difficulty achieving a reasonable solution for the photometric coefficients, while allowing them all to be free variables. We therefore chose to fix the airmass corrections to the nominal values appropriate for KPNO, as given in the “Direct Imaging Manual for KPNO” (P. Massey et al. 1997). The transformation equations are then
| (5) |
| (6) |
| (7) |
| (8) |
| (9) |
where the symbols are as above. The formal are also given for those coefficients treated as free parameters.
The aperture-corrected ALLSTAR magnitudes for the stars resolved on the images of Sextans A made during the Lick 1-m and KPNO 0.9-m runs were then transformed to the Johnson-Cousins system using the PHOTCAL routines within IRAF. We compared the final photometry results from the Lick 1-m and KPNO 0.9-m observations, for stars in Sextans A in common between the two sets (we were limited to a comparison for only the brightest stars, i.e., those with ) and found that the magnitudes and colors agreed between the two sets to the following degree: [], [], [], and [] (the sense of the sign is “KPNO 0.9-mLick 1-m”). One can see that the agreement is quite good. We therefore used the photometry from the Lick run to transform the ALLSTAR magnitudes obtained from the deep KPNO 2.1-m imaging in .
We had no choice for ; the agreement between the calibration obtained from the Lick 1-m and KPNO 0.9-m imaging provided us with confidence that the calibration done on the KPNO 0.9-m was reasonable. We therefore transformed the photometry from the KPNO 2.1-m images using the photometry from the KPNO 0.9-m image.
2.4 Comparison with Previous Photometry
In any study of this kind, it is always appropriate to compare the new photometry with older published photometry when available. Fortunately, as mentioned above, Sextans A has been the subject of a good number of recent optical studies. Here, we can compare subsets of our photometry with the results from SC82, SC85, HSD (their magnitudes were transformed into Johnson magnitudes, via the transformations in Hoessel & Melnick 1980 and Wade et al. 1979), W87, A87, and SMF. (Dohm-Palmer et al. 1997a,b present photometry using HST, but they do not provide their data in tabular form, so we do not make a comparison with their photometry.)
The stars which have been most used as the basis of comparison in all these previous studies are the bright stars listed in SC82. In Table 1 we list the mean differences of our measurements for the various colors for the SC82 stars with the measurements from these other studies. In Figure 3 we show a comparison of our magnitudes and colors for the SC82 stars with those obtained by the other studies.
One can see that our magnitudes are in very good agreement with those of SMF, A87, and W87, but differ substantially from SC85 and HSD, the former likely due to the zero-point problems associated with the photographic photometry, and the latter likely due to the uncertainty in the transformation from the Gunn-Thuan system to the Johnson system, as noted by SMF. Our colors agree very well with those in W87, but less so with those from the other studies. Our colors are in reasonably good agreement with those from A87, but in the case for both and , we point out the large amount of scatter for even the brightest stars studied in A87.
One can see very good agreement of our colors with those from SMF, with an offset of between our colors and theirs (although the rms in the comparison is roughly equivalent to this possible offset; additionally, we notice a similar offset between the magnitudes from SMF and those from Dohm Palmer et al. 1997a in the latter’s Figure 7 for ). Finally, we compare our (Cousins system) colors with the (Johnson system) colors from HSD. The offset of agrees with the zero-point of 0.12 in the transformation from the Johnson to the Kron-Cousins system derived using asymptotic giant branch stars by Costa & Frogel (1996).
In all, we believe the agreement of our photometry with previous photometry to be quite satisfactory.
2.5 Transformation to Absolute Coordinates
Absolute star positions were derived by converting the pixel centroids of the stars on our KPNO 2.1-m images from ALLSTAR into absolute coordinates using the Guide Star Astrometric Program (GASP) software in STSDAS/IRAF and the Digitized Sky Survey222The digitizations of Schmidt Sky Survey plates have been made by the Space Telescope Science Institute (STScI) under contract NAS5-26555 with the National Aeronautics and Space Administration and US Government grant NAG W-2166. The images of these surveys are based on photographic data obtained using the Oschin Schmidt Telescope on Palomar Mountain and the UK Schmidt Telescope for the Palomar Observatory Sky Atlas (POSS-I), made by the California Institute of Technology with grants from the National Geographic Society. image of the Sextans A field obtained from the Canadian Astronomy Data Center (CADC), from which absolute coordinates for stars on the Palomar Observatory Sky Survey can be measured. The accuracy obtained in these absolute positions by this technique (–) is adequate for our comparison with the H I radio map, given the relatively lower resolution of the radio data (see §4).
3 Analysis of the Photometry
We present here a brief description of our photometric results. We have removed obvious foreground stars from our star list, e.g., the notoriously bright red foreground star in the northeast quadrant of Sextans A, and those stars that A87 and SC82 previously identified as foreground stars (e.g., those SC82 measured as proper motion stars). These are essentially all stars with .
We can estimate how many foreground stars fainter than this should be in our field, from the Ratnatunga & Bahcall (1985) model for the galactic coordinates of Sextans A (we interpolate the model appropriate for Sextans A from the nearby fields including the galaxies Pal 3 and Leo I). In Table 2 we list, for our 27 arcmin2 field, the predicted number of stars in three color bins and four magnitude bins, along with the estimated number of actual stars found within these bins. Of course, without identification spectra for individual stars, we have no means of eliminating possible foreground interlopers from our star list, but the comparison in Table 2 should be kept in mind throughout the paper.
Finally, we have also used our color-color diagrams (§3.2) to isolate and remove stars from our list which clearly have grossly discordant colors, indicating possible blends, unresolved nebulosity, or other photometric errors. We have eliminated erroneous detections along the two bad rows on the combined images and within the saturated image of the aforementioned bright red foreground star; we have also removed stars that are too close to the edge of the CCD in any band to provide reliable photometry.
We arrive at 2525 stars detected in and at least one other band. For space reasons, we do not list the magnitudes and colors for all the stars here. An electronic tabulation of magnitudes, colors, and absolute positions of the stars can be obtained courtesy of the CDS.
3.1 Luminosity Functions
We can derive a luminosity function for the stars in the galaxy and compare it to those for other dwarf irregulars. In Figure 4 we show the global differential luminosity function for all detected stars in each of the bands. Crowding and blending of stars in our images limit the depth and accuracy of the photometry we have obtained. This can be represented by the completeness of our photometry. One can see that incompleteness significantly affects the photometry in each of the bands at a given magnitude. Our photometry is most complete in the -band, next most complete in , then , , and, finally, . The photometry is seriously affected by incompleteness at , , , , and .
We also derive the luminosity function for only the main sequence stars. Following the recommendation by Freedman (1985), we separate these stars from the evolved “blue loop” supergiants (which are indistinguishable from the main sequence stars in the blue plume on the CMD in Figure 6) by selecting those stars with (we use a similar criterion in in §3.3 to distinguish the hot main sequence stars). In Figure 4 we show the differential LF for only those 241 stars (filled circles). A least-squares fit to the data for the main sequence stars brighter than (fainter than which incompleteness clearly affects our statistics) results in a slope, .
This is consistent with the slope for other dwarf irregulars, such as WLM, Sextans B, and NGC 6822 (see, e.g., Tosi et al. (1991); Greggio et al. (1993); Marconi et al. (1995)), and implies that Sextans A has a star formation rate and initial mass function that is not unlike other dwarf irregulars that have been studied so far. As pointed out by Hunter & Plummer (1996), Sextans A currently has a star formation rate ( yr-1), when normalized to its linear scale, which is typical of other dwarf irregulars (see also Hunter & Gallagher (1986)), being neither very low nor excessively high.
Interestingly enough, similar slopes are found for the luminosity functions for all stars in each of the bands, for which the photometry is complete (0.44, for all stars in ; 0.44, for ; 0.53, for ; 0.48, for , and 0.53, for ). This implies that the mass function averaged over more than 1 Gyr has been relatively constant in Sextans A. We have also isolated just those stars along the putative bar in the galaxy; we find that the slope of the luminosity function for these stars in is 0.51, similar to the slopes in and other bands for all stars in Sextans A.
3.2 Color-Color Diagrams
In Figure 5 we present the color-color diagrams for Sextans A. The solid line on each diagram shows the location of the (unreddened) main sequence, giant and supergiant branches, based on theoretical models (see §3.4). We have indicated on these color-color diagrams the direction of the reddening vector. We also show representative uncertainties in the observed colors. On the () diagram we can see two clumps of stars, the bluer main sequence stars and the somewhat redder blue supergiants. On the () diagram, we again see a blue clump of stars, which is a mixture of main sequence and supergiants, and a smaller clumping of red supergiant stars. The general agreement between the model tracks and the observed color distributions indicates that the amount of reddening to and within the galaxy must be generally small (see §3.3). But, some reddening is clearly necessary, based on these diagrams, on the amount of Galactic foreground reddening, and on the results of other investigators from colors of individual stars (e.g., SMF). The reddening also appears somewhat variable.
3.3 Color-Magnitude Diagrams
The most direct information on the stellar populations and relative star formation histories in galaxies can be obtained from the analysis of color-magnitude diagrams (CMDs) based on deep photometry of the resolved populations. In this paper we have observed at five optical bands: our bluest colors can very adequately trace out the youngest, hottest stars in the galaxy, while, as Aparicio & Gallart (1995) have demonstrated in their study of the Pegasus dwarf galaxy, photometry in red colors is also necessary, to derive information about stars of all ages.
In Figure 6 we present the CMDs for Sextans A in the various colors based on our photometry. What is immediately evident from examining all of the CMDs, as has been found in previous studies of Sextans A, is the rich and various array of populations of different ages, from main sequence stars to red supergiants to asymptotic giant branch (AGB) stars. Such populations have been identified in this and other dwarf galaxies from the ground, but never before with this color baseline.
The practical detection limit for our photometry is . In our deep ground-based images, a diffuse background of faint stars in the galaxy is also discernible below this limit.
On the and CMDs one can clearly see the blue sequence, or “plume,” of stars, with (). The greatest limitation to separating out the various populations in Sextans A based on our imaging is, of course, crowding and blending. Despite this limitation in resolution, however, our CMD clearly shows that this blue plume separates into the main sequence (with ), down to about spectral type B1 (), and the evolved “blue loop” supergiant stars, with , which are burning helium (He) at their cores, although some small contamination exists from main-sequence turn-off stars. (This blue loop is not as evident in our and CMDs, due in part to the above-mentioned crowding and blending of main sequence and evolved stars on the CCD images, but also to the fact that affords a much better temperature resolution for luminous blue stars and therefore assists in overcoming the degeneracy in the blue plume.)
We therefore have been able to detect the brighter () blue loop population based on our ground-based data, even in a galaxy as distant as Sextans A through deep imaging.
On the blue CMDs one notices the very bright star with , , and ; A87 point to it likely being a supergiant member of Sextans A, primarily due to its location in the bright blue clustering of stars in the southeast. The PSF for this object does appear stellar, so it is not likely to be a blend. For this star for a distance modulus of 25.8 (see §3.4). It appears therefore to be 2 mag brighter than the blue straggler binary stars found in the young SMC cluster NGC 330 (Grebel, Roberts, & Brandner 1996). It is more likely to be a luminous blue variable star, similar to the one found by Drissen, Roy, & Robert (1997) in NGC 2366. This star clearly deserves more attention.
One can also see on the CMD, and, more so, with the addition of the band in the CMD, that the number of blue loop stars is relatively larger than the number of red supergiants, in a “red plume” of stars with () and . More blue supergiants than red supergiants may exist in this galaxy. This is consistent with the fact that, at low metallicity, stars spend more time as blue supergiants than red supergiants during their He core-burning phase (Bertelli et al. (1994)).
On the and CMDs one, again, can see the conspicuous red “plume” of stars, at () and , with two or three conspicuous clumps of red supergiants, as noted by SMF, at , 20.6, and 19.8. Also visible is the broad clump of red stars, at (), , which is the top of what Aparicio & Gallart (1995) refer to as the “red tangle” of RGB stars, old and intermediate-age AGB stars, and intermediate-age blue-loop stars. The TRGB, although likely contaminated by intermediate-age AGB stars, is at and (SMF).
The stars fainter than , with () are what Aparicio & Gallart (1995) refer to as the “red tails” of intermediate-age and old AGB stars. Aparicio & Gallart point out that the “length” of the “tail” (i.e., how red this feature extends on the CMD) is a function of metallicity; the longer the tail, the greater the metallicity. The observed tails for Sextans A do not extend as red in color as those on the CMDs for, e.g., the Pegasus dwarf galaxy (Aparicio & Gallart (1995)), consistent with the metallicity difference between Sextans A and Pegasus (Skillman, Bomans, & Kobulnicky 1997; Aparicio, Gallart, & Bertelli 1997).
Of particular curiosity are the very bright, red stars seen on the red CMDs. Although they appear to be especially, and possibly anomalously, bright, to be members of Sextans A, we have no particular evidence to the contrary, e.g., they are not among the proper motion stars in SC82. All but one of the stars is in or near a region of recent star formation. Short of having spectra for these stars, we consider them to be members of the galaxy.
We also show on all CMDs, highlighted with open circles, the magnitudes and colors of the known Cepheids from Piotto, Capaccioli, & Pellegrini (1994).
3.4 Stellar Population Ages
On the CMDs in Figure 6, we have compared our photometry with a series of theoretical isochrones calculated by the Padova group (see Bertelli et al. (1994) and references therein), which we use to estimate the ages of the stellar populations in Sextans A. We have chosen those isochrones computed with a metallicity , which is consistent with that inferred from the oxygen abundance for this galaxy (Skillman, Kennicutt, & Hodge (1989)). We do not extensively sample the oldest populations, where consideration of significantly lower metallicity would be important. We have found that isochrones of higher metallicity do not match the positions of the stars in color and magnitude nearly as well as those of the chosen metallicity.
Before further comparison with the isochrones is made, in order to estimate ages for the various populations, it is first necessary to choose a distance to the galaxy and to consider the amount of reddening that the observed stars are experiencing. We therefore adjust the isochrones on the CMDs accordingly.
First, we have adopted a distance modulus to Sextans A which is a compromise between the modulus derived from the TRGB and Cepheid brightness methods, given by SMF, i.e., mag (which corresponds to a distance of 1.44 Mpc). Second, we have assumed a reddening for the galaxy of . The amount of Galactic reddening is (Burstein & Heiles 1984), but, as SMF point out, is likely appropriate for the main body of the galaxy, where most of the young stars and gas are found (SMF find a higher for the older red giant population in the galaxy). So, we have assumed this value, which, assuming a normal reddening law, i.e., , corresponds to . Note that this is somewhat larger than the reddening assumed by Dohm-Palmer et al. (1997a,b), which is essentially only due to the Galactic component. Based on our reddening assumption, we follow Cardelli, Clayton, & Mathis (1989), in deriving the extinction for the other bands, and assume that .
From examining all the CMDs it is evident, regardless of their exact ages, that a number of stellar populations of various ages coexist in Sextans A, as has been noted in previous studies (e.g., A87; Dohm-Palmer et al. 1997b). The star formation does not seem to have been continuous, but instead appears to have occurred more in bursts or episodes. We do not try to execute a thorough and exact analysis of the population ages through more sophisticated means, such as synthetic CMDs (e.g., Aparicio et al. (1996)). Based on our more cursory analysis with the theoretical isochrones, it can be seen from the CMDs constructed from the , , and bands that the blue plume of stars consists of several young populations, from very young (only a few Myr) to significantly older, with ages Myr. Clear gaps in stellar age within this time range exist, as best seen in the redder populations (i.e., with ).
The redder CMDs show three noticeable clumps of red supergiants, with ages 40 Myr, 60 Myr, and 80 Myr. The number of red supergiants both older and younger than these ages appears to be significantly smaller. These stars must have formed in three different bursts of recent star formation. The clump of RGB stars (red tangle), for which we can resolve only the top, appears to correspond to an age of Myr. The oldest populations we can resolve (the diffuse quantity of red stars with , comprising the various red AGB tails) appear to have ages from 0.2–0.3 Gyr to several Gyr, although we can only probe these populations with accuracy to ages 1–2 Gyr. Our photometry is not deep or complete enough to resolve stars older than this.
From our CMDs we find that the Cepheids in Sextans A have ages 40 Myr and appear to be younger than 100 Myr.
4 Spatial Distribution of Stellar Populations
First, we examine the spatial distribution of the youngest population of stars in Sextans A. We consider stars with ages Myr. Dohm-Palmer et al. (1997b; see their Figure 13) have found that the star formation rate, beginning 50 Myr ago, has been a factor of larger than the time-averaged rate for the galaxy, and therefore we illustrate the extent of the most vigorous star formation over the last 1 Gyr. In Figure 7 we represent on the -band image of the galaxy four young populations of stars: 1) those stars with and , which are the youngest, bluest main sequence stars (pluses); 2) those young stars with magnitudes and colors, particularly in , which make them likely main sequence turn-off stars and supergiants with ages Myr, including the very bright blue and red supergiant stars mentioned in §3 (crosses); 3) those blue He-burning stars (with ) with , i.e., those with ages Myr (circles); and, 4) the corresponding red He-burning stars, seen on the CMD, with and (squares).
As Dohm-Palmer et al. (1997b) emphasize, the blue He-burning stars follow a somewhat redder, nearly vertical track parallel to the main sequence and are about two magnitudes brighter than the corresponding main sequence turnoff stars of the same age. The position in magnitude of a blue He-burning star on the CMD is determined by the star’s mass and, therefore, its age. The blue He-burning stars are clearly very useful age probes for stellar populations, back to about 600 Myr in Sextans A. This is only true at these low metallicities for blue He-burning stars with ages older than 20 Myr, or for Sextans A, since the He-burning phase for stars with is not well-understood (Chiosi, Bertelli, & Bressan (1992); Dohm-Palmer et al. 1997b ).
One immediately can see that the recent star formation over the last 50 Myr has occurred in specific regions in Sextans A and is not uniformly distributed. In particular, the very young, hot, blue main sequence stars are primarily found near surface brightness mag arcsec-2, or a radius (Ables (1971)). As pointed out previously by HSD, A87, and others, these hot stars are primarily found in the bright clusters in the southeast and to the west. But they are not exclusively in just these two locations. Another significant clustering of these stars is to the northwest, and a small cluster is to the northeast. A smaller number of these stars are found within the main optical body of the galaxy. Large areas of the galaxy clearly exist where no recent star formation has taken place.
What is most intriguing is that some of these stars are also found beyond mag arcsec-2 (), in the northeast and the southwest. Based on Table 2, we consider the likelihood of foreground stars in such numbers superposed on this small field to be very small. We conclude that recent star formation appears to even be occurring beyond the main optical surface brightness of Sextans A. Massive stars may form seemingly “isolated;” though this does not occur often, it is not unusual (e.g., Massey, Johnson, & DeGioia-Eastwood 1995; Massey et al. 1995).
The bright, young supergiants, not surprisingly, have a very similar spatial distribution to the very young main sequence stars. (One supergiant star can be seen in the extreme southeast, well beyond ; it is possible that this is a foreground star, based on Table 2, although its magnitude and color [, , ] are consistent with other bright supergiants seen within this radius.) But these stars, as plotted on Figure 7, have ages up to 12 Myr, and some are therefore older than the youngest population represented (the hot main sequence). Some of these supergiants are seen in regions of the galaxy not directly associated with the youngest stars, and therefore likely trace out regions of somewhat older star formation.
The evolved He-burning stars, both blue and red, with ages up to 50 Myr are also found near , but, particularly in the west, their spatial distribution is appreciably inward, located more toward the galaxy’s optical center, extending from the northwest down to the southwest. Many of these stars are also found in the bright cluster of stars in the southeast, indicating that star formation in that region has been occurring for at least 50 Myr. The brighter stars with ages 50 Myr in this cluster appear to form a “ring,” with radius of 300 pc. Several of these blue-loop stars are also found in the smaller cluster of stars in the northwest. But, most noticeably, only one bright blue He-burning star is found in the galaxy’s second-largest star-forming region, in the west, and this star, from its position on the CMDs (with , , and ), is possibly as young as Myr. This region of star formation, which Dohm-Palmer et al. (1997a, b) could not study, is clearly one of the youngest in the galaxy, along with the small clustering of hot stars in the northeast. Star formation in these regions could be as recent as Myr.
In summary, the recent massive star formation over the last 50 Myr, which has been so pronounced in Sextans A, has been confined toward the edge of the main body of the galaxy, near mag arcsec-2, and may have progressed even beyond this point. In particular, in the west, it has been progressing outward from more central regions. Much of the recent star formation has been concentrated in the large clustering of stars in the southeast, and to the northwest. The youngest large concentration of star formation has been in the clustering in the west. Noticeable large holes can be seen in the distribution of young stars. No appreciable recent star formation has occurred at the optical center of the galaxy.
Next, we examine the spatial distribution of older populations in Sextans A. In Figure 8 we again show the image of the galaxy. Shown on this figure are two populations of stars: 1) those blue He-burning stars with ages –100 Myr, with to (the faintest blue He-burning stars that we can confidently resolve; squares); and, 2) the corresponding red He-burning stars with , with ages to Myr (circles).
What is most noticeable about the distribution of the stars with ages 50–100 Myr is the more central concentration than is the case for the younger populations. Some structure and clustering also appears in the distribution of these older stars, which does not appears to be random. We have used a large age bin (50 Myr wide) for these stars, so small timescale details in their distribution as a function of age are lost. Nonetheless, the distribution of this population illustrates the advanced stage of dissolution of parent OB associations. Regions where these stars are missing are noticeable in the figure. Specifically, relatively fewer of the He-burning stars with ages Myr are found at the sites of the most recent star formation (the bright blue clusters) to the east and west. In fact, no such stars are seen in the cluster to the west, again, indicating that this region is very young. Additionally, the older He-burning stars near the large cluster of young stars in the southeast tend to be to the southwest edge of the cluster, indicating a possible age gradient in this large star complex.
The He-burning stars appear to mostly extend from far north down to far south in the galaxy, with apparent clustering toward the galaxy’s optical center. Some of these stars appear along a putative bar (see, e.g., Ables (1971); A87), although they are clearly not exclusive to that region, if it exists. (Ables 1971 describes this bar-like feature as being seen in the isophotes with position angle 1415; Skillman et al. 1988 describe a possible H I bar with position angle 105°.) The integrated color of the bar feature, which appears particularly in the isophotal photometry, is , excluding the star complex in the southeast (Ables (1971)), and, thus, should be a mix of both blue and red stars. These evolved He-burning stars should therefore comprise the brighter populations along the bar, although we do not consider the optical bar structure to be entirely obvious from the distribution of these populations in Figure 8. A few of the red He-burning stars are also visible beyond the main optical galaxy; although their colors and magnitudes are quite consistent with those of other similar stars within the galaxy, these could well be foreground stars. In summary, the distribution of these older stars is clearly different from that for the younger stars.
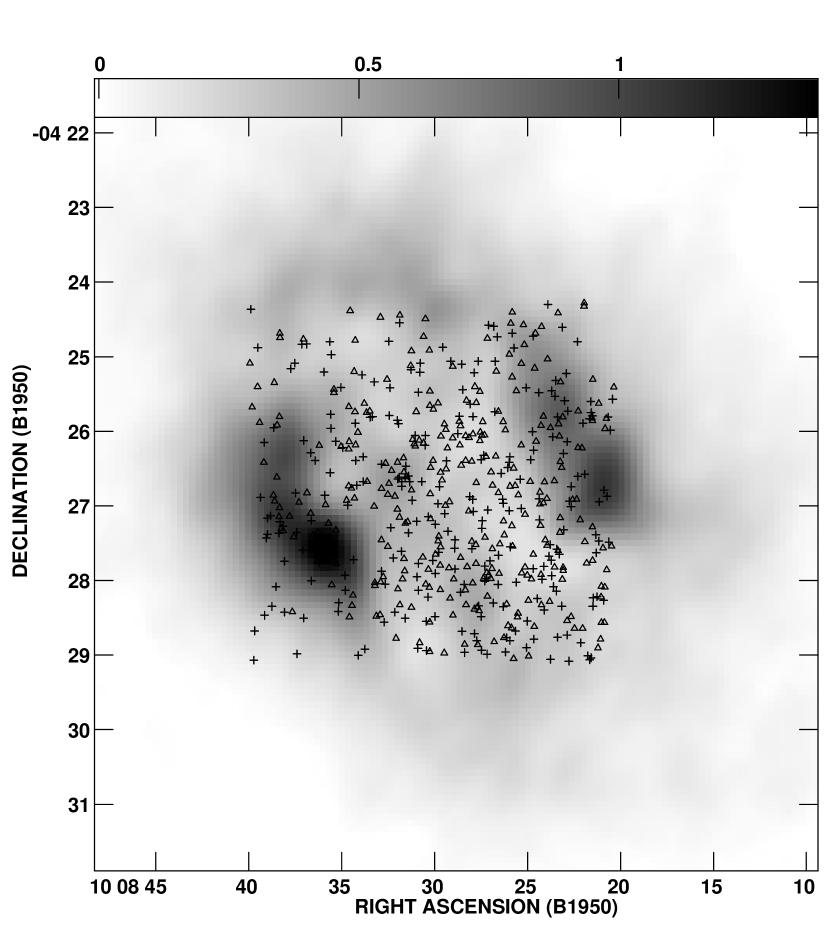
Finally, in Figure 9 we once again show the image with two older populations: 1) RGB stars, at roughly and , and some AGB stars in the red tangle, with ages between 100 and 600 Myr (crosses); and, 2) those RGB stars and AGB stars with ages 600 Myr (the older red tangle and red tail stars with ages possibly up to 3 Gyr; pluses). We chose the age ranges of 100–600 Myr and Myr, since Dohm-Palmer et al. (1997b) have found that the star formation rate between about 100–600 Myr ago was a factor of 6 higher than the time-averaged rate, likely declining for ages older than this range; this is illustrated in their Figure 14.
No particular pattern or structure is obvious in the spatial distribution for the RGB stars. However, few of these stars are seen in or near the youngest star formation regions. Again, we are using a large age bin to increase our statistics, and therefore we cannot describe small timescale variations in the distribution. These stars have likely dispersed from their birthplaces over an area of diameter 5′. Notice the approximate similarity of the distribution of RGB stars that we find and that found by Dohm-Palmer et al. (1997b; their Figure 16) for their limited field-of-view, especially the possible clustering of RGB stars just east of the center.
One interesting aspect of the distributions for these stars is that they appear to also be found outside mag arcsec-2. Again, given Table 2, one might suspect that 15–30% of these stars are merely in the foreground. But, again, the colors and magnitudes for the stars found outside the main body of the galaxy are consistent with those red giants well within the galaxy, and a large fraction therefore could be members of Sextans A. These stars may comprise a more extended halo-like structure, which is also found for a number of dwarf irregular galaxies (e.g., Minniti & Zijlstra 1996).
The older RGB and AGB stars with ages 600 Myr are also uniformly distributed across and beyond the main body of the optical galaxy, with no apparent clustering or structure. Again, the stars seen beyond mag arcsec-2 have colors and magnitudes consistent with those within the galaxy, but probably up to about one-third of these stars could be in the foreground. The quite homogeneous distribution is what one would expect for an older halo field population. Hunter & Plummer (1996) point out that star formation in Sextans A must once have occurred further out in the galaxy than is seen today, given the size of the Holmberg radius. They also point out that in the southwest they can trace faint stars as far out as 1.5 kpc from the center.
What we find for stars older than 100 Myr is consistent with the picture developed by Dohm-Palmer et al. (1997b, 1998), in which star formation, at a significantly lower rate than the current rate, percolates in coherent regions and propagates to other neighboring regions within their field-of-study during the time range of 100–600 Myr. The rate is likely lower for ages older than 600 Myr, but the pattern and propagation of star formation appear from our data to have been similar in nature. In particular, Dohm-Palmer et al. (1998) show that from 300–400 Myr, star formation migrated from the northeast to the center, peaking there around 350 Myr ago. Our results seem to imply that this centrally concentrated star formation continued to peak from 100 Myr.
5 Relationship of the Stars to the Gas
We now examine the spatial distribution of the various stellar populations to that of the gas in Sextans A. We can consider only the ionized and neutral components of the gas in the galaxy, since molecular gas has not been detected (Ohta et al. 1993 found only a low upper limit for the luminosity of CO).
5.1 Ionized Hydrogen
First, we examine the distribution of blue stars relative to the ionized gas, as seen from our H+[N II] image. In Figure 10 we show our H map, which is qualitatively similar to that in Aparicio & Rodriguez-Ulloa (1992) and Hodge, Kennicutt, & Strobel (1994a). All the H emission appears to be non-stellar. The H II regions are distributed in two arcs separated by nearly 4′ (with the brightest patches of emission in the southeast). Fainter emission can also be seen. Our H image, although continuum-subtracted, is not flux-calibrated, but comparing our map with that in Hodge et al. (1994a), we estimate that our detection limit for H II regions is erg cm-2 s-1, which, at a distance of 1.4 Mpc, corresponds to a luminosity of erg s-1. Some of the fainter structures seen on the deep H map in Hunter & Gallagher (1997), such as the long filaments (e.g., their filaments 1 and 2) and fainter shells (e.g., their shell 4) are just barely visible on our map and are somewhat below our detection limit.
In Figure 10 we show the blue main sequence stars (as in Figure 7, with and ) relative to the H emission. These stars are roughly spectral type B0 and hotter, and –10 Myr old (at the assumed metallicity of Sextans A, this corresponds to a main sequence turnoff mass of 20 ). Stars cooler than this do not contribute significantly to the UV continuum flux which can produce H II regions in the galaxy. One can see that the hot, massive stars, as expected, are well-correlated with the ionized gas, both bright and faint (in fact, a cluster of six stars cannot be distinguished from the dark contrast in Figure 10 for the H II region “no. 17,” following the Hodge et al. numbering scheme, or “no. 7,” following that of Aparicio & Rodriguez-Ulloa (1992)). Thus, we have accounted for the ionizing sources for the majority of the H II gas.
A lesser number of presumed OB stars are not associated with any H II regions above the detection limit of our study. This is true also for the regions detected by Aparicio & Rodriguez-Ulloa (1992) and Hodge et al. (1994a), although some appear to be associated with some of the fainter emission seen in the Hunter & Gallagher (1997) map. Additionally, some of the fainter emission features, based on closer inspection of our images, may be ionized by unresolved small clusters of hot stars, as is also likely the case for the bright knotty emission region, which is Hodge et al. (1994a) H II region “no. 20” and Aparicio & Rodriguez-Ulloa (1992) “no. 2”. However, the inner area of the galaxy is relatively devoid of massive stars and H II regions (the inner portion of the galaxy may have several faint filaments of emission, and, as Hunter & Gallagher 1997 point out, these filaments might comprise a larger shell structure associated with the bright H II complex in the southeast). The bulk of the massive star formation within the last Myr has been spatially, and temporally, correlated along the edge of the main surface brightness for the galaxy.
5.2 Neutral Hydrogen
Next, we investigate the relationship of the stars to the neutral gas. We have utilized a radio 21 cm H I map from Graham & Westpfahl (1998). Here we dispense with the details on their H I data, only briefly to indicate that this H I map was made using the Very Large Array (VLA) of the National Radio Astronomy Observatory333The National Radio Astronomy Observatory is operated by Associated Universities, Inc., under cooperative agreement with the National Science Foundation. at the redshifted frequency of the 21 cm line of neutral hydrogen appropriate for the galaxy, in the C-configuration in 1992 May and the D-configuration in 1992 July. (B-configuration observations were also made in 1994 June, but are not included in the map shown here.) These two sets of data were then combined, resulting in a naturally-weighted map with resolution and rms noise in the channel maps of 1.36 mJy beam-1. Both the resolution and the sensitivity are higher than those for the H I map presented in Skillman et al. (1988). Additionally, with the short spacings sampled in the most compact configuration, the maps are sensitive to more extended emission than were the Skillman et al. data. (An initial analysis of the data by Puche, including moment maps, can be found at the URL http://cfa-www.harvard.edu/projects/nga/sexa.html.)
In Figure 11 we show the total H I column density map for Sextans A. What Puche & Westpfahl (1994) consider a central depression, or “hole,” within an H I shell can clearly be seen; Skillman et al. (1988) describe the H I morphology as a “horseshoe or ring-like” structure around a central minimum, with a sharp outer boundary. This hole, 1.5 kpc in diameter, encompasses nearly the entire main optical surface brightness of the galaxy. The highest column density forms the two large spur- or arc-like structures toward the southeast (peak column, cm-2) and the northwest (peak column, cm-2), as also seen in the map by Skillman et al. (1988), and highlight the nearly complete ring or shell. The column density in the center of the galaxy, in the hole, is cm-2. The fine detail in this map indicates substructuring of smaller, fainter clumps, or clouds, and holes within the larger H I hole as well. Additionally, one can see that H I extends well beyond the H I ring or shell, as well as the main optical galaxy, consistent with other normal galaxies and what van Zee, Haynes, & Giovanelli (1996) found for their sample of dwarf galaxies. A fascinating feature of the map is the “hook” of gas extending from the disk to the west. Again, we defer here to Graham & Westpfahl (1998) for a complete presentation of these H I data.
In Figure 11 we also show the positions of the same blue stars as in Figure 10 (pluses). What should be kept in mind is that the gas disk is likely thicker than that for spirals (Puche et al. (1992)) and that the H I shell is roughly spherical. What is most striking is that the bluest, youngest stars are found preferentially and predominantly along the inner edge of the large H I hole, particularly along the inner edge of, and not coincident with, the two large complexes of H I gas to the southeast and the northwest. Far fewer of these stars are seen within or outside of this locus.
In Figure 12 one can also see, not unexpectedly, that the H emission is along the inner edges of the H I hole. The two large H II region complexes, in the southeast and the northwest, are not coincident with the brightest H I peaks, but, in fact, straddle the inner edge of both peaks. Hunter & Plummer (1996) noted that the distribution of H does not extend as far as the H I gas distribution. This is consistent with the fact that the most recent star formation is occurring primarily along the inner edge of the H I hole.
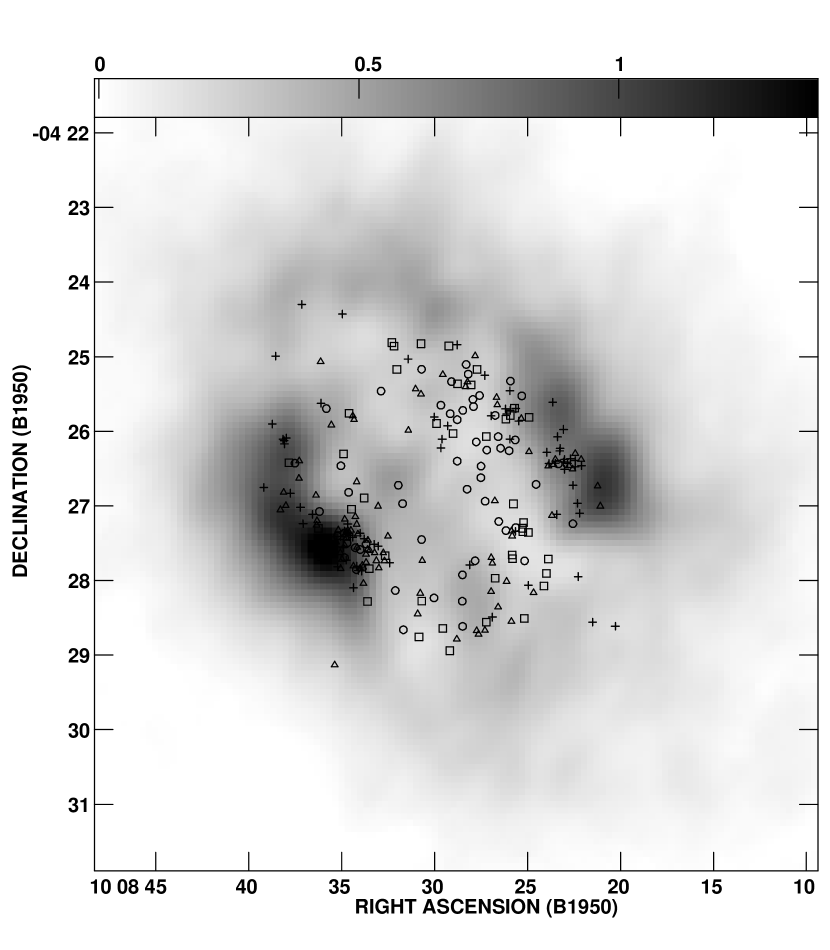
In Figure 13 we show the distributions of the young, blue main sequence stars, supergiants and He-burning stars together, as in Figure 7. One can see that the overall spatial distribution of stars with ages up to 50 Myr appears to have a similar shape and symmetry axis as the current distribution of the H I gas, and the youngest stars, but with a smaller radius. If the peak velocity dispersion in the H I (9–10 km s-1; Skillman et al. (1988); Graham & Westpfahl (1998)) represents a possible expansion of the gas outward to form the large H I hole, then to produce the current size of the hole (1.5 kpc) would take 80 Myr, assuming a constant expansion rate. If stars have been consistently forming along the inner edge of the H I hole as the gas homologously expanded, then we might expect stars with ages up to 50 Myr to share a similarly ring-shaped spatial distribution as the most recently-formed stars, albeit closer to the galaxy’s center, since 50 Myr ago the H I hole would have been 0.5 kpc smaller in radius. (However, OB associations would have dispersed somewhat over a 50 Myr timescale)
In Figure 14 we show the distributions of the older He-burning stars, as in Figure 8, with ages 50–100 Myr. What is immediately evident is that these older stars are concentrated more toward the center of the H I hole and bear relatively little relationship with the H I hole, shell, and substructuring than do the younger stars in Figure 13. We point out that regions within the H I hole exist where no stars from these older generations appear to have formed. It is clear that the gas must have been more centrally concentrated in the past than it is now.
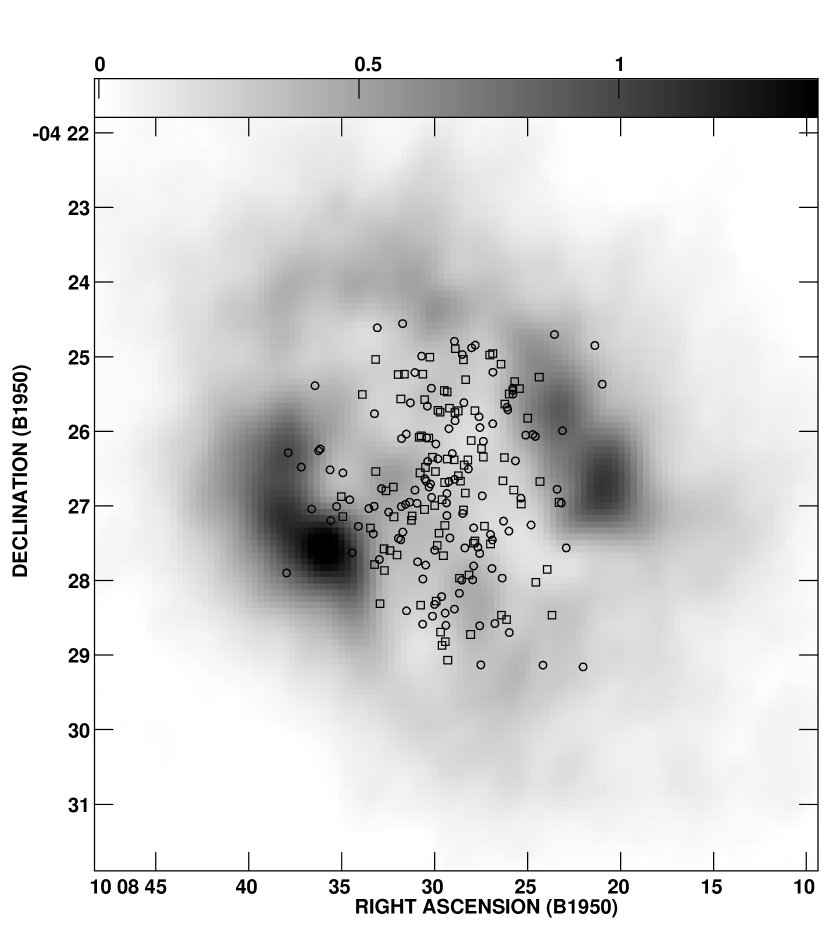
Finally, in Figure 15 we show the distributions of the older RGB and AGB stars, as in Figure 9, with ages 100 Myr – 1 Gyr or so. Here we see no relationship of these stars to the current structure of the neutral gas, consistent with the substantial dispersal of these stars from their birthplaces. The populations of older stars appear nearly uniformly distributed relative to the observed H I. Although our optically imaged field encompasses nearly the entire H I hole, it does not overlap much with the gas beyond the H I shell. The indications in Figure 15, however, are that stars had formed long ago well beyond the current H I shell structure. The H I gas in the extended disk outside the shell implies that the star-forming molecular gas may well have existed (and may still exist) there.
6 Discussion
What could have been responsible for the substantial increase in the rate and spatial concentration of the recent star formation in Sextans A? The answer to this puzzle has ramifications both for this particular galaxy and for the bursts of star formation occurring in other dwarf irregular galaxies. Dohm-Palmer et al. (1997b) conclude that sometime within the last 100 Myr or less, an event, or events, transpired that launched the galaxy into its present star-forming high state (although the movie in Dohm-Palmer et al. (1998) might imply that this event occurred as early as 370 Myr ago). We briefly speculate here on some of the possible mechanisms. A tidal interaction with nearby Sextans B has been dismissed above as a possibility, due to the large separations between the two galaxies.
One possibility is the presence of a bar potential in the galaxy. Several authors have stressed the existence of a possible bar-like feature, evident both in the optical isophotal data (Ables (1971)) and from the gas kinematics (Skillman et al. (1988)). A misalignment of the H I morphological axis with the kinematical axis, and, possibly, with the optical morphology, is typically an indication of a bar. The bar feature appears somewhat off-center, as is true for Magellanic irregulars more massive than Sextans A. The H I bar presumably connects the two pronounced maxima in the H I distribution and may be associated with the gas pile-up at its ends, where the most prominent recent star formation is occurring.
Although less is known about bars in dwarf irregular galaxies than for other larger galaxies, we can make inferences based on what is known for the more massive systems. Bars in irregulars (of generally greater mass than Sextans A) are common and may possibly arise from interaction with small neighboring H I clouds (Wilcots, Lehman, & Miller (1996)). A bar can form in a disk in about one-half to one rotation period as a result of a merger or tidal interaction (Noguchi (1987); Barnes & Hernquist (1991)). Additionally, late-type galaxies tend to have H I gas-rich bars (Hunter & Gottesman (1996)), with star formation occurring along the bar (Phillips (1996)), which appears to be the trend for, e.g., the Magellanic irregulars NGC 4618 (Odewahn (1991)) and NGC 4449 (Hunter & Thronson (1996)).
The main difficulties with a bar explanation for Sextans A are the distribution of gas and star formation in the galaxy and the necessary timescale for bar evolution. Induced inflow of gas along a bar (e.g., Schwarz (1984)) could account for the fact that the gas in Sextans A was once more centrally concentrated 50 Myr ago. However, currently the H I gas, and star formation, is concentrated in a shell around a central hole. The evolution of a bar, in the absence of interaction, likely requires several rotation periods. However, a bar can be destroyed in about one rotation period, with the formation of a long-lived outer gaseous ring, after a tidal interaction or a central accumulation of mass (Athanassoula (1996)). Redistribution of the gas from the bar into a ring could explain the current gas distribution. Yet, the dynamical timescale for Sextans A is longer than these model bar evolutionary timescales, since the galaxy has a rotation period Myr (Skillman et al. (1988)).
Furthermore, we have isolated the region of the galaxy thought to be the putative optical bar (cf. Ables (1971)) and find that the ages of the bar stars are typically 40–50 Myr old. We find no difference, then, between the ages of these stars and those of the stars generally throughout the central regions of the galaxy. The presence of an optical bar is therefore not convincing; we may merely be seeing the remnants of an extended OB association or associations, analogous to Shapley Constellation III and environs in the LMC.
A second possibility is the effect of a merger or accretion event in the past 100 Myr (with or without bar formation). This is the mechanism supported for Sextans A by Graham & Westpfahl (1998). Evidence for merger events appears to exist for a number of dwarf galaxies. Saito et al. (1992) propose such a model for IC 10. Of particular curiosity in the case of Sextans A is the H I gas extending westward from the H I disk. Graham & Westpfahl claim that the velocity field for the galaxy can be explained as resulting from a merger. Mergers are also known to result in a central concentration of the molecular gas in galaxies. Thus, a merger model cannot be easily dismissed. However, it alone does not offer an explanation for the current distribution of star formation in Sextans A.
A third possibility is the mechanism of supernova-driven expansion and sequential star formation, at least for more recent epochs. Hunter et al. (1998) have recently suggested that sequentially-triggered star formation, driven by mechanical energy input by concentrations of massive stars, is likely to be an important mechanism for cloud formation in irregulars. The fact that the current star formation in Sextans A is occurring mostly on the edge of the H I hole is consistent with cold gas pileup and compression at this locus. This would occur if the gas within the H I hole is expanding outward into the extended H I envelope seen in the radio data. The behavior of the current star formation is remarkably similar to the star formation occurring particularly along the largest H I holes seen in Ho II (Puche et al. (1992); see also Tongue & Westpfahl (1995)) and IC 2574 (Martimbeau et al. 1994). A local example may also be Constellation III and LMC 4 in the LMC (Dopita, Mathewson, & Ford (1985); Grebel & Brandner (1998)).
As massive stellar populations have formed and evolved in the past in the interior of Sextans A, they have input significant energy into the ISM through stellar winds (e.g., Leitherer et al. 1992) and ended their lives as supernovae. The resulting hot gas expands outward from the interior of the galaxy, pushing on the colder gas, compressing it, forming clouds, and triggering further star formation as the galaxy evolves.
Is this mechanism plausible for Sextans A, given the kinematics of the gas? As discussed in §5.2, if the peak velocity dispersion in the H I (9–10 km s-1; Skillman et al. (1988); Graham & Westpfahl (1998)) represents a possible expansion of the gas to form the large H I hole, then the age of the hole would be 80 Myr. This timescale is consistent with the fact that the star formation rate substantially increased in the last 100 Myr and also agrees with the ages of stars near the center of Sextans A, which would presumably be the remaining less massive siblings of the supernova progenitors from those stellar generations. Furthermore, the distributions of populations with ages Myr is suggestive of a progression from oldest stars inward to the youngest outward within the H I hole, consistent with an expanding front of star formation outward from the center.
A major difficulty with this scenario is that, although Puche & Westpfahl (1994) claim evidence for expanding gas, Graham & Westpfahl (1998), from the very same dataset, do not find convincing evidence for an expanding shell, i.e., characteristic double-peaked velocity profiles, particularly at the velocity dispersion peak, which they find near the galaxy’s center, in the lowest column density region. However, it may be difficult to see such a feature in these low brightness regions. Furthermore, Domgoergen, Bomans, & de Boer (1995) and Points et al. (1998) found an absence of expansion for LMC 4 and for LMC 2, respectively.
Another potential difficulty is that Rhode, Salzer, & Westpfahl (1998), from deep optical CCD imaging, recently claim not to find remnant populations at the centers of H I holes in Ho II and other dwarfs. However, Rhode et al. searched for remnant main sequence populations at the hole centers, whereas it is clear from our CMDs that the remnant populations would be most readily identified as evolved He-burning stars, which are 2 mag brighter, and significantly redder, than main sequence stars of the same age. (Interestingly, red supergiants might dominate the light from a remnant cluster, since, in systems with the low metallicities of dwarf irregulars, these stars may not necessarily be the progenitors of all massive supernovae, as we have directly witnessed with SN 1987A in the LMC; see Woosley (1988), Saio, Kato, & Nomoto (1988).) For Sextans A, we believe that our imaging shows several populations of a feasible age, near the center of the large hole, which are suitable candidates for remnant sibling stars to the supernovae progenitors.
Of course, some combination of these various mechanisms may have been at work during the galaxy’s history. It is possible that the galaxy has experienced the effects of a merger or accretion event, or of a bar potential sometime in the past, resulting in a significant increase in the star formation rate. The increased massive star formation resulted in increased feedback to the ISM, which may have resulted in an expanding bubble of hot gas, which has promoted the current star formation we are witnessing. We simply do not have enough information.
The trigger for the current burst of star formation in Sextans A remains a mystery, although we have shed additional new light through our optical imaging of the galaxy and our comparison with the gas components. Dohm-Palmer et al. (1997a,b) have also provided some vital clues, but due to the limited field size of the HST/WFPC2 camera, they sampled only about half of the galaxy, and therefore, their results are only applicable to this smaller field. Since star formation has occurred in bursts in various regions of Sextans A, sampling a larger area of the galaxy provides a broader view of the recent star formation history.
Unfortunately, one important additional clue that is missing is the distribution of the molecular gas, about which we have no information other than the low upper limit to the luminosity of the CO tracer (Ohta et al. (1993)). We do not know the mass nor the extent of the actual gaseous raw material for star formation in the galaxy. That information would help resolve questions about the nature and history of star formation in Sextans A.
7 Conclusions
From our ground-based observations of the Local Group dwarf irregular galaxy Sextans A in and H, we have found that current star formation is occurring mostly along the inner edge of the large H I shell surrounding a hole, or depression, in the H I column density, consistent with cold gas pileup and compression of the gas at this locus. The distribution of stars with ages 50 Myr indicate an outward progression of star formation with time. Regions exist where the star formation appears to be exclusively recent, and regions where no star formation has occurred within the last 50 Myr. Older star formation, from 50–100 Myr, appears to have some spatially coherent structure and is more centrally concentrated than the most recent star formation. The oldest star formation that we can accurately sample appears to be uniformly distributed across Sextans A, even beyond a surface brightness of mag arcsec-2, or, a radius .
The recent bursts in star formation are not only coherent in time, but also in space across Sextans A. The trigger of these bursts remains unknown, however, we believe we have presented the strongest evidence so far that supernova-driven expansion of the gas may be responsible for at least some of the star formation over the galaxy’s history. The expansion of the gas, due to episodic sequential star formation within the galaxy, is a direct trigger for further star formation as the galaxy evolves. We note that the expected expansion age of the H I shell is 80 Myr (assuming an expansion velocity of 10 km s-1 and a shell diameter of 1.5 kpc), which is consistent with the ages of the older, centrally concentrated evolved stars, which may be the remnants of the populations which included the massive stars responsible for the expansion.
References
- Ables (1971) Ables, H. 1971, PUSNO, 2d Ser., 20, Part 4
- Aparicio & Rodriguez-Ulloa (1992) Aparicio, A., & Rodriguez-Ulloa, J. A. 1992, A&A, 260, 77
- Aparicio & Gallart (1995) Aparicio, A., & Gallart, C. 1995, AJ, 110, 2105
- Aparicio, Gallart, & Bertelli (1997) Aparicio, A., Gallart, C., & Bertelli, G. 1997, AJ, 114, 669
- Aparicio et al. (1987) Aparicio, A., Garcia-Pelayo, J. M., Moles, M., & Melnick, J. 1987, A&AS, 71, 297 (A87)
- Aparicio et al. (1996) Aparicio, A., Gallart, C., Chiosi, C., & Bertelli, G. 1996, ApJ, 469, L97
- Athanassoula (1996) Athanassoula, E. 1996, in Barred Galaxies, ed. R. Buta, D. A. Crocker, & B. G. Elmegreen, (San Francisco, ASP) ASP Conf. Series, 91, p. 309
- Barnes & Hernquist (1991) Barnes, J. E., & Hernquist, L. E. 1991, ApJ, 370, L65
- Bertelli et al. (1994) Bertelli, G., Bressan, A., Chiosi, C., Fagotto, F., & Nasi, E. 1994, A&AS, 106, 275
- Braun et al. (1997) Braun, J. M., Bomans, D. J., Will, J.-M., & de Boer, K. S. 1997, A&A, 328, 167
- Burstein & Heiles (1984) Burstein, D., & Heiles, C. 1984, ApJS, 54, 33
- Cardelli, Clayton, & Mathis (1989) Cardelli, J. A., Clayton, G. C., & Mathis, J. S. 1989, ApJ, 345, 245
- Cash et al. (1980) Cash, W., Charles, P., Bowyer, S., Walter, F., Garmire, G., & Riegler, G. 1980, ApJ, 238, L71
- Chevalier (1974) Chevalier, R. A. 1974, ApJ, 188, 501
- Chiosi, Bertelli, & Bressan (1992) Chiosi, C., Bertelli, G., & Bressan, A. 1992, ARA&A, 30, 235
- Costa & Frogel (1996) Costa, E., & Frogel, J. A. 1996, AJ, 112, 2607
- (17) Dohm-Palmer, R. C., Skillman, E. D., Saha, A., Tolstoy, E., Mateo, M., Gallagher, J., Hoessel, J., Chiosi, C., & DuFour, R. J. 1997a, AJ, 114, 2514
- (18) Dohm-Palmer, R. C., Skillman, E. D., Saha, A., Tolstoy, E., Mateo, M., Gallagher, J., Hoessel, J., Chiosi, C., & DuFour, R. J. 1997b, AJ, 114, 2527
- Dohm-Palmer et al. (1998) Dohm-Palmer, R. C., Skillman, E. D., Saha, A., Tolstoy, E., Mateo, M., Gallagher, J., Hoessel, J., Chiosi, C., & DuFour, R. J. 1998, AJ, 115, 152
- Domgoergen, Bomens, & de Boer (1995) Domgoergen, H., Bomens, D. J., & de Boer, K. S. 1995, A&A, 296, 523
- Dopita, Mathewson, & Ford (1985) Dopita, M. A., Mathewson, D. S., & Ford, V. L. 1985, ApJ, 297, 599
- Drissen, Roy, & Robert (1997) Drissen, L., Roy, J.-R., & Robert, C. 1997, ApJ, 474, L35
- Freedman (1985) Freedman, W. L. 1985, ApJ, 299, 74
- Gerola & Seiden (1978) Gerola, H., & Seiden, P. E. 1978, ApJ, 223, 129
- Gerola, Seiden, & Schulman (1980) Gerola, H., Seiden, P. E., & Schulman, L. S. 1980, ApJ, 242, 517
- Graham & Westpfahl (1998) Graham, M., & Westpfahl, D. 1996, in preparation
- Grebel & Brandner (1998) Grebel, E. K., & Brandner, W. 1998, in The Magellanic Clouds and Other Dwarf Galaxies, ed. T. Richtler & J. M. Braun, in press
- Grebel, Roberts, & Brandner (1996) Grebel, E. K., Roberts, W. J. & Brandner, W. 1996, A&A, 311, 470
- Greggio et al. (1993) Greggio, L., Marconi, G., Tosi, M., & Focardi, P. 1993, AJ, 105, 894
- Heiles (1979) Heiles, C. 1979, ApJ, 229, 533
- Heiles (1984) Heiles, C. 1984, ApJS, 55, 585
- (32) Hodge, P., Kennicutt, R. C., & Strobel, N. 1994, PASP, 106, 765
- (33) Hodge, P., Strobel, N. V., & Kennicutt, R. C. 1994, PASP, 106, 309
- Hoessel & Melnick (1980) Hoessel, J. G., & Melnick, J. 1980, A&A, 84, 317
- Hoessel et al. (1983) Hoessel, J. G., Schommer, R. A., & Danielson, G. E. 1983, ApJ, 274, 577 (HSD)
- Hunter (1997) Hunter, D. A. 1997, PASP, 109, 937
- Hunter & Gallagher (1986) Hunter, D. A., & Gallagher, J. S. 1986, PASP, 98, 5
- Hunter & Gallagher (1997) Hunter, D. A., & Gallagher, J. S. 1997, ApJ, 475, 65
- Hunter & Plummer (1996) Hunter, D. A., & Plummer, J. D. 1996, ApJ, 462, 732
- Hunter & Thronson (1996) Hunter, D. A., & Thronson, H. A. 1996, ApJ, 461, 202
- Hunter, Elmegreen, & Baker (1998) Hunter, D. A., Elmegreen, B. G., & Baker, A. L. 1998, ApJ, 493, 595
- Hunter & Gottesman (1996) Hunter, J. H., & Gottesman, S. T. 1996, in Barred Galaxies, ed. R. Buta, D. A. Crocker, & B. G. Elmegreen, (San Francisco, ASP) ASP Conf. Series, 91, p. 398
- Landolt (1992) Landolt, A. U. 1992, AJ, 104, 340
- (44) Koo, B. C., & McKee, C. F. 1992a, ApJ, 388, 93
- (45) Koo, B. C., & McKee, C. F. 1992b, ApJ, 388, 103
- Leitherer, Robert, & Drissen (1992) Leitherer, C., Robert, C., & Drissen, L. 1992, ApJ, 401, 596
- Marconi et al. (1995) Marconi, G., Tosi, M., Greggio, L., & Focardi, P. 1995, AJ, 109, 173
- Martimbeau, Carignan, & Roy (1994) Martimbeau, N., Carignan, C., & Roy, J.-R. 1994, AJ, 107, 543
- Massey, Johnson, & De Gioia-Eastwood (1995) Massey, P., Johnson, K. E., & De Gioia-Eastwood, K. 1995, ApJ, 454, 151
- Massey et al. (1995) Massey, P., Lang, C. C., De Gioia-Eastwood, K., & Garmany, C. D. 1995, ApJ, 438, 188
- Minniti & Zijlstra (1996) Minniti, D., & Zijlstra, A. A. 1996, ApJ, 467, L13
- Noguchi (1987) Noguchi, M. 1987, MNRAS, 228, 635
- Odewahn (1991) Odewahn, S. C. 1991, AJ, 101, 8290
- Ohta et al. (1993) Ohta, K., Tomita, A., Saito, M., Sasaki, M., & Nakai, N. 1993, PASJ, 45, L21
- Olsen et al. (1997) Olsen, K. A. G., Hodge, P. W., Wilcots, E. M., & Pastwick, L. 1997, ApJ, 475, 545
- Phillips (1996) Phillips, A. C. 1996, in Barred Galaxies, ed. R. Buta, D. A. Crocker, & B. G. Elmegreen, (San Francisco, ASP) ASP Conf. Series, 91, p. 44
- Piotto, Capaccioli, & Pellegrini (1994) Piotto, G., Capaccioli, M., & Pellegrini, C. 1994, A&A, 287, 371
- Points et al. (1998) Points, S. D., Chu, Y.-H., Kim, S., Smith, R. C., Snowden, S. L., Brandner, W., & Gruendl, R. A. 1998, ApJ, in press
- Puche & Westpfahl (1994) Puche, D., & Westpfahl, D. 1994, in Dwarf Galaxies (ESO/OHP Workshop), ed. G. Meylan & P. Prugniel, (Garching: ESO), p. 273
- Puche et al. (1992) Puche, D., Westpfahl, D., Brinks, E., & Roy, J.-R. 1992, AJ, 103, 1841
- Ratnatunga & Bahcall (1985) Ratnatunga, K. U., & Bahcall, J. N. 1985, ApJS, 59, 63
- Reid, Mould, & Thompson (1987) Reid, N., Mould, J., & Thompson, I. 1987, ApJ, 323, 433
- Rhode, Salzer, & Westpfahl (1997) Rhode, K. L., Salzer, J. J., & Westpfahl, D. J. 1997, BAAS, 29, 1342
- Saio, Kato, & Nomoto (1988) Saio, H., Kato, M., & Nomoto, K. 1988, ApJ, 331, 388
- Saito et al. (1992) Saito, M., Sasaki, M., Ohta, K., & Yamada, T. 1992, PASJ, 44, 593
- Sakai, Madore, & Freedman (1996) Sakai, S., Madore, B. F., & Freedman, W. L. 1996, ApJ, 461, 713 (SMF)
- Sandage & Carlson (1982) Sandage, A., & Carlson, G. 1982, ApJ, 258, 439 (SC82)
- Sandage & Carlson (1985) Sandage, A., & Carlson, G. 1985, AJ, 90, 1019 (SC85)
- Schwarz (1984) Schwarz, M. P. 1984, MNRAS, 209, 93
- Skillman, Kennicutt, & Hodge (1989) Skillman, E. D., Kennicutt, R. C., & Hodge, P. W. 1989, ApJ, 347, 875
- Skillman, Bomans, & Kobulnicky (1997) Skillman, E. D., Bomans, D. J., & Kobulnicky, H. A. 1997, ApJ, 474, 205
- Skillman et al. (1988) Skillman, E. D., Terlevich, R., Teuben, P. J., & van Woerden, H. 1988, A&A, 198, 33
- Stetson (1987) Stetson, P. B. 1987, PASP, 99, 191
- Stetson (1990) Stetson, P. B. 1990, PASP, 102, 932
- Stetson, Davis, & Crabtree (1990) Stetson, P. B., Davis, L. E., & Crabtree, D. R. 1990, in CCDs in Astronomy, ed. G. H. Jacoby (San Francisco, ASP) ASP Conf. Series, 8, p. 289
- Tenorio-Tagle & Bodenheimer (1988) Tenorio-Tagle, G., & Bodenheimer, P. 1988, ARA&A, 26, 145
- Tongue & Westpfahl (1995) Tongue, T. D., & Westpfahl, D. J. 1995, AJ, 109, 2462
- Tosi et al. (1991) Tosi, M., Greggio, L., Marconi, G., & Focardi, P. 1991, AJ, 102, 951
- Tully (1988) Tully, R. B. 1988, Nearby Galaxies Catalog (Cambridge University Press)
- van Zee, Haynes, & Giovanelli (1995) van Zee, L., Haynes, M. P., & Giovanelli, R. 1995, AJ, 109, 990
- Wade et al. (1979) Wade, R. A., Hoessel, J. G., Elias, J. H., & Huchra, J. P. 1979, PASP, 91, 35
- Walker (1987) Walker, A. R. 1987, MNRAS, 224, 935 (W87)
- Waller (1990) Waller, W. 1990, PASP, 102, 1217
- Westpfahl & Puche (1994) Westpfahl, D. J., & Puche, D. 1994, preprint
- Wilcots, Lehman, & Miller (1996) Wilcots, E. M., Lehman, C., & Miller, B. 1996, AJ, 111, 1575
- Woosley (1988) Woosley, S. E. 1988, ApJ, 330, 218
| Authors | Source | Difference |
|---|---|---|
| HSD | CCD | |
| SC85 | photog | |
| A87 | CCD | |
| W87 | CCD | |
| SMF | CCD | |
| HSD | CCD | |
| SC85 | photog | |
| A87 | CCD | |
| W87 | CCD | |
| A87 | CCD | |
| SMF | CCD | |
| HSD | CCD | |
| Actual Counts | |||
| 18 | 8 | 1 | 4 |
| 20 | 196 | 20 | 40 |
| 22 | 725 | 472 | 83 |
| 24 | 55 | 209 | 54 |
| Predicted CountsaaBased on interpolating the model counts from Ratnatunga & Bahcall (1985) for the field appropriate for Sextans A. | |||
| 18 | 1.1 | 1.4 | 1.9 |
| 20 | 2.4 | 1.1 | 5.5 |
| 22 | 2.4 | 2.4 | 10.8 |
| 24 | 0.9 | 2.8 | 17.7 |