A Survey for Low-Surface-Brightness Galaxies Around M31. I. The Newly Discovered Dwarf Andromeda V
Abstract
We present images and a color–magnitude diagram for And V, a new dwarf spheroidal companion to M31 that was found using a digital filtering technique applied to 1550 deg2 of the second Palomar Sky Survey. And V resolves into stars easily in follow-up 4-m - and -band images, from which we deduce a distance of 810 45 kpc using the tip of the red giant branch method. Within the uncertainties, this distance is identical to the Population II distances for M31 and, combined with a projected separation of 112 kpc, provides strong support for a physical association between the two galaxies. There is no emission from And V detected in H, 1.4 GHz radio continuum, or IRAS bandpasses, and there is no young population seen in the color–magnitude diagram that might suggest that And V is an irregular. Thus, the classification as a new dwarf spheroidal member of the Local Group seems secure. With an extinction-corrected central surface brightness of 25.2 mag/arcsec2, a mean metal abundance of [Fe/H] –1.5, and no evidence for upper AGB stars, And V resembles And I & III.
1 Introduction
A complete and accurate knowledge of dwarf galaxies in the Local Group is necessary for many problems in galaxy formation and cosmology (see Ferguson & Binggeli 1994, Gallagher & Wyse 1994). For example, the faint end of the luminosity function in large clusters of galaxies is more populated than that of the Local Group (Trentham 1998). Because this result may be explained by incompleteness and/or small number statistics in the Local Group, it remains unknown whether low-luminosity galaxies form more frequently in denser environments or not. As another example, van den Bergh (1994) found a correlation between the Galactic dwarfs’ galactocentric distances and the prominence of an intermediate-age population. This may reflect the effects of ram pressure stripping or photoionization via the early Milky Way’s integrated UV flux on the inner dwarf spheroidals. However, our ability to confirm or rule out this trend in the independent case of M31 is hampered by its small number of known companions.
The Milky Way has nine low-surface-brightness gas-poor companions; these are usually called dwarf spheroidal galaxies. Dwarf spheroidals are now considered low-luminosity dwarf elliptical galaxies. The empirical correlations followed by dwarf spheroidals join smoothly onto the dwarf elliptical correlations (e.g., central surface brightness vs. absolute magnitude, mean metal abundance vs. absolute magnitude). M31 has three dwarf spheroidal companions (And I, II & III) and three dwarf elliptical companions (NGC 147, 185 & 205)111See Gallagher & Wyse (1994), Armandroff (1994), and Da Costa (1998) for recent reviews on the dwarf companions to the Milky Way and M31.. This relatively small number would seem to suggest a deficit of dwarf spheroidal companions of M31 compared to the Milky Way. Is this a real effect or simply due to the fact that the Milky Way has been searched more thoroughly than M31? Alternatively, it is possible that M31’s environment was more conducive to producing more luminous dwarfs like NGC 147, 185 and 205, rather than very low luminosity dwarfs. Another possibility is that M31 was more effective than the Milky Way in disrupting and accreting its original population of low-luminosity dwarfs.
The current census of M31 dwarf spheroidals resulted from the pioneering survey of van den Bergh (1972a, 1974). He visually searched 700 square degrees around M31 using IIIaJ photographic plates taken with the Palomar 48-inch Schmidt telescope. Three dwarf spheroidal candidates were found (And I, II & III). One smaller, higher surface brightness object was also found (And IV); subsequent work confirmed van den Bergh’s (1972a) conclusion that it is not a dwarf spheroidal (Jones 1993). And I, II & III were found to resolve into stars at approximately the same magnitude as the M31 companion NGC 185 (van den Bergh 1972b, 1974), supporting the notion that these three galaxies are physically associated with M31. As more precise distances to And I, II & III have become available (e.g., Armandroff et al. 1993, Da Costa et al. 1996), the conclusion that these galaxies are located in the outer reaches of M31’s halo has remained valid.
For the Galactic dwarf spheroidals, all three components of their galactocentric distance are known. However, only projected distances from the center of M31 are known for And II & III (see Da Costa et al. 1996 for a precise line-of-sight distance for And I, based on the magnitude of the horizontal branch, and the resulting limits on its true three-dimensional distance from the center of M31). Figure 6 of Armandroff (1994) compares the projected galactocentric distance distribution of the M31 dwarf spheroidals with that of their Galactic counterparts. Van den Bergh’s (1972a, 1974) survey begins to lack complete areal coverage at a projected galactocentric distance of 110 kpc, and it has no coverage beyond a projected galactocentric distance of 260 kpc. Since Leo I and II are located 200 kpc from the Galactic center, some M31 dwarfs with very large galactocentric distances may be outside van den Bergh’s survey area. Finally, because And III with a central surface brightness of 25.3 mag/arcsec2 was found by van den Bergh, we know that his survey was sensitive to quite low surface brightness. However, the central surface brightness to which van den Bergh’s (1972a, 1974) survey is complete is not known.
In order to find possible additional M31 low-surface-brightness companions, we undertook a new search of the area around M31. Our search uses the Second Palomar Sky Survey (POSS-II; Reid et al. 1991, Reid & Djorgovski 1993), which has higher resolution and extends substantially deeper than its predecessor. The availability of the POSS-II in digital form (Lasker & Postman 1993) allows the use of digital image processing techniques. These techniques may enable the detection of dwarf galaxies of even lower central surface brightness than van den Bergh’s (1972a, 1974) completeness limit. The digital POSS-II also facilitates the search of an arbitrarily large area of sky around M31.
This paper will provide a brief description of our search strategy and techniques. This will be followed by the first results of our survey, in which we identify a new dwarf galaxy associated with M31.
2 Search Methodology
The POSS-II data used for the survey consists of red IIIaF RG610 plates that were digitized at STScI. The red bandpass was chosen for searching for dSph galaxies because most of their light is typically emitted by red giants and red horizontal branch stars. The fainter sky and broader bandpass of the blue plates suggest that these might have similar detection efficiency, but at the time of our study only the red plates were accessible digitally. The plates are 6.6 degrees on a side with 6.3 degrees of useable emulsion. They are spaced 5 degrees between plate centers which gives a 1.3 degree overlap area for cross-checking candidates to eliminate spurious detections. Having this relatively large overlap is useful considering the optical vignetting effects in the outer regions of the plates as discussed by Reid et al. (1991). Each digitized plate is subdivided into a grid of 77 1 deg2 images (each 3564 pixels on a side) to make the image processing more manageable. The 49 images per plate consequently have overlaps of 7 arcmin which is larger than the FWHM of a typical dwarf galaxy profile at the distance of M31; therefore no objects are missed due to being close to an edge.
Each 1 deg2 image is filtered separately in a four-step process for the purpose of increasing the signal-to-noise of low-surface-brightness (LSB) features. The procedure was optimized for the detection of And II & III. These steps are:
-
1.
A fourth order polynomial is fit to and subtracted from the background of each image in order to make the background as flat as possible. It should be noted that these plates are remarkably flat on scales of several cm, corresponding to about a degree. The background needs to be as flat as possible due to the way that high-surface-brightness (HSB) objects are removed in step 2. It was found through successive trials of fitting polynomials of different order that a fourth order polynomial flattened the plate well enough without running the risk of removing LSB features on the scale of a few arcmin. Values 2 higher than the image median are not used in the fitting so that the polynomial fit is dominated by the background and not by stars and galaxies in the image (where is the standard deviation).
-
2.
Stars on the images are removed by a clipping operation that calculates the median value of the full image and replaces all values above and below the median with the median value. The positive clip has the effect of removing all HSB objects—stars, obvious galaxies and clusters of galaxies—that hamper the detection process. The negative clip gets rid of darkened rings caused by dust and other plate defects. The clipping operation works well since it has no preference for the size or shape of the HSB object—it removes everything. The value of was found to be optimal in that it removes much of the “wings” of large, bright stars but does not clip too low and run the risk of diminishing the peaks of our test dSph galaxies, And II & III.
-
3.
The images are then filtered with a square spatial median filter of size 7777 arcsec that moves across the image replacing the central pixel value with the median of the 7777 pixel values contained in the box. Davies et al. (1994) found that in order to optimally enhance and detect an LSB disk galaxy, their cross-correlation filter size and the scale length of the galaxy ought to be roughly equal within a factor of 2. We confirm this for a median filter and LSB dwarf galaxies and find that for dSph with exponential scale lengths in the 45 to 94 arcsec range defined by the known Andromeda dwarfs (Caldwell et al. 1992), an optimal median filter size is 7777 arcsec.
-
4.
Detection of LSB dwarf galaxies is carried out by visually comparing the filtered images with the raw images and selecting candidates that resemble And II & III on the raw and processed images. LSB features are prominent on the processed images but are extremely weak, and in many cases invisible, on the unprocessed images. And II & III are trivial to detect on processed POSS-II images (processed POSS-I images easily reveal all three M31 dSph). Images of And II & And III from the POSS-II, raw and after processing, are shown in Figure 1 (And I is not shown because the relevant digitized POSS-II image is not yet available).
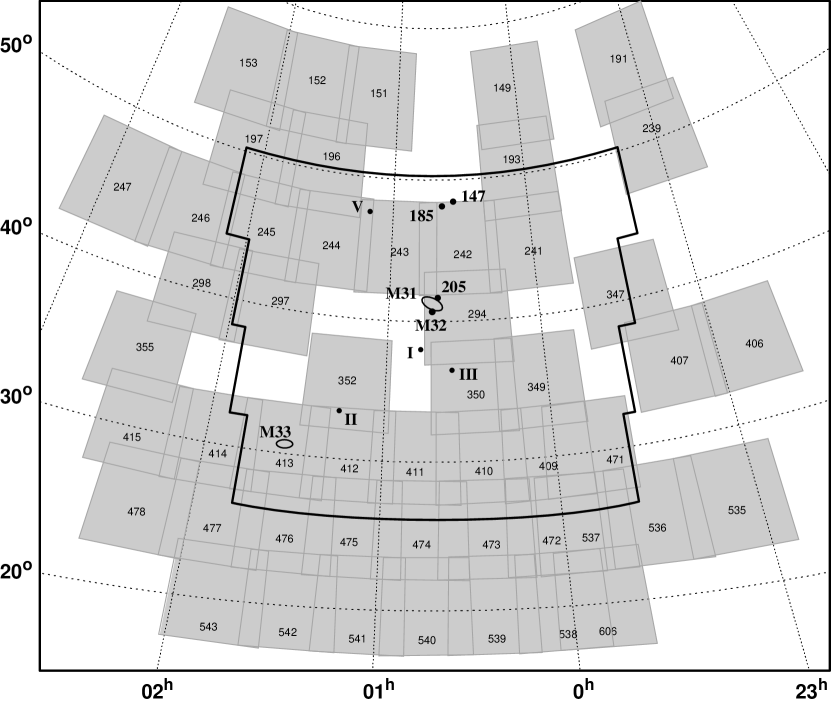
The survey area was selected based on the area searched by van den Bergh (1974) and was extended out 6–10 degrees farther in all directions for the completeness reasons stated in the Introduction. Figure 2 shows the area that has been searched so far as shaded boxes, with the van den Bergh area outlined. The area searched consists of 51 plates that cover approximately 1550 deg2.
Since the image processing enhances any density feature on the plate that is the proper size and low enough surface brightness (a few percent above sky), and because the survey area is very large, identifying and eliminating contaminants that masquerade as LSB dwarfs is a daunting task. The biggest offenders are ghosts produced from the reflection of bright stars in the telescope optics and Galactic reflection nebulae (also referred to as Galactic cirrus clouds; see Bremmes, Binggeli & Prugniel 1998). In many cases follow-up observations are the only way to eliminate candidates. Fortunately, many detections are asymmetric and lack a smooth exponential profile, rendering them inconsistent with an LSB dwarf galaxy signature. Therefore, such objects can be eliminated from the candidate list. The remainder, however, require follow-up CCD imaging, which is described in the next section.
3 Follow-Up Observations
The remainder of this paper will concentrate on one excellent candidate that was found at the following celestial coordinates: = 1:10:17.1, = +47:37:41. These correspond to Galactic coordinates of: = 126.2∘, = –15.1∘. There are no previously catalogued galaxies/objects at these coordinates according to the NASA/IPAC Extragalactic Database222The NASA/IPAC Extragalactic Database (NED) is operated by the Jet Propulsion Laboratory, California Institute of Technology, under contract with the National Aeronautics and Space Administration. and the SIMBAD database. Because other “newly found” nearby dwarf galaxies have occasionally turned out to be rediscoveries, we have inspected a number of lists that may contain such galaxies in order to verify that this object is indeed new, including Karachentseva & Karachentsev (1998), Nilson (1973), Schmidt & Boller (1992), Ellis et al. (1984), Weinberger (1995), and Schombert et al. (1992). Following van den Bergh (1972a), we will call this new system Andromeda V. Figure 2 shows where And V falls in the search area.
Figure 3 shows And V on the digitized POSS-II, raw and after processing. One sees a strong resemblance between And V and the known M31 dwarf spheroidals And II & III on the raw and processed POSS-II images (see Figure 1). We examined the POSS-I prints and found that And V is not visible on them; And I, II & III are not clearly visible on the POSS-I prints either. And I & II are easily visible on the POSS-II transparencies. And III, which is of lower central surface brightness than And I & II (Caldwell et al. 1992), is just visible on the POSS-II. And V appears to be of lower surface brightness still and is marginally discernible on the POSS-II provided that the coordinates are known a priori. Karachentseva & Karachentsev (1998) also noted that And I, II & III are visible on the POSS-II.
The first step in clarifying the nature of a candidate from the sky survey is small-telescope CCD imaging. Such imaging eliminates candidates that are really ghosts from bright stars on the POSS-II. Other potential “contaminants” that can be eliminated via small-telescope imaging include: distant clusters of galaxies, planetary nebulae, and distant low-surface-brightness spirals.333Note that we have not completed follow-up imaging of all of our candidate LSB dwarfs. We will report follow-up imaging of other candidates in a future paper. And V was imaged at the KPNO 0.9-m telescope with the CCD Mosaic Imager (see Armandroff et al. 1998) in the band for 600 seconds on September 28, 1997. The scale was 0.43 arcsec/pixel, and the seeing was 1.4 arcsec FWHM. In the 0.9-m data, And V looks like a low-surface-brightness galaxy and shows incipient resolution into stars.
And V was imaged at the KPNO 4-m telescope prime focus with the T2KB CCD on November 2, 1997 (see Massey et al. 1997 for a description of the imager). The scale was 0.42 arcsec/pixel, and the seeing was 1.0 arcsec FWHM. Three exposures of 900 sec each and seven exposures of 300 sec each were obtained. It was photometric and 15 Landolt (1992) standards in three fields were observed. The combined 4-m image is displayed in Figure 4 (the central 1000 1000 pixels). And V resolves nicely into stars on both the and the images. One sees a smooth stellar distribution. In these images, And V resembles the other M31 dwarf spheroidals (see Figure 1 of Mould & Kristian 1990 and/or Figure 1 of Armandroff et al. 1993). And V does not look lumpy or show obvious regions of star formation that would suggest a dwarf irregular classification. No obvious globular clusters are seen in And V, though none are expected for a low-luminosity dwarf spheroidal (e.g., Sec. 4.3 of Da Costa & Armandroff 1995).
In order to look for possible ionized gas, And V was observed with the KPNO 4-m telescope in H narrow-band and on October 21, 1997 with the CCD Mosaic Imager. The H filter used has a central wavelength of 6569 Å and a width of 80 Å FWHM in the f/3.2 beam of the telescope. Five narrow-band exposures of 600 sec each and five exposures of 400 sec each were obtained. The average seeing was 1.2 arcsec FWHM, sampled at 0.26 arcsec/pixel. We computed scaling ratios between the combined H and images and performed the subtraction. Figure 5 shows both the H image and the continuum-subtracted H image. No diffuse H emission or H ii regions were detected in And V. Some residuals are present in this image due to the somewhat different behavior of the PSF in and H. There are a few small positive residuals, but these are all detected strongly in , , and and therefore are not H ii regions or planetary nebulae. Their slightly extended nature suggests that they are distant galaxies. The lack of H emission in And V likely rules out significant current star formation, reinforcing our conclusion, based on And V’s appearance on the broad-band images, that it is a dwarf spheroidal galaxy rather than a dwarf irregular. Almost all Local Group dwarf irregulars are easily detected in H (e.g., Kennicutt 1994).
We also examined the IRAS maps of the And V region, using the FRESCO data product from IPAC444IPAC is funded by NASA as part of the IRAS extended mission under contract to JPL.. And V is not detected in any of the IRAS far-infrared bands. And I, II & III are not detected by IRAS either. Far-infrared emission, as seen by IRAS, is the signature of warm dust. Some Local Group dwarf irregular galaxies, such as NGC 6822, IC 1613 and WLM, are detected by IRAS (Rice et al. 1988). Hence the non-detection of And V by IRAS is further evidence that it does not contain substantial amounts of dust and gas. However, many of the less active, less luminous Local Group dwarf irregulars are not detected by IRAS either. Consequently, the lack of far-infrared emission from And V is probably a weaker constraint on the presence of an interstellar medium than the lack of H emission.
And V is not detected in the NRAO VLA 1.4 GHz radio continuum survey (Condon et al. 1998). This is as expected because none of the Local Group dwarf spheroidals are detected in this survey, and even most Local Group dwarf irregulars are not detected. IC 10 is easily detected in the 1.4 GHz survey, but it has an exceptional star-formation rate and disturbed interstellar medium (Yang & Skillman 1993, Massey & Armandroff 1995).
We know nothing about the H i content of And V via 21 cm observations. Either an H i detection or a strict upper limit would be valuable.
4 Color–Magnitude Diagram
The next step in ascertaining the nature of And V is the construction of a color–magnitude diagram for its member stars in order to reveal its distance and stellar populations characteristics. Instrumental magnitudes were measured on the And V 4-m images using the IRAF implementation of the daophot crowded-field photometry program (Stetson 1987, Stetson et al. 1990). The standard daophot procedure was used, culminating in multiple iterations of allstar. Because substantial point-spread-function variations occur between the middle and corners of the CCD frames, only the central region was analyzed. Stars with anomalously large values of the daophot parameter CHI were removed from the photometry lists.
Large-aperture photometry was performed for the 15 well-exposed Landolt (1992) photometric standard stars. Assuming mean atmospheric extinction coefficients for Kitt Peak, photometric transformation equations were derived. Besides the zeropoint, only a linear color term of small size was needed in each filter. The And V allstar magnitudes were placed on the standard system via large-aperture photometry of several bright, uncrowded stars on the And V images in each filter.
Initial color–magnitude diagrams for the parts of the images dominated by And V stars revealed a red giant branch, which is absent in the outer regions of the images. We used the spatial distribution of the stars in the red-giant region of the color–magnitude diagram to determine a reasonably precise center for And V (see Figure 4)555The x,y coordinates of this center were transformed to celestial coordinates using the HST Guide Star Catalog. This is the origin of the celestial coordinates for And V given in the first paragraph of Sec. 3. The uncertainty in the coordinates is dominated by the error in determining the centroid of likely member giants and is roughly 5 arcsec..
The color–magnitude diagram of And V is illustrated in Figure 6. The left panel shows the color–magnitude diagram for the region where And V stars dominate over field contamination, a circle of radius 170 pixels or 71 arcsec centered on And V (chosen as a compromise between maximizing the number of And V stars and minimizing field contamination; hereafter referred to as the And V region). The upper red giant branch of And V is visible in this left panel. The right panel displays the color–magnitude diagram for the portion of the frames where the And V contribution is negligible, that area outside a radius of 400 pixels or 168 arcsec from the center of And V (hereafter referred to as the field region). The And V giant branch is absent from the right panel. Instead, a broad swath of field stars covers most of the color–magnitude plane. Considering that the field region represents 5.5 times more area than the And V region, most of the stars that deviate from red giant branch in the left panel can be interpreted as field contamination. As a rough comparison, the colors and magnitudes of the And V stars in the left panel of Figure 6 are similar to those of the And III bright red giants (see Figure 5 of Armandroff et al. 1993). This similarity, which we will investigate carefully below, substantially strengthens the evidence that And V is indeed associated with M31.
A distance can be derived for And V based on the magnitude of the tip of the red giant branch (Da Costa & Armandroff 1990, Lee et al. 1993). Figure 7 shows luminosity functions for the And V region and for the field region (the same regions as used in constructing the color–magnitude diagrams in Figure 6). Based on the magnitude at which the And V luminosity function begins to rise strongly above that of the field, the magnitude of the red giant branch tip is 20.85 0.10; this value is supported by the apparent location of the tip in the color–magnitude diagram (Figures 6 and 8). For metal-poor systems such as And V (see below), the red giant branch tip occurs at = –4.0 (Da Costa & Armandroff 1990, Lee et al. 1993). We adopt an interstellar reddening for And V of E(–) = 0.16 0.03 from the Burstein & Heiles (1982) extinction maps. Assuming = 3.2E(–) and the E(–) to E(–) conversion of Dean, Warren & Cousins (1978), E(–) = 0.21 and = 0.30. The above values then yield a true distance modulus for And V of 24.55 0.12 and a distance of 810 45 kpc. These error estimates do not include any systematic uncertainty in the zeropoint of the adopted distance scale.
How does this And V distance compare with that of M31? The most directly comparable distance determinations for M31 are based on either red giant branch tip stars or RR Lyraes in the M31 halo or horizontal branch stars in M31 globular clusters. Such distance determinations are discussed in Da Costa et al. (1996) in order to compare the distances of M31 and And I. On the same distance scale as used here, the red giant branch tip stars (Mould & Kristian 1986) and RR Lyraes (Pritchet & van den Bergh 1988) agree well and yield an M31 distance of 760 45 kpc. On the other hand, the horizontal branch magnitudes for eight globular clusters observed by HST (Fusi Pecci et al. 1996) suggest an M31 distance of 850 20 kpc on the same scale. The Cepheid distance to M31 is 770 kpc (Freedman & Madore 1990); Lee et al. (1993) and Sakai et al. (1997) have shown that the Cepheid distance scale and the tip of the red giant branch scale are consistent. Our distance for And V of 810 45 kpc implies that And V is located at the same distance along the line of sight as M31 to within the uncertainties. And V’s projected distance from the center of M31 is 112 kpc; And I, II & III have projected M31-centric distances of 46, 144 and 69 kpc, respectively. The above line-of-sight and projected distances strongly suggest that And V is indeed associated with M31.
In order to investigate the stellar populations in And V, we have overplotted its color–magnitude diagram with fiducials representing the red giant branches of Galactic globular clusters that span a range of metal abundance (Da Costa & Armandroff 1990). For an old stellar population (as demonstrated below for And V), the color of the red giant branch is primarily determined by metal abundance. Figure 8 shows ,– color–magnitude diagrams for the And V and field regions, with fiducials for M15 ([Fe/H] = –2.17), M2 (–1.58), NGC 1851 (–1.16), and 47 Tuc (–0.71, dotted line). Most of the And V giants lie near or slightly redwards of the M2 fiducial. Thus, the mean metal abundance of And V is approximately –1.5. This metallicity is normal for a dwarf spheroidal (e.g., see Figure 9 of Armandroff et al. 1993).
In Figure 8, the region of the color–magnitude diagram substantially blueward of the lowest metallicity fiducial (M15) is empty. Since the data reach significantly deeper than the data, stars in this region of the color–magnitude diagram should be easily detected. Thus, no bright blue stars appear to be present in And V. Using the Bertelli et al. (1994) isochrones, we conservatively estimate that no stars younger than at least 200 Myr are present in the And V region of Figure 8. Local Group dwarf irregular galaxies contain many stars younger than 200 Myr. As a conservative example, LGS 3, which is considered a transition object with both dwarf spheroidal and dwarf irregular characteristics, has stars of age 100 Myr (Mould 1997). Thus, the lack of young stars is strong evidence that And V is a dwarf spheroidal and not a dwarf irregular. We hope to obtain deeper imaging of And V, particularly in the band, in order to place stronger limits on the youngest stars in And V.
Using the luminosities and numbers of upper asymptotic giant branch (AGB) stars in a metal-poor stellar system, one can infer the age and strength of its intermediate-age component (Renzini & Buzzoni 1986). Armandroff et al. (1993) have analyzed the luminosity functions of And I & III and deduced that the fraction of each galaxy’s luminosity contributed by an intermediate-age population is 10 10 percent (where intermediate age denotes 3–10 Gyr old on an age scale where the Galactic globular clusters are 14 Gyr old). Because And II contains upper AGB carbon stars (Aaronson et al. 1985), its intermediate-age component seems more substantial (though a quantitative analysis has not been performed). Intermediate-age components of varying prominence are present in the Galactic dwarf spheroidals, ranging from 75% of all stars in Carina to 0% in Ursa Minor (e.g., Da Costa 1998). Armandroff et al. (1993) used upper AGB stars with values between –3.8 and –4.6 to constrain the number of stars with ages between 3 and 10 Gyr. Observations of And I revealed 4 4 such stars; And III contains 3 2.9 such stars. For And V, the above limits correspond to 19.75 20.45. Examination of the And V luminosity function (Figure 7) indicates no significant excess of And V stars over the field in this magnitude interval. After appropriate color limits and field subtraction, there are 0.9 3.0 excess stars in the And V region within the upper AGB magnitude limits. Thus, And V does not contain significant numbers of upper AGB stars. Therefore, it does not have a prominent intermediate-age population; in this sense, it is similar to And I & III.
Because dwarf spheroidal galaxies are faint compared to the terrestrial night sky, investigation of their surface brightness profiles requires very careful attention to flat fielding and background subtraction (see Sec. 3.1 of Caldwell et al. 1992). The current data are not well suited to determination of And V’s surface brightness profile. However, it is possible to derive And V’s central surface brightness via large-aperture photometry in the core of And V. As a first step, we subtracted all stars brighter than = 22 from the And V image, since they are field contamination. We then performed digital aperture photometry with an aperture radius of 20 arcsec and a sky annulus near the edge of the image (193–204 arcsec). This yielded an And V apparent central surface brightness of 25.7 mag/arcsec2. This result is insensitive to the precise specification of the sky annulus, and changing the radius of the aperture by 5 arcsec results in surface brightness changes at the 0.1 mag level. And V has a fainter apparent central surface brightness than And I, II & III (24.9, 24.8, and 25.3 mag/arcsec2, respectively; Caldwell et al. 1992). And V probably eluded detection until now due to its very low apparent surface brightness. Our And V measurement corresponds to an extinction-free central surface brightness of 25.2 mag/arcsec2.
5 Discussion
The discovery of And V increases the number of M31 dwarf spheroidals from three to four. It changes somewhat the properties of M31’s satellite system, as discussed below. A more complete description of M31’s entourage of dwarf spheroidals will be presented once our survey and the necessary follow-up observations are complete.
The spatial distribution of the companions to M31 has been discussed by Karachentsev (1996). The discovery of And V changes somewhat the spatial distribution of the M31 satellites. The location of And V relative to M31, M32, M33, NGC 147, 185 & 205, and And I, II & III is shown in Figure 2. Curiously, And I, II & III are all located south of M31, while the three more luminous dwarf elliptical companions NGC 147, 185 & 205 are all positioned north of M31. Also, Karachentsev (1996) notes that there are more M31 companions overall south of M31 than north of M31. And V’s location north of M31 lessens both of these asymmetries. Karachentsev (1996) called attention to the elongated shape of the M31 companion spatial distribution (based on the previously known galaxies labelled in Figure 2, plus the more distant galaxies IC 1613, IC 10, and LGS 3, which he argues are also associated with M31) with axis ratio 5:2:1. And V is located within this flattened spatial distribution. With a projected radius from the center of M31 of 112 kpc, And V increases slightly the mean projected radius of the M31 dwarf spheroidals from 86 kpc to 93 kpc. Finally, Karachentsev (1996) also discussed morphological segregation among the M31 companions, with the dwarf ellipticals and dwarf spheroidals located closer to M31, and the spirals and irregulars on the outskirts (see also van den Bergh 1994). And V’s distance from M31 and our classification of this galaxy as a dwarf spheroidal support the presence of morphological segregation.
The discovery of nearby dwarf galaxies like And V augments the faint end of the luminosity function of the Local Group. We do not yet have a reliable value for And V, but it appears to be similar to that of And III ( = –10.2) since they have similar extinction-corrected central surface brightness. From a survey of nine clusters of galaxies, Trentham (1998) derived a composite luminosity function that is steeper at the faint end than that of the Local Group (see his Figure 2). He attributed the difference to poor counting statistics and/or incompleteness among the Local Group sample. The discovery of And V reduces slightly the discrepancy between the Local Group luminosity function and the extrapolation of Trentham’s (1998) function. However, many more galaxies would be required to equate the two functions (for example, the difference is 29 14 galaxies in Trentham’s faintest two bins, –13 –11).
Based on And V’s smooth stellar distribution, lack of H and IRAS emission, and absence of young stars in the color–magnitude diagram, we conclude that And V is a dwarf spheroidal galaxy. A deeper color–magnitude diagram, featuring a bluer color like , and an H i search would allow us to evaluate more carefully whether And V could be a transition object between dwarf spheroidals and dwarf irregulars, like LGS 3 but older (see Lee 1995, Mould 1997, Young & Lo 1997). Based on the available data however, And V is dwarf spheroidal companion to M31, and its stellar population is not obviously different from those of And I or III.
References
- (1) Aaronson, M., Gordon, G., Mould, J., Olszewski, E., & Suntzeff, N. 1985, ApJ, 296, L7
- (2) Armandroff, T., Boroson, T., De Veny, J., Heathcote, S., Jacoby, G., Lauer, T., Massey, P., Reed, R., Valdes, F., & Vaughnn, D. 1998, NOAO CCD Mosaic Imager User Manual (Tucson: NOAO)
- (3) Armandroff, T. E. 1994, in ESO/OHP Workshop on Dwarf Galaxies, ed. G. Meylan & P. Prugniel (Garching: ESO), 211
- (4) Armandroff, T. E., Da Costa, G. S., Caldwell, N., & Seitzer, P. 1993, AJ, 106, 986
- (5) Bertelli, G., Bressan, A., Chiosi, C., Fagotto, F., & Nasi, E. 1994, A&AS, 106, 275
- (6) Bremmes, T., Binggeli, B., & Prugniel, P. 1998, A&AS, 129, 313
- (7) Burstein, D., & Heiles, C. 1982, AJ, 87, 1165
- (8) Caldwell, N., Armandroff, T. E., Seitzer, P., & Da Costa, G. S. 1992, AJ, 103, 840
- (9) Condon, J. J., Cotton, W. D., Greisen, E. W., Yin, Q. F., Perley, R. A., Taylor, G. B., & Broderick, J. J. 1998, AJ, 115, 1693
- (10) Da Costa, G. S. 1998, in Stellar Astrophysics for the Local Group: A First Step to the Universe, ed. A. Aparicio & A. Herrero (Cambridge: Cambridge University Press), in press
- (11) Da Costa, G. S., & Armandroff, T. E. 1990, AJ, 100, 162
- (12) Da Costa, G. S., & Armandroff, T. E. 1995, AJ, 109, 2533
- (13) Da Costa, G. S., Armandroff, T. E., Caldwell, N., & Seitzer, P. 1996, AJ, 112, 2576
- (14) Davies, J. I., Disney, M. J., Phillipps, S., Boyle, B. J., & Couch, W. J. 1994, MNRAS, 269, 349
- (15) Dean, J. F., Warren, P. R., & Cousins, A. W. J. 1978, MNRAS, 183, 569
- (16) Ellis, G. L., Grayson, E. T., & Bond, H. E. 1984, PASP, 96, 283
- (17) Ferguson, H. C., & Binggeli, B. 1994, A&A Rev., 6, 67
- (18) Freedman, W. L., & Madore, B. F. 1990, ApJ, 365, 186
- (19) Fusi Pecci, F., Buonanno, R., Cacciari, C., Corsi, C. E., Djorgovski, S. G., Federici, L., Ferraro, F. R., Parmeggiani, G., & Rich, R. M. 1996, AJ, 112, 1461
- (20) Gallagher, J. S., & Wyse, R. F. G. 1994, PASP, 106, 1225
- (21) Jones, J. H. 1993, AJ, 105, 933
- (22) Karachentsev, I. 1996, A&A, 305, 33
- (23) Karachentseva, V. E., & Karachentsev, I. D. 1998, A&AS, 127, 409
- (24) Kennicutt, R. C. 1994, in The Local Group: Comparative and Global Properties, ed. A. Layden, R. C. Smith & J. Storm (Garching: ESO), 28
- (25) Landolt, A. U. 1992, AJ, 104, 340
- (26) Lasker, B. M., & Postman, M. 1993, in ASP Conf. Ser. 43, Sky Surveys: Protostars to Protogalaxies, ed. B. T. Soifer (San Francisco: ASP), 131
- (27) Lee, M. G. 1995, AJ, 110, 1129
- (28) Lee, M. G., Freedman, W. L., & Madore, B. F. 1993, ApJ, 417, 553
- (29) Massey, P., & Armandroff, T. E. 1995, AJ, 109, 2470
- (30) Massey, P., Armandroff, T., De Veny, J., Claver, C., Harmer, C., Jacoby, G., Schoening, B., & Silva, D. 1997, Direct Imaging Manual for Kitt Peak (Tucson: NOAO)
- (31) Mould, J. 1997, PASP, 109, 125
- (32) Mould, J., & Kristian, J. 1986, ApJ, 305, 591
- (33) Mould, J., & Kristian, J. 1990, ApJ, 354, 438
- (34) Nilson, P. 1973, Uppsala General Catalogue of Galaxies, Uppsala Astron. Obs. Ann. 6
- (35) Pritchet, C. J., & van den Bergh, S. 1988, ApJ, 331, 135
- (36) Reid, I. N., Brewer, C., Brucato, R. J., McKinley, W. R., Maury, A., Mendenhall, D., Mould, J. R., Mueller, J., Neugebauer, G., Phinney, J., Sargent, W. L. W., Schombert, J., & Thicksten, R. 1991, PASP, 103, 661
- (37) Reid, N., & Djorgovski, S. 1993, in ASP Conf. Ser. 43, Sky Surveys: Protostars to Protogalaxies, ed. B. T. Soifer (San Francisco: ASP), 125
- (38) Renzini, A., & Buzzoni, A. 1986, in Spectral Evolution of Galaxies, ed. C. Chiosi & A. Renzini (Dordrecht: Reidel), 195
- (39) Rice, W., Lonsdale, C. J., Soifer, B. T., Neugebauer, G., Kopan, E. L., Lloyd, L. A., de Jong, T., & Habing, H. J. 1988, ApJS, 68, 91
- (40) Sakai, S., Madore, B. F., & Freedman, W. L. 1997, ApJ, 480, 589
- (41) Schmidt, K.-H., & Boller, T. 1992, Astron. Nachr., 313, 189
- (42) Schombert, J. M., Bothun, G. D., Schneider, S. E., & McGaugh, S. 1992, AJ, 103, 1107
- (43) Stetson, P. B. 1987, PASP, 99, 191
- (44) Stetson, P. B., Davis, L. E., & Crabtree, D. R. 1990, in ASP Conf. Ser. 8, CCDs in Astronomy, ed. G. H. Jacoby (San Francisco, ASP), 289
- (45) Trentham, N. 1998, MNRAS, 294, 193
- (46) van den Bergh, S. 1972a, ApJ, 171, L31
- (47) van den Bergh, S. 1972b, ApJ, 178, L99
- (48) van den Bergh, S. 1974, ApJ, 191, 271
- (49) van den Bergh, S. 1994, ApJ, 428, 617
- (50) Weinberger, R. 1995, PASP, 107, 58
- (51) Yang, H., & Skillman, E. D. 1993, AJ, 106, 1448
- (52) Young, L. M., & Lo, K. Y. 1997, ApJ, 490, 710