Lognormal properties of SGR 1806-20
and the Possibility of a Quiescent Population of other SGR sources
Abstract
Monte Carlo simulations of long SGR event sequences based on lognormal distributions with a range of time intervals and intensity distribution parameters have been investigated. The main conclusions are that the majority of SGRs with properties similar to SGR 1806-20 have been detected but SGRs with mean waiting times much longer than SGR 1806-20 remain to be discovered. A large decrease in the probability for detection of an SGR source results from a relatively small increase in the distribution parameters obtained for SGR 1806-20. A new breed of experiments with very long observation times are required to search for this type of source.
Introduction
The lognormal properties of the soft repeater SGR1806-20 have been previously reportedsg-p07:cheng.b:95-nat-382-518 ; sg-p07:hurley.kj:95-apss-231-81 ; sg-p07:hurley.kj:94-aa-288-l49 . In particular, both the time interval between repeater events and the luminosity function of the source were fit with lognormal distributionssg-p07:aitchison.j:57-b-tld . This analysis used the data-base of 111 events detected by the International Cometary Explorer (ICE) missionsg-p07:laros.jg:87-apj-320-l111 .
While the present number of events observed from the other three sources sg-p07:kouveliotou.c:93-nat-362-728 ; sg-p07:norris.jp:91-apj-366-240 ; sg-p07:new-sgr-source does not allow any detailed analysis, the intervals between successive events of SGR 0526-66 sg-p07:golenetskii.sv:87-sal-13-3-166 is also suggestive of lognormal behaviour.
The relationship between the number of active (i.e observable) sources and the true number of SGRs in the galaxy is one which is the subject of some debate sg-p07:hurley.kc:94-apj-423-709 ; sg-p07:kouveliotou.c:92-apj-392-179 . If the time intervals between SGR events proves to be lognormal with a wide range of means and variances then there may be long quiescent periods where the source could be undetectable, leading to an underestimate of the population.
Simulations
Monte Carlo simulations of SGR event sequences with a variety of distribution parameters were generated. The simulations were performed using Octave 2.0.5 for UNIX. Randomly generated standard normal variates, , were transformed to lognormal variates using the relationship where is lognormally distributed with parameters and . The effect of the detector on the observations was simulated by rejecting events below a preset intensity level to mimic a threshold and by rejecting at random some predefined fraction of events to mimic a less than 100% live time.

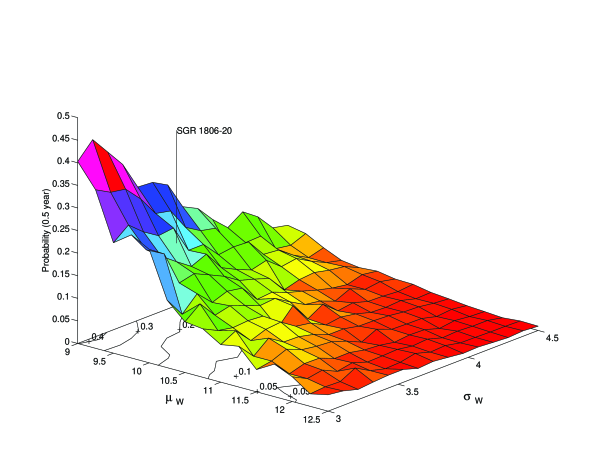
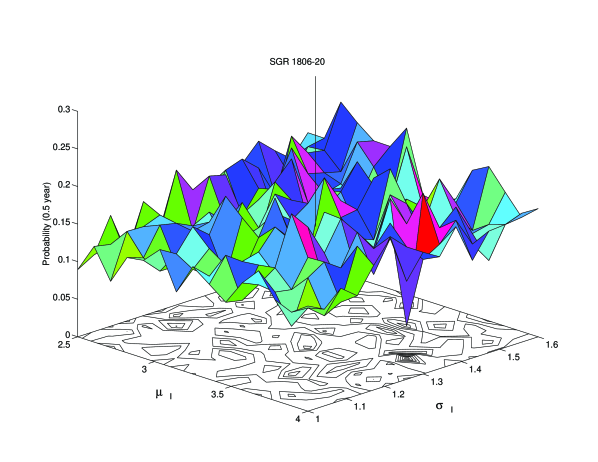
The parameters of the two lognormal density function which were fit to the distribution of recurrence intervals and intensity for SGR1806-20 were respectively , and , sg-p07:hurley.kj:94-aa-288-l49 . To investigate how the probability of observation with a given time interval depended on the the parameters for the waiting times ( and ) and the parameters for the event intensity ( and ), two large simulations were performed. In the first, the waiting time parameters were varied over a small range relative to the SGR1806-20 values (while the intensity distribution was fixed), forming a grid of cells, each with a different value for and but the same value for and . For each cell on the grid ten 500 year simulations were performed (as for the sequences produced in Figure 1) and the mean number of events per 0.5 year interval was determined. The second simulation was performed with varying and (the intensity distribution parameters) but it followed the same procedure - the region of parameter space to be explored was divided into a grid and ten 500 year simulations were performed at each grid point (each grid point having a different and but the same and ). The resulting distributions of probability of observation for each of the two grids are presented in Figures 2 and Figure 3.
Discussion
Figure 2 presents a surface plot of the probability of detecting an SGR source within 0.5 years, given that the event intervals are distributed with a lognormal probability and the intensity distribution is fixed to that observed for SGR1806-20. Note that the parameters for SGR1806-20 ( and ) an estimated probability of 30% for observation in 0.5 years and that the probability falls quickly with increasing and . For , which is equivalent to a mean of , the probability of observing the source in years has fallen to less than 5%.
In contrast, Figure 3 shows a much flatter more uniform behaviour over a similar variation in the intensity distribution parameters. Note that the parameters for SGR1806-20 again give us an estimated probability of 30% for observation in the 0.5 years of observation. The grainy nature of the surface is due to the much lower variation in probability across the range of intensities chosen (from 50% of SGR1806-20 to 300% for each distribution parameter).
The lognormal distribution arises in statistical processes whose completion depend on a product of probabilities, arising from a combination of independent events sg-p07:montroll.ew:82-pnasusa-79-3380 . Lognormal statistics have previously been used in connection with gamma-ray bursts sg-p07:brock.m:94-aip-307-672 ; sg-p07:mcbreen.b:94-mn-271-662 . In the context of this investigation the physical significance of this statistical behaviour may lie in the connection between SGRs and neutron stars where a similar statistical analysis was presented for the microglitches from the Vela pulsar. The time separation and the intensity of these small () frequency adjustments were both compatible with lognormal distributions, and there was no correlation between waiting time and intensity, just as observed with SGR1806-20 sg-p07:laros.jg:87-apj-320-l111 . This result, combined with the identification of X-ray point sources sg-p07:murakami.t:94-nat-368-127 ; sg-p07:rothschild.re:94-nat-368-432 embedded in plerion-powered SNR sg-p07:kulkarni.sr:93-nat-365-33 as counterparts to the SGR sources, suggests structural adjustments in neutron stars may be the cause of SGRs.
Conclusion
The activity of sources with mean recurrence times similar to or much longer than SGR 1806-20 was investigated using Monte Carlo simulations. The results of the simulations indicate that there could exist a significant population of SGRs with mean waiting times considerably longer than SGR1806-20 that remain undiscovered. Structural adjustments in neutron stars may be responsible for this behaviour. Finally, a new breed of experiments with very long observation times will be required to search for this type of source.
References
- (1) Hurley, K. J., McBreen, B., Rabbette, M., and Steel, S.: 1994b, A. & A. 288, L49
- (2) Cheng, B., Epstein, R. I., Guyer, R. A., and Young, A. C.: 1995, Nat. 382, 518
- (3) Hurley, K. J., McBreen, B., Delaney, M., and Britton, A.: 1995, Ap. & Space Sci. 231(1-2), 81
- (4) Aitchison, J. and Brown, J. A. C.: 1957, The Lognormal Distribution, Cambridge University Press, Cambridge
- (5) Laros, J. G. et al.: 1987, ApJ. 320, L111
- (6) Kouveliotou, C. et al.: 1993, Nat. 362, 728
- (7) Norris, J. P., Hertz, P., and Wood, K. S.: 1991, ApJ. 366, 240
- (8) Hurley, K. et al.: 1997, These Proceedings.
- (9) Golenetskii, S. V. et al.: 1987, Sov. Astron. Lett. 13(3), 166
- (10) Hurley, K. C. et al.: 1994a, ApJ. 423, 709
- (11) Kouveliotou, C. et al.: 1992, ApJ. 392, 179
- (12) Montroll, E. W. and Shlesinger, M. F.: 1982, Proc. Nat. Acad. Sci. 79, 3380
- (13) Brock, M. et al.: 1994, in G. J. Fishman, J. J. Brainerd, and K. Hurley (eds.), Gamma-Ray Bursts: Second Workshop (Huntsville), No. 307, p. 672, AIP
- (14) McBreen, B., Hurley, K. J., Long, R., and Metcalfe, L.: 1994, MNRAS. 271, 662
- (15) Murakami, T. et al.: 1994, Nat. 368, 127
- (16) Rothschild, R. E., Kulkarni, S. R., and Lingenfelter, R. E.: 1994, Nat. 368, 432
- (17) Kulkarni, S. R. and Frail, D. A.: 1993, Nat. 365, 33