Discovery of a New Quadruple Lens HST 1411+5211 111Based on observations with the NASA/ESA Hubble Space Telescope obtained at the Space Telescope Science Institute, which is operated by the Association of Universities for Research in Astronomy Inc., under NASA contract NAS 5-26555.,222This work used the facilities of the Canadian Astronomy Data Centre, operated by the National Research Council, Herzberg Institute of Astrophysics, Dominion Astrophysical Observatory, and partially funded by the Canadian Space Agency.
Abstract
Gravitational lensing is an important tool for probing the mass distribution of galaxies. In this letter we report the discovery of a new quadruple lens HST 1411+5211 found in archived WFPC2 images of the galaxy cluster CL140933+5226. If the galaxy is a cluster member then its redshift is . The images of the source appear unresolved in the WFC implying that the source is a quasar. We have modeled the lens as both a single galaxy and a galaxy plus a cluster. The latter model yields excellent fits to the image positions along with reasonable parameters for the galaxy and cluster making HST 1411+5211 a likely gravitational lens. Determination of the source redshift and confirmation of the lens redshift would allow us to put strong constraints on the mass distribution of the lensing galaxy.
keywords:
galaxies:fundamental parameters–gravitational lensing1 Introduction
Gravitationally lensed systems have a variety of astronomical uses. The most obvious is that they provide a direct probe of foreground mass distributions (stars, galaxies, and clusters). Systems which exhibit multiple images of a single source have an additional application; if the source varies, the system can be used to measure Hubble’s constant (Refsdal (1964)). Additionally, the statistics of multiple gravitational lenses can provide a direct and powerful test of cosmic structure formation theories (Turner et al (1984)).
To date eight quadruple lenses have been found, seven with observed lensing galaxies. Detailed modeling of these systems, has revealed the need for substantial external shear in two of the lenses and misaligment between the major axes of the light and matter in one of the lenses (Witt & Mao (1997)). Increasing the database of known quadruple lens will improve our knowledge of galaxy mass distributions, allowing us to put tight constraints on the mass-to-light ratios and hence the dark matter content in the inner few kiloparsecs. If sufficent lenses can be found over a large redshift range evolution of galaxy mass-to-light ratios could also be measured.
In this letter we report the discovery of a new quadruple lens system found in archived WFPC2 images. The primary lens, which is clearly identified, is a galaxy located near and quite likely in a cluster at . In §2 we discuss the observations and the optical appearance of the lensing galaxy. In §3 we give a brief review of gravitational lensing physics and apply one single-lens and two double-lens models to the data. Throughout the paper, we use and use H.
2 Observations
Observations of the cluster CL140933+5226 (3c295) were obtained on 25 July 1994 with the Wide-Field Planetary Camera on HST (images were obtained from the archive). The total integration time was 12600 seconds in 6 individual exposures using the F702W filter. The 6 images (archive IDs are u2c40a01t, u2c40a03t, u2c40a05t, u2c40a02t, u2c40a04t, u2c40a06t.c0h) were registered and combined using an average with cosmic ray (positive) outlier rejection.
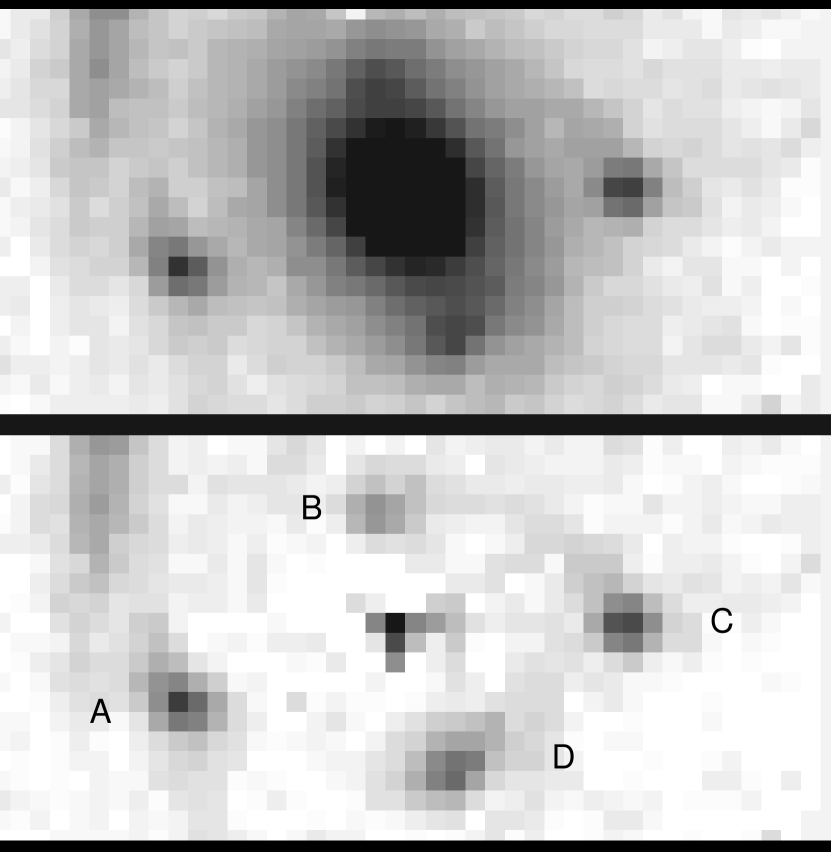
The images were reduced and analysed as part of a larger program to perform two-dimensional surface photometry to derive structural and photometric parameters for elliptical galaxies in clusters over a wide range of redshift (Schade et al. (1997)). Each fitted galaxy was inspected for goodness of fit and the presence of irregular residuals. The lensed background images were not recognized until the best-fit galaxy model was subtracted (see Figure 1).
The lensing galaxy is Number 162 from Table 6 of Dressler & Gunn (1992) but has no spectroscopically measured redshift. There is a published photometric redshift (Thimm et al (1994)) of (galaxy 103) based on nine narrow bandpasses spanning 4500Å - 8000Å. This redshift is suspect for several reasons. The first is that of the approximately 140 photometric redshifts determined in the paper galaxy 103 has the largest quoted uncertainty, two to three times higher than than most of the other galaxies. Secondly, the galaxy is classified as type Scd based on its spectral energy distribution (SED), however, the luminosity distribution in the HST images is inconsistent with a disk system and is an excellent fit to a deVaucouleurs profile (see below). These two points seem to imply that the SED of this galaxy is unusual and since the quoted redshift differs by less than 1.5 from the cluster redshift () we assume the galaxy is a cluster member at redshift for the rest of this paper.
The position of the lensing galaxy determined using the STSDAS ‘metric’ is (RA,Dec) = (14:11:19.6,52:11:29) (J2000). The best-fit observed parameters for the elliptical galaxy are half-light radius , ellipticity , position angle degrees and total magnitude F702W(AB). Using the assumed redshift of and the Coleman et al. (1980) spectral energy distributions (convolved with a filter response function and converted to as in Lilly et al. (1995)) we can convert to r(gunn). We find r(gunn) = F702W(AB) for a present-day elliptical spectral energy distribution. Thus our F702W(AB) magnitude corresponds to r(gunn) which agrees with the previously measured value of Dressler & Gunn (1992) of . Their value of for the half-light radius also agrees well with our value of although we find that an exponential disk (their profile classification) provides a very poor fit to this galaxy while a deVaucouleurs profile fits very well.
Assuming a redshift of leads to MB(AB) , R kpc, and restframe B central surface brightness (AB) mag arcsec-2. The adopted k-corrections are for a present-day elliptical galaxy and because the observed band corresponds to 4780Å in the galaxy’s rest-frame (not far from ) the effect of a reasonable amount of color evolution will be very small ( mag).
An estimate of the expected velocity dispersion can be made by assuming that this galaxy lies on the fundamental plane. Surface brightness evolution of elliptical galaxies (Schade et al. (1997)) with redshift will effect this estimate significantly. To compare with Jorgensen et al. (1996) we first transform the surface brightness to the Gunn -band. A present-day elliptical has (B-r)(AB) yielding a central surface brightness (r,AB) and r(gunn)=r(AB)+0.21 yielding . For a deVaucouleurs law the surface brightness at is and the mean surface brightness within is so that mag/arcsec2. Jorgensen et al. (1996) give, for the Gunn -band, to yield a value of . The fundamental plane we are using is defined at . If we assume a surface brightness evolution law such as that found in Schade et al. (1997) then we should correct the surface brightness by mag to bring it to its present-day (non-evolved) value. This yields .
Using our measured value of kpc allows us to read an estimate from Figure 1(b) of Jorgensen et al. (1996). If we ignore the evolution correction then we obtain which is equivalent to km sec-1. On the other hand the evolution corrected surface brightness yields km sec-1. The quoted errors are estimated from the scatter in Figure 1(b) of Jorgensen et al. (1996).
In Table 1 we show the positions of the four lensed background images relative to the lens galaxy (0,0). The positions and uncertainties were determined by measuring the locations on each of the six exposures and taking the mean and standard error. Also given are the F702(AB) magnitudes for each image. The uncertainties reflect only photon noise and not systematics due to galaxy subtraction errors (which may be significant for image D). The faintest image (D) is detected at a signal-to-noise of 12. The galaxy is located in WFC2 and the four images appear unresolved. Therefore, the source is likely to be a quasar.
3 Lens Models
3.1 Gravitational Lens Theory
In order to test the lensing hypothesis we have attempted to model the system with simple lens models. To briefly review, for a given source position the lensed image positions are given by the extrema of the virtual time delay surface (Blandford & Narayan (1986), Kochanek (1991)):
| (1) |
where () and () are angular coordinates in the image plane and source plane, respectively. The two-dimensional effective potential is:
| (2) |
where is the two-dimensional projected potential and , and are the angular diameter distances between the lens and source, observer and lens, and observer and source, respectively. The extremes of Eqn 1 occur when:
| (3) |
and the image magnification is given by:
| (4) |
3.2 Fitting the Data
The fitting procedure involved varying lens model parameters and source position until the best fit to the measured image positions was obtained. In our model fitting we decided to only use the lensed image positions and not the relative magnifications due to the high probability of microlensing by stars in the lens galaxy (Witt et al. (1995)). The goodnesss of fit was determined from:
| (5) |
where is the number of constraints, is the predicted value for the observable , and is the corresponding uncertainty. In our case (the four image positions). The number of degrees of freedom is DOF = where is the number of model parameters (including 2 for the source position).
The first model we tried was a single lens centered on the galaxy. We assumed an edge-on, axisymmetric, oblate, singular isothermal ellipsoid mass distribution. The projected mass distribution is (Keeton et al. (1997)):
| (6) |
where is the ellipticity (one minus the axis ratio) of the projected mass distribution, is the position angle of the projected major axis and is related to the mean line-of-sight velocity dispersion by:
| (7) |
where . The corresponding two-dimensional effective potential is (Kassiola & Kovner (1991)):
| (8) | |||||
where and are the polar coordinates of the angular position on the sky with respect to the galaxy center. The parameters , , and the source position are varied in the fitting procedure until the lens reproduces the observed lensed image positions as closely as possible. The best fit parameters along with are shown in Table Discovery of a New Quadruple Lens HST 1411+5211 111Based on observations with the NASA/ESA Hubble Space Telescope obtained at the Space Telescope Science Institute, which is operated by the Association of Universities for Research in Astronomy Inc., under NASA contract NAS 5-26555.,222This work used the facilities of the Canadian Astronomy Data Centre, operated by the National Research Council, Herzberg Institute of Astrophysics, Dominion Astrophysical Observatory, and partially funded by the Canadian Space Agency.. This model is a very poor fit to the data, the value of / DOF is unacceptably high, and the implied ellipticity for the galaxy is also higher than one would expect from its optical appearance.
The lensing galaxy is a member of a cluster whose center is located roughly perpendicular to the line joining images A and C. The second model we tried consisted of two singular isothermal spheres, one centered on the galaxy and one centered on the dominant cluster galaxy (offset is 8.66″ E and 39.76″ N from the primarly lensing galaxy) representing the cluster mass distribution. The effective potential in this case is:
| (9) |
This model produces a better but still very poor fit to the data ( / DOF = 21.19 / 4).
The galaxy appears elliptical in the WFPC2 image motivating us to try a model consisting of a singular isothermal sphere for the cluster and an isothermal elliptical potential for the galaxy.
| (10) |
This model provided a very good fit to the image positions ( / DOF = 1.58 / 2). Additionally, the inferred values for the line-of-sight velocity dispersions, and 135 km s-1 for and 3, respectively, are close to the predictions from the fundamental plane relationship (see §2). The cluster velocity dispersion is also within the range seen for other similar clusters. However, the inferred position angle of the mass distribution major axis differs by about from the major axis of the luminosity distribution. Attempts to force the mass to be oriented identically to the light produced values larger than model 2 (spherical galaxy) for non-zero ellipticity. Despite this, we conclude that the success of the simple double-lens models in fitting the image positions implies a high probability that HST 1411.3+5211 is a lensed system.
In fact the lens mass model must be more complex. For example, the individual galaxies in the cluster will cause deviations from a smooth mass distribution. However, until the redshift of the source is determined (and the redshift of the lens is verified) and more constraints are found (perhaps from VLBI imaging) there is little point in adding complexity to the lens model.
4 Conclusion
In this letter we report the discovery of a new quadruple lens HST 1411+5211 discovered in deep WFPC2 images of a galaxy cluster at . The redshift of the primary lensing galaxy is currently unknown but it is quite likely a member of the cluster. The images of the source appear unresolved in the WFC implying that the source is a quasar. We have successfully applied simple lens models to the data. Acceptable fits require both an elliptical galaxy mass distribution and an external cluster. Simpler models consisting of only a galaxy or spherical galaxy plus cluster do not provide viable fits to the data. The model galaxy velocity dispersion is consistent with the inferred value based on the fundamental plane relationship, however, the mass distribution appears to be misaligned from the light distribution by approximately . We conclude that HST 1411+5211 is a very strong candidate for a gravitationally lensed system. Determination of the source redshift and confirmation of the lens redshift would allow us to put strong constraints on the mass properties of the lensing galaxy.
Support for this work was provided by NASA through grant # HF-01069.01-94A.
References
- Blandford & Narayan (1986) Blandford, R. D. & Narayan, R. 1986, ApJ, 310, 568.
- Coleman et al. (1980) Coleman, G. D., Wu, C., & Weedman, D. W. 1980, ApJS, 43, 393.
- Dressler & Gunn (1992) Dressler, A. & Gunn, J. E. 1992, ApJS, 78, 1.
- Jorgensen et al. (1996) Jorgensen, I., Franx, M., & Kjaergaard, P. 1996, MNRAS, 280, 167.
- Kassiola & Kovner (1991) Kassiola, A. & Kovner, I 1993, ApJ, 417, 450.
- Keeton et al. (1997) Keeton, C. R., Kochanek, C. S. & Seljak, U 1997, ApJ, 482, 604.
- Kochanek (1991) Kochanek, C. S. 1991, ApJ, 382, 58.
- Lilly et al. (1995) Lilly, S. J., Le Fevre, O., Crampton, D., Hammer, F. & Tresse, L. 1995, ApJ, 455, 50.
- Refsdal (1964) Refsdal, S. 1964, MNRAS, 128, 307
- Schade et al. (1997) Schade, D. Barrientos, L. F., & Lopez-Cruz, O. 1997, ApJL, 477, L17.
- Thimm et al (1994) Thimm, G. J., Roser, H.J., Hippelein, H. & Meisenheimer, K. 1994, A&A, 285, 785.
- Turner et al (1984) Turner, E. L., Ostriker, J. P., & Gott, J. R. 1984, ApJ, 284, 1.
- Witt et al. (1995) Witt, H J. Mao, S. & Schechter, P. L. 1995, Apj, 443, 18.
- Witt & Mao (1997) Witt, H J. & Mao, S., 1997, MNRAS, 291, 211.
| Image | RA | Dec | F702(AB) |
|---|---|---|---|
| (arcsec) | (arcsec) | ( mag.) | |
| A | |||
| B | |||
| C | |||
| D |
![[Uncaptioned image]](/html/astro-ph/9806273/assets/x1.png)