A low-mass HI companion of NGC1569?
Abstract
High-sensitivity maps of the large-scale structure of atomic hydrogen in the starburst dwarf galaxy NGC 1569 show evidence for an HI cloud with a mass of , at a projected distance of 5 kpc from the parent galaxy. This cloud may be a condensation in a low-column-density HI halo or a companion galaxy/HI-cloud. NGC 1569 and its companion are connected by a low surface brightness HI bridge. At the edge of NGC1569, the HI bridge coincides with H arcs, also detected in soft X-rays.
Key Words.:
ISM: atoms - Galaxies: individual: NGC 1569 - interactions - irregular - kinematics and dynamics - starburst1 Introduction
NGC 1569 is a small Im type galaxy at a distance of (Israel 1988), and a probable member of the IC 342 group. Due to its low galactic latitude, the members of this group are heavily obscured. The number of known members is growing rapidly with the discovery of Dwingeloo 1 (Kraan-Korteweg et al. 1994), Dwingeloo 2 (Burton et al. 1996), MB 1 and 2 (McCall & Buta 1995) and MB 3 (McCall & Buta 1997).
With a diameter of 1.85 kpc, NGC 1569 is dominated by the aftermath of a burst of star formation (e.g. Israel & de Bruyn 1988, Vallenari & Bomans 1996). It suffers an outflow of gas (Waller 1991, Heckman et al. 1995 and references therein) and contains three very luminous, compact star clusters and several bright HII regions (Waller 1991).
The nearest neighbour to NGC 1569 is the dwarf irregular galaxy UGCA 92 at a projected distance of 60 kpc (Karachentsev & Tikhonov 1993), at approximately the same radial velocity (), and with an HI mass of (de Vaucouleurs et al. 1991). Emissionline-dominated dwarf galaxies such as NGC 1569 often, if not always, have nearby companions (Taylor et al. 1995, but see Taylor et al. 1996). The pair NGC 1569/UGCA 92 fits the selection criteria and overall properties given by Taylor et al. (1995), but the orbital timescale of this pair seems far too long to explain the recent starburst in NGC 1569 in terms of interaction with UGCA 92.
The overall HI distribution consists of a high-column-density ridge with three peaks and an ‘arm’ extending to the west (Reakes 1980, Israel & Van Driel 1990). Channel maps presented by Reakes (1980) also show weak emission south-east of the bright HI ridge, likewise visible in the low resolution map of Israel & Van Driel (1990). In this Letter, we concentrate on the nature of this emission and compare it with the extended HI haloes observed in the dwarf galaxies IC 10 (Shostak & Skillman 1989) and NGC4449 (Bajaja et al. 1994). A more complete analysis of the HI emission of NGC1569 is deferred to a forthcoming paper.
2 Observations and data reduction.
HI in NGC 1569 was observed with the WSRT during four 12-hour runs between November 1989 and January 1990. A total of 160 baselines ranging from 36 m to 2772 m were sampled at increments of 18 m. Because of missing short interferometer spacings, structures larger than a few arcminutes become increasingly diluted. However, the HI emission in individual velocity channels generally does not extend that far, so that the importance of this effect is minor.
The 2.5 MHz band was sampled by 128 independent frequency channels of 4.12 km s-1 width. The Hanning-smoothed velocity resolution is 8.2 km s-1. Maps at and resolution were produced by applying Gaussian weight functions of 843 m and 390 m width in the UV plane. The continuum was subtracted in each pixel by fitting a first-order polynomial to 48 line-free channels at both edges of the frequency band. In each channel map, the area containing line emission was identified manually and CLEANed down to half the r.m.s. noise. The rms noise in each channel map is 1.1 mJy per beam. The channel maps have not been corrected for primary-beam attenuation.
3 Results and analysis.
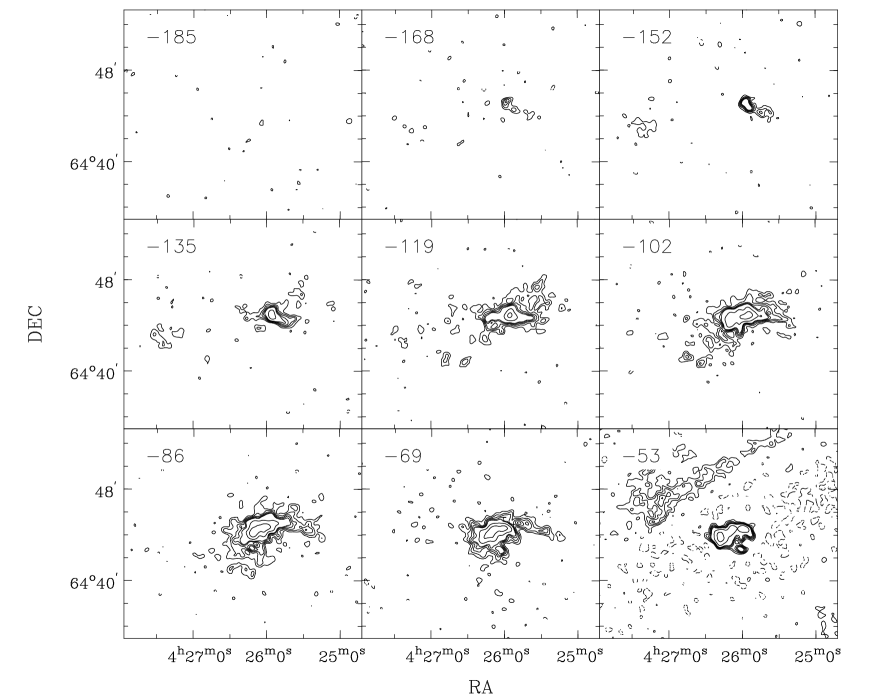

In the velocity range to , the channel maps show emission from NGC 1569 itself, and also from a second feature at , , best identified in the and maps in Fig. 1. Although the emission is weak (4 ), we consider it real. First, its location coincides with emission in Reakes’s independent maps. Second, we eliminated the possibility of solar interference by excluding all hour angles with the sun above the horizon. We also extracted the line profile in the direction of the feature from the raw data, i.e. before continuum subtraction and cleaning. In both cases, the emission persisted. We will refer to this feature as NGC 1569-HI. There is further weak emission between NGC 1569 and NGC 1569-HI in the velocity range to (also visible in Reakes’s channel map.
A second filamentary structure is visible in the channel maps with velocities -86 and -69 near , . It appears as a westward extension of the brightest emission. It is considerably closer to NGC 1569 than NGC 1569-HI and always connected to the brightest emission. For this reason, we treat it as a part of NGC 1569 and refer to it as the ‘western arm’. This feature was first noticed by Reakes (1980).
A map of the total HI column density is shown in Fig. 2, together with line profiles summed over selected regions. The emission of NGC 1569 is dominated by the high-column-density ridge and the western arm. NGC 1569-HI is east of the centre of NGC 1569, and has a FWHM velocity width of . The spatially-integrated emission of NGC 1569-HI and of the bridge over the velocity range to , is 12.4 , corrected for 16 primary-beam attenuation. The line flux of NGC 1569-HI itself is 6.3 , half of the total. If they are at a distance of 2.2 Mpc, the masses of NGC 1569-HI and of the bridge are each.

On the side of NGC 1569, the apparent connection with the bridge is located on the southern side of the galaxy. This region coincides with the location of two concentric shells described by Waller (1991).
Figure 3 shows a position velocity map along the curved dashed line in Fig. 2. Going westwards from NGC 1569-HI, ‘bridge’ emission occurs at progressively less negative velocities. The rotation of NGC 1569 occurs in the opposite sense.
We have scanned the red and blue POSS II plates on the Leiden ASTROSCAN, but failed to find an optical counterpart of NGC 1569-HI. The detection limit on the blue plates for a smooth disk of diameter should be about 26 mag arcsec-2; foreground stellar confusion may raise this somewhat. With 2.3 magnitudes foreground extinction (Israel 1988), we arrive at a limit of about 23.5 mag arcsec-2. As this is close to the median surface brightness of DDO dwarf galaxies (de Vaucouleurs et al. 1981), the optical non-detection of NGC 1569-HI therefore allows it to be a low-surface-brightness dwarf galaxy with a foreground extinction similar to that of NGC 1569, an intergalactic HI cloud without any stars, or a Galactic high-velocity cloud.
The central velocity of NGC 1569-HI is , which is in the extreme blue wing of the line-of-sight Galactic HI line profile (Hartmann & Burton 1997). The Galactic foreground is clearly present at throughout the field of view, but with a velocity width less than . However, we find no emission other than that of NGC 1569 and NGC 1569-HI at any velocity , even at resolution. We have summed the spectra of background point sources to look for absorption (Fig. 4). The upper limit to the optical depth per channel is 0.12 in the velocity range to . The corresponding upper limit to the HI column-density per channel of an extended component with spin temperature , is .

4 Discussion.
We first consider whether a Galactic origin is consistent with both the large velocity range of the eastern emission and its small angular size. The high-velocity-cloud complex closest to NGC 1569 is complex H, at a distance of 5 degrees (Wakker 1991) and is in the relevant velocity range of to . In Table 1 we compare the properties of NGC 1569-HI to those of HVC cores, the dwarf galaxy M81 dwA, and a sample of dwarf galaxies.
No distinction can be made from the column density. However, the linewidth of NGC 1569-HI is much higher than expected for small-scale structure in the Galactic foreground. The timescale for free expansion to double its present size is short, year, where is the distance in kpc. Together with the lack of other isolated HI clouds in the field of view, the apparent connection (bridge) with NGC 1569, and the relatively high contrast with the surroundings, leads us to conclude that NGC 1569-HI is not a condensation in the Galactic foreground.
Although NGC 1569 shows the signs of a global outflow of gas (see e.g. Heckman et al. 1995), the mass of NGC 1569-HI and the bridge ( each) as well as their location projected along the major axis all rule out that they result from this outflow.
Extended, low-column-density HI haloes have been detected in a number of late type galaxies (Huchtmeier & Richter 1982). NGC 1569-HI and the western arm are possibly high density regions in a similar halo. The only evidence for extended emission with a column density from the present data is the emission in the north-west of NGC 1569. Its possible counterpart, symmetric in position and in velocity with respect to the centre of NGC 1569 should appear in the channel maps near . Negative sidelobes of Galactic foreground emission inhibit the detection of an extended, low-surface-brightness component (see e.g. Fig. 3). NGC 1569-HI cannot be identified with the symmetric counterpart of the extended emission in the northwest, because its velocity is lower. An extended HI halo is sometimes inferred from the difference in flux measured by an interferometer and a single dish radio telescope. However, single dish observations are heavily contaminated by the large column of Galactic HI. Furthermore, there is no evidence for an HI halo in the maps presented by Reakes (1980).
The apparent retrograde rotation of NGC 1569-HI does not exclude a prograde orbit, e.g. as a part of an extended HI disk. High resolution observations of the haloes of IC 10 (Shostak & Skillman 1989) and NGC 4449 (Bajaja et al. 1994) show a reversal of the velocity field. Such a reversal can be the result of a warped HI disk bending through the plane of the sky. However, the warp angle must then be larger than the inclination angle, which is for NGC 1569 (Israel 1988). There is no indication from the HI distribution that such an extreme warp exists in NGC 1569.
As it is unlikely that NGC 1569-HI is an extension of the rotating disk of NGC 1569, it is either primordial gas which has not yet fallen into NGC 1569, or a separate object in a close encounter with NGC 1569. The difference between these interpretations is mainly semantic. No definite choice can be made since there is no optical identification of NGC 1569-HI. However, some general remarks can be made.
If NGC 1569-HI is a part of an HI halo which settles into the inner disk of NGC 1569 on a cosmic timescale, its small distance to NGC 1569 suggests that its is slowly spiraling inwards. This implies a relatively circular orbit, as opposed to a parabolic or hyperbolic orbit expected for an encounter. Assuming a circular orbit, a lower limit to the mass of NGC 1569 can be derived. As the projected distance, , and radial velocity difference are lower limits to the actual distance and relative velocity, the minimum mass of the system if it is to be bound, must be . This lower limit, which is absolute for a circular orbit, is an order of magnitude higher than the estimated dynamical mass of NGC 1569 within a radius of 1.3 kpc, where the rotation velocity is maximal (Reakes 1980). The lower limit to the total mass results in a strong upper limit to the HI mass to total mass ratio within 5 kpc, as opposed to the observed within a radius of 1.3 kpc. The upper limit for the HI mass to total mass ratio is comparable to the ratio in dark matter dominated dwarf irregular galaxies such as DDO 154 (Carignan & Beaulieu 1989) at the last measured point of the rotation curve. However, the HI mass to total mass ratio is relatively constant with radius because the HI partial rotation curve mimics the total rotation curve to a high accuracy (Carignan & Beaulieu 1989, Broeils 1992). The combination within 1.3 kpc and within 5 kpc, is exceptional. This contradiction is solved if the system is not gravitationally bound.
The velocity difference between NGC 1569 and NGC 1569-HI is 40 , their projected separation is 5 kpc, and their HI mass ratio is about 0.06 (excluding the bridge). Corresponding values for other pairs of dwarf galaxies studied by Taylor et al. (1995) are , 30 kpc, and 0.2 respectively. Thus, NGC 1569 and NGC 1569-HI appear to be a close, but not an exceptional pair.
The virial mass of NGC 1569-HI is . If the HI mass ratio is representative for the total mass ratio, the ratio of the tidal radius to their actual separation is 0.4. Judging from their projected separation, NGC 1569-HI almost fills its tidal radius. Tidal forces exerted by NGC 1569 may thus explain the HI bridge. However, the western arm is unlikely to be the result of tidal forces exerted by NGC 1569-HI given the small mass and the apparent retrograde orbit of NGC 1569-HI. This leaves the western arm unexplained. If both are part of an outer halo which is not in equilibrium, as was suggested for IC 10, this problem does not exist.
It is evident from Fig. 3 that the velocity structure of NGC 1569-HI and the bridge is well ordered. It is therefore a coherent structure and not a chance superposition of multiple clouds. The timescale on which this structure evolves is in the order . It is therefore a transient feature. Shostak & Skillman (1989) found a structure similar to the HI bridge and a disturbed location where this “plume” meets the disk of IC 10. This was used as an argument in favour of interaction. A similar argument can be made for NGC 1569.
The present data do not unequivocally show that the bridge is falling into NGC 1569, but we may note some indications that this is so. First, the presumed contact region exhibits chaotic kinematics (see Heckman et al. 1995 for and our forthcoming paper for HI kinematics). Second, the arcs and the extended X-ray feature described by Heckman et al. (1995) are found in the same direction. However, filaments are common in starburst galaxies, while a galactic wind is still needed to obtain the high Mach number required to heat the gas to X-ray temperatures. Finally, we note that the centre of the starburst is offset to the south from the high column density HI ridge, i.e. towards the bridge. It is tempting to speculate about a possible connection between recent bursts of star formation and infalling material.
| N1569HIa | HVC coreb | M81 dwAc | LSY dw.d | |
|---|---|---|---|---|
| 0.76 - 5 | ||||
| (kpc) | 0.8 - 3.4 | |||
| 2.5 - 42 | ||||
| 50 | 5 | 19 | 20 - 36 | |
| - | 24.4 | 23.4 - 25.2 |
Note : : distance in Mpc; : HI diameter (kpc); : peak HI column density in ; : HI FWHM line width (); : mean surface brightness in B (); References: a. This work; b. Wakker & Schwarz (1991); c. Sargent et al. (1983); d. range of the sample of 9 faint dwarfs in Lo et al. (1993).
Acknowledgements.
We wish to thank R. Sancisi, W.B. Burton and P. Van der Werf for their useful comments about this paper and E. Deul for his help with the astroscan.References
- (1) Bajaja E., Huchtmeier W.K., Klein U., 1994, A&A 285,385
- (2) Broeils A.H., 1992, A&A 256,19.
- (3) Burton W.B., Verheijen M.A.W., Kraan-Korteweg, R.C. et al., 1996, A&A 309,687.
- (4) Carignan C., Beaulieu S., 1989, ApJ 347,760.
- (5) Della Ceca R., Griffiths R.E., Heckman T.H., Mackenty J.W., 1996, ApJ 469,662
- (6) de Vaucouleurs G., de Vaucouleurs A., Buta R., 1981, AJ 86,1429
- (7) de Vaucouleurs G., de Vaucouleurs A., Corwin H.G. et al., 1991, Third Reference Catalogue, Springer Verlag, N.Y.
- (8) Hartmann D., Burton W.B., 1997, Atlas of galactic neutral hydrogen, Cambridge University Press
- (9) Heckman T.M., Dahlem M. Lehnert M.D., et al., 1995, ApJ 448,98
- (10) Huchtmeier W.K., Richter O.-G., 1982, A&A 109,331
- (11) Hunter D.A., Hawley W.N., Gallagher III J.S., 1993, AJ 106,1797
- (12) Israel F.P., 1988, A&A 194,24
- (13) Israel F.P., De Bruyn A.G., 1988, A&A 198,109
- (14) Israel F.P., Van Driel W., 1990, A&A 236,323
- (15) Karachentsev I.D. and Tikhonov N.A., 1993, In: Meylan G., Prugniel P. (eds.) proceedings ESO/OHP Workshop “dwarf galaxies” p. 109
- (16) Kraan-Korteweg R.C., Loan A.J., Burton W.B., et al., 1994, Nat. 372, 77
- (17) Lo K.Y., Sargent W., Young K., 1993, AJ 106,507
- (18) McCall M.L., Buta R.J. 1995, AJ 109, 2460
- (19) McCall M.L., Buta R.J. 1997, AJ 113, 981
- (20) Reakes M., 1980, MNRAS 192,297
- (21) Sargent W.L.W., Sancisi R., Lo K.Y., 1983, ApJ 265,711
- (22) Shostak G.S., Skillman E.D., 1989, A&A 214,33
- (23) Taylor C.L., Brinks E., Grashuis R.M., et al. , 1995 ApJS 99,427
- (24) Taylor C.L., Brinks E., Grashuis R.M., et al. , 1996 ApJS 99,427
- (25) Vallenari A., Bomans D.J., 1996, A&A 313,713
- (26) Wakker B.P., Schwarz U.J., 1991, A&A 250,484
- (27) Waller W.H., 1991, ApJ 370,144