2 Joint Astronomy Centre, 660 N. A’ohoku Pl., Hilo, Hawaii, 96720, USA
3 Nordic Optical Telescope, Apartado 474, E - 38700, Santa Cruz de la Palma, Canary Islands, Spain
The obscured circumnuclear region of the outflow galaxy NGC 3079
Abstract
Images of the central region of the almost edge-on Sc galaxy NGC 3079 in the , and -bands and in the S(1) line of molecular hydrogen are presented. The inner few kiloparsecs of NGC 3079 exhibit a large range of near-infrared colours caused by varying contributions from direct and scattered stellar light, emission from hot dust and extinction gradients. Our results show that interpretation of the observed light distribution requires high-resolution imaging in order to separate the different effects of these contributions.
The central 1′′ (87 pc) of NGC 3079 suffers a peak extinction . Its extremely red near-infrared colours require the additional presence of hot dust, radiating at temperatures close to 1000 K. The least reddened eastern parts of the bulge require either a contribution of 20% of light in the -band from a younger population in a stellar bar or a contribution of 20–30% from scattered starlight; scattered light from a nuclear source would require a less likely emission spectrum for that source.
The nucleus is surrounded by a disk of dense molecular material, extending out to a radius of about 300 pc and with a central cavity. Bright H2 emission and emission from hot dust mark the hole in the CO distribution and trace the inner edge of the dense molecular disk at a radius of 120 pc. Less dense molecular gas and cooler dust extend out to radii of about 2 kpc. In the inner few hundred parsecs of NGC 3079, H i spin temperatures appear to be well below 275 K and the CO-to-H2 conversion factor has at most 5 of the Galactic value. An underabundance of H2 with respect to CO is consistent with theoretical predictions for environments subjected to dissociative shocks, where reformation of H2 is impeded by high dust grain temperatures. The overall molecular gas content of NGC 3079 is normal for a late-type galaxy.
Key Words.:
galaxies: active – individual: NGC 3079 – ISM – nuclei; infrared: galaxies1 Introduction
NGC 3079 is a bright and highly inclined late-type spiral galaxy (SB(s)c: De Vaucouleurs et al. 1976; Sc(s)II-III: Sandage Tammann 1987) accompanied by the lesser galaxies NGC 3073 and MCG . The group distance is estimated to be 16 Mpc for (Irwin Seaquist 1991). For consistency with Hawarden et al. (1995; hereafter HIGW), we will assume a distance of 18 Mpc (Aaronson Mould 1983) in the remainder of this paper. Some basic properties of NGC 3079 are given in Table 1.
On both sides of NGC 3079, strong lobes of radio continuum emission extend several kiloparsecs from the plane along the minor axis (De Bruyn 1977; Seaquist et al. 1978; Duric et al. 1983; Duric Seaquist 1988), in the inner parts associated with filamentary H and [N ii] emission interpreted as the signature of a powerful outflow from the nucleus with velocities of up to in a cone of large opening angle (Heckman et al. 1990; Filippenko Sargent 1992; Veilleux et al. 1994). In contrast to the radio lobes, the optical filaments are only seen at the eastern side of the disk, indicating that the western side suffers higher extinction.
In the disk of NGC 3079, radio continuum emission extended over (kpc) surrounds a very compact (size about 1 pc) radio core (Seaquist et al. 1978; Irwin Seaquist 1988; Duric Seaquist 1988; Baan Irwin 1995) which agrees in position with an X-ray point source (Fabbiano et al. 1992) and strong H2O masers (Henkel et al. 1984 and references therein). Based on VLBI observations, Irwin Seaquist (1988) argued that the outflow originates from a central compact object rather than from a more extended starburst region.
| Typea | Sc(s)II–III |
|---|---|
| R.A. (B1950)b,c | |
| Decl.(B1950)b,c | |
| b,d | 1125 (H i) – 1145 (CO) |
| Distance | 18 Mpc |
| Inclination | |
| Position angle | |
| Luminosity | |
| Luminosity Nucleus | |
| Scale | 11.5′′/kpc or 87 pc/′′ |
a RSA (Sandage Tammann 1987)
b H i observations, Irwin Seaquist (1991)
c Baan Irwin (1995)
d Sofue Irwin (1992); Braine et al. (1997)
e Aaronson Mould (1983), for Mpc-1
f Fabbiano et al. (1992)
g Hawarden et al. (1995)
In NGC 3079, CO emission is concentrated in the centre (Irwin Sofue 1992; Sofue Irwin 1992). Out to radii of (470 pc), the molecular gas exhibits solid body rotation with a maximum rotational line-of-sight velocity of . The steep velocity gradient and the finite angular resolution of about 4′′ create the false impression of an unresolved CO emission peak at the nucleus. However, position-velocity maps (in particular Fig. 5b in Sofue Irwin 1992) show the existence of a small nuclear hole in the CO distribution, similar to the situation found in the equally highly inclined galaxy NGC 253 (Israel et al. 1995).
Duric Seaquist (1988) explained the then-observed phenomena with a model in which the observed radio structures result from a strong nuclear wind focussed into a bipolar outflow by a dense circumnuclear disk. This model was supported by HIGW on the grounds that the observed properties of the centre of NGC 3079 cannot be explained by a (circum)nuclear starburst, but rather point to the existence of an active nucleus vigorously interacting with its gaseous surroundings. HIGW conclude that the H2 vibrational line emission is not excited by X-rays or UV photons. Instead, they argue that kinetic energy of fast shocks generated by wind impact on the molecular gas disk is converted into H2 line mission, with the low efficiency expected for such a mechanism, and that the extended mid-infrared emission from NGC 3079 arises from shock-heated dust.
HIGW did not obtain images of the H2 distribution, and only barely resolved its emission. Because NGC 3079 is seen almost edge-on, its centre suffers considerable extinction (Forbes et al. 1992; Veilleux et al. 1994), leading to some uncertainty in the near-infrared luminosities discussed by HIGW. In order to verify the conclusions reached by them, a further investigation of the nuclear H2 emission and the properties of the central region of NGC 3079, by high resolution imaging of the , and -band continuum emission as well as the S(1) H2 line emission, was deemed desirable.
2 Observations
2.1 Broad-band images
The , and -band images were obtained on 1994 May 18at UKIRT under non-photometric conditions using IRCAM3, the UKIRT near-infrared imaging camera, through standard , and -band filters (1.25, 1.65 and 2.2 m respectively), on a Santa Barbara Research Corporation InSb array of 256256 pixels, with a pixel scale of on the sky, resulting in a field. The image of a foreground star at , was used to align the different frames. The flux calibration of the individual images was derived from the synthetic aperture photometry by Forbes et al. (1992), using their largest () aperture values in order to minimize the effects of positional differences. Consistency checks using their smaller aperture values revealed deviations of up to 3%, which can be regarded as the uncertainty of our flux calibration procedure. The effective resolution of the final images, measured from the foreground star referred to above, is
2.2 Molecular hydrogen vibrational emission line images
The H2 S(1) images were obtained in May 1992 using the near-infrared Fabry-Perot imaging spectrometer FAST (Krabbe et al. 1993) at the Cassegrain focus of the 4.2 m William Herschel Telescope (WHT) at Roque de los Muchachos at La Palma, Spain. The FAST camera used a Santa Barbara Reserarch Corporation 5862 InSb array with a pixel scale of and a field of about . Dispersion was provided by a Queensgate scanning Fabry-Perot interferometer with a spectral resolution () of 950 at m (corresponding to a velocity resolution of 315 km s-1), used in tandem with a = 45 cold circular variable filter (CVF) as order sorter. The seeing was about . Because the S(1) line has a full width at 20 intensity of , we took line images not only at the systemic velocity but also at velocity offsets of , as well as line-free continuum images at velocity offsets , i.e. at five velocity settings in total. Several sets of images were obtained with exposure times of sec each. Sky frames were obtained at a position 6 east of the nucleus. After subtraction of the dark current, the individual frames were flatfielded and sky-subtracted. The resulting line-plus-continuum images were corrected for atmospheric transmission and instrumental response with the use of the standard stars HR 3888 and HR 4550. Finally, the mean of the continuum on either side of the line (velocity offsets ) was subtracted. The resulting line images were co-added, yielding line flux maps with a total integration time of 1650 sec at the systemic velocity and 750 sec each for the images offset in velocity by .
We also obtained images at the wavelengths of Br (m) and [Fe ii] (m), centered on the systemic velocity under good conditions (seeing ). Total integration times were 2000 sec and 1500 sec respectively. Resulting r.m.s. noise figures are W m-2 sr-1 for Br and W m-2 sr-1 for [Fe ii].
No [Fe ii] emission was detected, but the Br image shows weak emission centred on the nucleus, just above the noise level and extended over about 3′′. The total measured flux of about W m-2, is reasonably consistent with the marginal detections by HIGW: W m-2 in a large aperture CVF spectrum and W m-2 in a 3′′ UKIRT CGS4 aperture. Taken at face value, these rather uncertain data suggest the presence of weak and diffuse ionized hydrogen extended over the inner kpc, and somewhat concentrated near the nucleus.
3 Results
3.1 Broad-band images
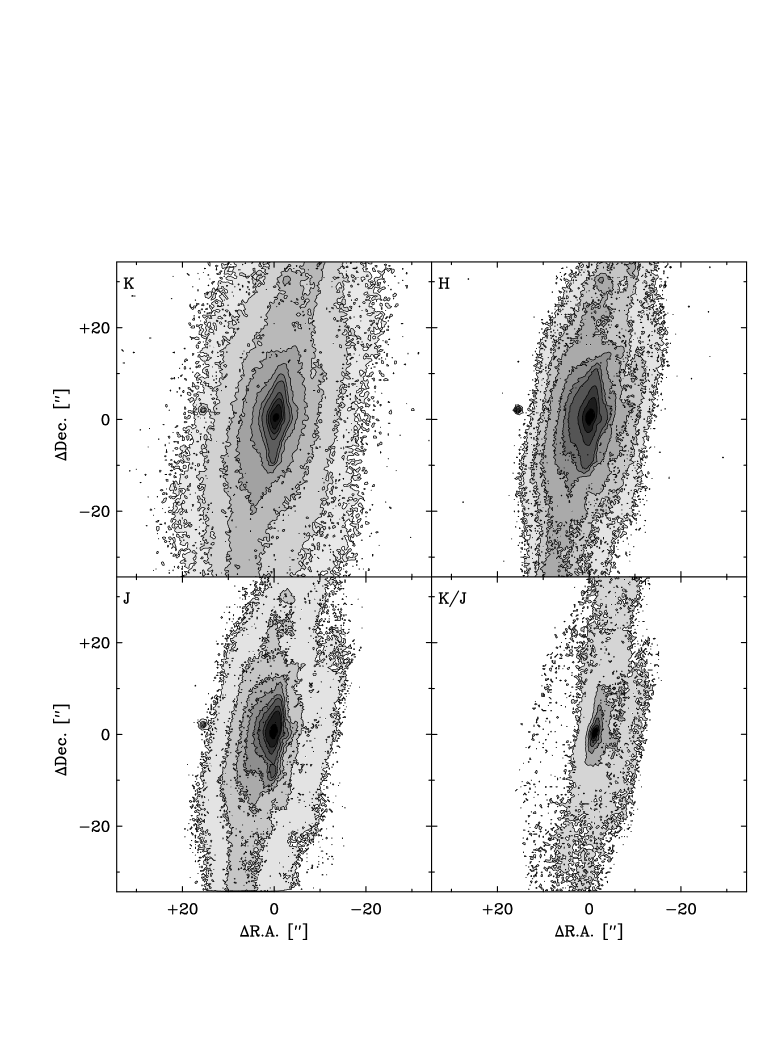
The , , and -band images and a image are reproduced in Fig. 1.
The differences between the broad-band images primarily reflect the wavelength-dependent effects of extinction. The strong east-west asymmetry, most clearly seen in the -band image, is caused by dust extinction in the western half of the galaxy. With increasing wavelength, the light distribution becomes more symmetrical and more pronouncedly peaked, although symmetry is not perfect even at -band, suggesting obscuration of the nucleus even at this wavelength. The and images indicate the presence of at least two dust lanes: one cuts off the bulge light, the second betrays its presence by bays of reduced emission in the -band image, corresponding to an extended reddened zone in the image about 10′′ west of the nucleus, parallel to the midplane. The relatively well-defined western edge in the -band image may represent a third dust lane, seen as a thin layer of enhanced reddening between the other two dust lanes in the image. The north-south asymmetry apparent in the images suggests higher extinction north of the nucleus than south of it. East of the nucleus, the bulge light appears to suffer less extinction, and a bulge with a peanut-shaped light distribution is apparent (Shaw et al. 1993). The asymmetries along the major and along the minor axes are further illustrated by the near-infrared colour profiles shown in Fig. 2.

Lawrence et al. (1985) noted a displacement of the 10m and radio peak (presumably marking the true nucleus) from the visual peak by 5′′ in a northwestern direction. The near-infrared images at wavelengths intermediate between 10m and the visual show the same effect but, as expected, to a lesser degree. Going from to , the intensity peak shifts to the west by .
All three images (especially the -band image) show a secondary maximum 8′′ south of the main peak. The lower resolution 0.8 mm continuum map by HIGW shows the central source to be elongated in this direction, and the radio continuum maps by Duric et al. (1983) and Baan Irwin (1995) show enhanced emission at this position, with a GHz radio flux density of about 0.5 mJy. The apparently flat radio continuum spectrum, implying mostly thermal emission, is consistent with the intensity of the bright H+[N ii] knot visible in Fig. 1 of Veilleux et al. (1994) at this position. The object thus appears to be a massive star forming region; its location, especially in the H+[N ii] image, suggests that it is part of a spiral arm, and at a projected distance from the nucleus of about 700 pc. Its radio intensity implies the presence of a few hundred OB stars. The -band image contains a few more, weaker peaks farther out in the disk of NGC 3079 (e.g., at , ), which may likewise represent concentrations of luminous stars.
3.2 H2 images
In Fig. 3 we show the line surface brightness maps of the H2 emission from the centre of NGC 3079. As the velocity separation is only 10 less than the velocity resolution, the “channel” images are largely independent. The H2 distribution has a relatively sharp western edge and a more wispy eastern boundary. The peak of the total H2 emission is located north of the continuum peak marked by a cross in Fig. 3. This offset is real and accurate, since both the continuum and line images are extracted from the same data set. In Fig. 4 we further illustrate this offset by plotting the outline of the total H2 emission on a contour map of the 2.13 m continuum distribution.
The peak of the H2 emission is found at accurately the same position in all of the three channels maps of Fig. 3. Because the emission line is widest at this position, we identify it with the dynamical centre of the H2 emission. This position thus likely marks the obscured nucleus of NGC 3079. The position offset of the -band continuum nucleus towards the south indicates that extinction still plays a role in this wavelength region and that the H2 emission may suffer less extinction than the continuum.
The H2 distribution in Fig. 3 can be schematically described by a bright central component superposed on more extended emission. The bright central component measures 32′′ (260175 pc) in the integrated H2 map. In the central channel, this component is elongated with diameters of at position angle , nominally deviating from the extended disk position angle. At the outlying velocities, the peak surface brightness of this component has dropped by a third and the shape is more circular with a diameter of . Thus at the outlying velocities, the central bright H2 component is less extended in the plane of the galaxy and more extended perpendicular to the plane than at the systemic velocity. This result will be discussed further in Sect. 4.2.2.
The more extended emission is fainter. In integrated H2 it measures along , closer to the position angle of the disk (Table 1) In the perpendicular direction, its extent is hard to determine because of the dominating presence of the central component. The channel maps show the extended component to be rotating, with the south receding and the north approaching.
The integrated intensity of the H2 S(1) line emission in Fig. 3 is W m-2, which is about two thirds of the line strength found by HIGW from spectrophotometry.
4 Analysis and discussion
4.1 Continuum colours
As noted by HIGW, the stellar absorption spectrum of the nucleus at m and the overall spectral shape of the near-IR continuum suggest that out to m the radiation from the centre of the galaxy is dominated by emission from late-type (super)giants in the bulge. Near-infrared photometry was published by Lawrence et al. (1985), Willner et al. (1985) and Forbes et al. (1992). The colours derived by Forbes et al. (1992) suggest relatively low extinction, but this must be interpreted as a lower limit because these authors used fairly large apertures, and, more importantly, first aligned the peaks of their , and -band images, while we have noted in Sect. 3.1 that these are actually displaced from one another. The colours measured by Willner et al. (1985) suggest that the central 6′′ of NGC 3079 suffers a high extinction (their Figs. 2 and 3). HIGW analysed the available data and concluded to a “best” value for the central 6′′.
We have used our accurately aligned , and -band images to produce the two-colour diagram shown in Fig. 5, and we analyse the colours of the various regions in NGC 3079 in the following sections. The curves marked “screen” and “mixed” in this figure indicate the effects upon the observed colours of extinction by respectively foreground dust and dust uniformly mixed with the stellar population. In the former case, , while in the latter case, , where and are respectively the observed and intrinsic intensities. A Galactic extinction curve is assumed.
4.1.1 The outer bulge
The colour observed from the outer bulge (i.e., positions 4′′ or more east of the disk) agrees well with that of typical bulges, but the colour is about bluer. These results are similar to those found by HIGW in a aperture. From the observed -band absorption features, HIGW determined that the mean spectral type of the bulge population dominating the -band light is M0III, reasonably consistent with the “bulges” zeropoint in Fig. 5 and with the observed colour of the eastern bulge in NGC 3079. This leaves the blueness of the eastern bulge in to be explained. HIGW note that blue colours also prevail at wavelengths shorter than m and that these colours point to the contribution of young stars at m and shorter wavelengths. There are several possibilities.

-
1.
The blueness of the eastern bulge could be due to a contribution of scattered light from a nuclear source. As shown in Fig. 5, scattered power law emission with around m would require , and would have to contribute about 35% of the -band emission of the eastern bulge. However, the power law nuclear emission found in active galaxies typically has a much lower exponent around , e.g., in the sample of 34 Seyferts of Kotilainen et al. (1992), where no object has .
-
2.
The bulge of NGC 3079 is peanut-shaped (Fig. 1). This is usually taken as the signature of a stellar bar (Combes & Sanders 1981; Kuijken & Merrifield 1995). Bars frequently harbour enhanced star formation, and the bar potential allows young stars in the bar to migrate into the peanut-like features. If this explanation is correct, these stars would have to contribute about 20% of the -band light on the assumption of a characteristic spectral type A0V.
-
3.
Alternatively, the relative blueness of the the eastern bulge could be due to a contribution by scattered starlight. For instance, a reddening corresponding to = 2.7 mag (i.e. 50% light loss at J) combined with a contribution of scattered light at J will match the observed colours to the typical bulge colour. If instead we assume extinction by dust mixed with stars, (75% light loss at J) and a slightly smaller contribution by scattered light (20% at J) will also explain the observed colours. Scattering of blue light from the young disk population, contributing about 20% of the observed -band light likewise is a viable alternative, and consistent with the overall optical blueness, (RC2), of this edge-on galaxy. For various reasons (see Kuchinski Terndrup 1996) these are only crude estimates; nevertheless they all suggest that scattered light contributing of the order of 20–30% to the observed J-band emission of the outer bulge is required to explain its near-infrared colours.
4.1.2 Disk and western dust lane
In the disk away from the central part of NGC 3079, the colours of the stellar population must correspond to a mean spectral type earlier than those indicated by the “bulges” zeropoint, i.e. close to those of the “main-sequence line” in Fig. 5. If, for instance, a mean spectral type A0 is assumed for the intrinsic “disk” colours, a “screen” reddening corresponding to would be required; the dust lane would require a mean spectral type of early B and . Since recent star formation is associated with dust, this result is reasonable. Alternatively, the “mixed” extinction model may be a more adequate representation of the relative distributions of stars and dust in the disk of the galaxy. This model suggests a mean spectral type of late F or early G, but also rather high values for the extinction optical depth. In reality, a combination of “screen” and “mixed” extinction is probably appropriate, and intermediate values for both spectral type and visual light loss are obtained by varying the relative importance of “mixed” and “screen” extinction. The present data do not allow us to draw a firm conclusion as to which combination is preferred.
4.1.3 Stellar emission and -band excess in the central kiloparsec
In Fig. 2a, we have shown the and colours in 1′′ diameter apertures along the major axis of NGC 3079. A number of these positions are also marked in Fig. 5,. Towards the nucleus, the colours redden rapidly, reaching peak values , at the nuclear arcsec2 (8787 pc). As Fig. 5 shows, the () colour within from the nucleus is far too red to be explained by either the “screen” or the “mixed” extinction curves in Fig. 5, so that excess emission must be present in the -band. The amount of excess -band emission implied by the near-infrared colours depends, however, on the choice of extinction model. We argue here that the “screen” model is appropriate, for the following reasons.
-
1.
First and foremost, the fact that NGC 3079 is very nearly edge-on () and displays prominent dust lanes implies that the nuclear region must undergo a large amount of foreground (“screen”) extinction.
-
2.
The occurrence of fast outflows from the nuclear region requires a significant central volume swept clear of gas and dust. Indeed, Sofue Irwin (1992) have noted the presence of such a “hole” with a diameter of about in the CO distribution. Stars in this central cavity will therefore undergo only foreground extinction.
-
3.
We may use the 0.8 mm continuum measurements by HIGW to estimate the column density of the emitting dust, and hence its visual optical depth and extinction. From Hildebrand (1983) and Savage Mathis (1979) we derive for a dust emissivity proportional to the relation , with a factor of about two uncertainty but independent of actual dust-to-gas ratios. In a 16′′ aperture, HIGW determined an 0.8 mm flux density of Jy for the unresolved central source, implying for a dust temperature K (see e.g. Braine et al. 1997). Since the emitting material surrounds the nucleus, only half of it will contribute to the extinction. Thus, the submm result implies an extinction or optical depth . Figure 5 shows that this value of would not nearly produce the required reddening if the dust were mixed with the stars. Hence a dominant foreground extinction component is required.
-
4.
With an observed magnitude of in the central arcsecond and a distance modulus , the absolute magnitude becomes , not corrected for extinction. Large reddening corrections, as would result from the use of the “mixed” reddening curve, must thus be considered unlikely.
-
5.
If the blue () colour of the eastern bulge is due to a young stellar population, the reddening vectors in Fig. 5 should begin in the rectangle marked “bulge”. The reddened points along the disk then lie very closely to the screen extinction model, indicating a gradually increasing foreground extinction, as expected for a circular disk seen edge-on. In contrast, in this case the mixed extinction model has great difficulty explaining the gradual reddening towards the nucleus, producing colours that are too red in ().
-
6.
Finally, Fig. 5 shows that for dust mixed with the stars, the nuclear colours cannot be reproduced even in the limit of infinite . Furthermore, the remaining colour difference = , () = cannot be reproduced by dust emission for any temperature below the dust sublimation temperature. This problem is even exacerbated if the bulge contains a young stellar population.
All of these arguments indicate that the extinction towards the nuclear region is dominated by foreground material. We will therefore in the following assume foreground extinction exclusively.
4.2 The central region of NGC 3079
4.2.1 Hot dust
The colours alone are insufficient to uniquely separate the effects of extinction and dust emission, as the observed points in Fig. 5 may be reached by different tracks. They do constrain, however, the range of admissible parameters.
On the one hand, Fig. 5 shows that the screen extinction limit for the central position is at arbitrarily low . For the other positions, the limit is even lower. On the other hand, for a dust emissivity , dust-mixing curves with temperatures K yield colours too blue in () to explain the observed colours of the central position for any extinction, i.e. they pass to the left of the central point in Fig. 5. As that figure shows, somewhat higher dust temperatures are in fact allowed for the other positions, but in the absence of starburst activity, we consider it unlikely that the projected central 250 pc is cooler than its surroundings. We thus find that K for the center of NGC 3079. The photometry by Lawrence et al. (1985) in a 6′′ aperture provides an additional constraint. Their observed () and () colours are very close to reddening lines originating in the “bulge” point. A non-negligible dust contribution, required by Fig. 5, is therefore possible only for relatively high dust temperatures that likewise bring the dust-mixing line close to the reddening line. Taking into account the fact that Lawrence et al. (1985) were pointing off the true nucleus, their Fig. 1a suggests that, were they properly centered, the and magnitudes may be lower by at most and respectively. The resulting colours, () = and () = , imply that the temperature of dust contributing to the near-infrared emission of the center must be between K. Lower temperatures leave no room for a significant dust contribution at , and higher temperatures produce colours too blue in () and (). We thus conclude that K. A similar result was obtained by Armus et al. (1994) who concluded from their and m measurements to the presence of significant amounts of hot dust with K; in this respect we also note the absence of cold dust emitting at far-infrared wavelengths throughout the inner 1.5 kpc (Braine et al. 1997). Finally, with radiating hot dust contributing to the near-infrared emission, especially at , NGC 3079 exhibits characteristics similar to those of the Seyfert 1 galaxies in which Kotilainen Ward (1994) found significant contributions from dust radiating at temperatures of 600–1000 K.
Limits to the contribution of radiating dust to the emission at m may be estimated from the deep CO-band absorption evident in Fig. 2 of HIGW. Comparison with unreddened late-type stellar spectra by Arnaud et al. (1989) and Lancon Rocca-Volmerange (1992) suggests that up to 25–30% of the emission from the central may be caused by dust. By assuming i. the intrinsic colours of the stellar population to be those of the typical bulge in Fig. 5, ii. a constant dust temperature K across the nuclear region, iii. identical (foreground) extinction for both radiating dust and stars and iv. no effect of scattering, we estimate from the observed , and -band fluxes a peak extinction in the central pixel of , with a dust contribution in K. The inner molecular disk region has somewhat lower mean values and a dust contribution to observed K. Both values are similar to the nuclear extinction 4 estimated from the Balmer decrement by Veilleux et al. (1994), which provides further support for our conclusion that the extinction occurs mostly or entirely in the foreground. If the radiating dust suffers less extinction than the stars, these conclusions remain unchanged, but the dust contribution to the emitted (deredenned) radiation will be proportionally lower.
The dereddened peak stellar surface brightness is of the order of W mm-1 sr-1. Further analysis shows that the stellar light distribution has a halfwidth of 2′′ perpendicular to the major axis, and 3′′ along the major axis. Within the errors, the extent of the hot, radiating dust emission is the same, but its centroid appears displaced from the stellar centroid by to the west. The integrated hot dust emission, corrected for extinction, is W mm-1, corresponding to a luminosity . This is of the far-infrared luminosity of the nucleus and of the mechanical luminosity of the modelled nuclear wind (HIGW). If the dust extinction is lower, these values decrease proportionally.
4.2.2 H2 kinematics
In Fig. 6 we show three position-velocity diagrams along lines parallel to the major axis of the total H2 distribution at , and offset from one another by . This diagram indicates, again, the presence of two H2 emission components: a bright central component with a large velocity width superposed on weaker emission which clearly shows rotation with approaching velocities north-northwest of the nucleus. The bright H2 component can be identified with component C1 in the H i and OH absorption maps published by Baan Irwin (1995), while the weaker emission corresponds to their component C2. Their component C3 has no counterpart in our images.
The bright central component has a FWHM diameter along the disk of (225 pc) and a broad, flat-topped velocity distribution which agrees well with the H2 S(1) spectrum obtained by HIGW, who found a trapezoid shape for the line with . The H2 distribution in the lower two panels of Fig. 6 does not show evidence for the velocity gradient of pc-1 ( arcsec-1) assigned to component C1 by Baan Irwin. If anything, the H2 data suggest a much faster rotation of order pc-1 in the opposite sense, i.e. velocity higher in the north, lower in the south. We suspect that Baan Irwin may have been misled by the blending of the bright component C1 with the weaker extended component C2 (see their Fig. 3 and see also Fig. 2 of Veilleux et al. (1994).
A qualitative estimate of the velocity width of the S(1) line as a function of position can be obtained by dividing the total H2 emission by the central H2 “channel” only. This shows that the H2 velocity range is smallest in the midplane of the disk, and increases away from the disk towards the east (i.e. in the direction of the conical outflow), and also somewhat to the west. The situation in NGC 3079 appears to be similar to that in the central region of NGC 4945, where Moorwood et al. (1996) found that the H2 emission covers the surface of a hollow outflow cone coated on the inside with H emission, that presumably plays a role in the collimation of this outflow.
The more extended H2 component, which is seen at upper left and lower right in the central panel of Fig. 6, appears to rotate in the regular sense, with a velocity gradient of pc-1 ( arcsec-1). This is somewhat steeper than the gradient of the rigidly rotating CO component (Fig. 5b in Sofue Irwin 1992) which extends to about 10′′ from the nucleus, but it is identical to the gradient determined by Baan Irwin (1995) for component C2. The H2 position-velocity diagram in the top panel of Fig. 6 (east of the midplane) repeats this pattern for the now less bright extended emission. In contrast, only very weak extended emission is present in the position-velocity diagram offset to the west (Fig. 6, lower panel), where extinction must be considerably higher, especially if part of the emitting H2 is outside the midplane of the galaxy. The rotation of the extended component implies a dynamical mass of within pc from the nucleus, or pc-3.
4.2.3 Structure of the central region
| Component | Tracer | FWHM diametera | Reference | |
| major axis minor axis | ||||
| () | ([) | |||
| Inner region | bright H2 emission | this paper | ||
| (Cavity) | hot dust | this paper | ||
| CO “hole” | 2.5 | 215 | Sofue Irwin (1992) | |
| stars (-band) | this paper | |||
| Inner molecular disk | diffuse H2 emission | this paper | ||
| CO core | Sofue Irwin (1992) | |||
| strong extinction | this paper | |||
| warm dust peak (0.8 mm) | HIGW | |||
| Outer molecular | extended CO emission | Sofue Irwin (1992) | ||
| extended moderate extinctionb | this paper | |||
| extended warm dustc | HIGW | |||
| idem | Braine et al. (1997) | |||
a corrected for extinction and finite resolution
b approximate values
c after subtraction of “ridge” component
We are now in a position to combine the structural information from various observations. In Table 2 we have collected the available size information. In the data discussed so far, three significant scale sizes can be identified.
-
1.
The inner region appears to be a cavity filled with bulge stars and edges traced by the bright H2 and hot dust emission. It corresponds to the pc radius hole in the CO emission noted by Sofue & Irwin (1992). As HIGW noted, such a cavity is required by the model of Duric Seaquist (1988), in which it represents the central volume swept clear of molecular material and dust by the strong outflow from the galaxy nucleus. At the interface, rapid rotation prevails. Both the near-infrared images and the H2 channel maps suggest that the inner outflow of NGC 3079 contains excited molecular hydrogen and hot dust, presumably swept away from the inner molecular disk by the impacting winds.
We propose that the relatively intense H2 and hot dust emission both arise as the result of the impact of the nuclear outflow on dense and dusty molecular material at the interface between the central cavity and the molecular disk. The observed integrated intensity of the bright S(1) H2 emission component alone is W m-2; correction for extinction raises this value to W m-2, i.e. to a luminosity = , which in turn suggests a luminosity in all H2 lines of about . The more extended diffuse H2 has a dereddened luminosity about half that of the bright emission region. Thus, the molecular hydrogen luminosities we derive here are about a quarter of those found by HIGW, partly because of our lower observed value and partly because of a lower derived extinction. This relaxes the already low efficiency requirements discussed by HIGW even further, so that there can be no doubt that the impacting winds can indeed easily explain the observed molecular hydrogen emission. As the estimated total H2 luminosity of about is forty times lower than the hot dust luminosity of , the latter obviously poses a more critical efficiency constraint than the H2 luminosity. Although the dust efficiency requirement appears to be compatible with models of the type proposed by Draine (1981) it is, however, difficult to quantify this in the absence of further data.
-
2.
The inner molecular disk extends to a radius of about 300 pc, where its thickness has increased from pc to about 400 pc, suggesting an opening angle of about 110∘. Excited H2 and hot dust are found throughout the disk but at intensities much reduced from those at the interface.
-
3.
More extended emission from warm dust and molecular gas traces the cooler outer parts of the molecular disk out to radii of about 1 kpc, after which the emission merges with the low-level emission from the main body of the galaxy (see Braine et al. 1997). This cooler material extends to distances of about 400 pc from the plane of the galaxy.
4.3 Molecular gas in NGC 3079
4.3.1 Relation of CO emission to H2 column density
We may connect the total hydrogen column density to reddening and CO intensity by the following relations:
| (1) |
and:
| (2) |
where and are the factors by which respectively the gas-to-dust and the CO intensity to H2 column density ratios in the center of NGC 3079 differs from the canonical values; is in mag, is in K km s-1 and is in cm-2. Our choice of both and is such that they will be less than unity in environments with metallicities higher than those in the solar neighbourhood.
Baan Irwin (1995) derive for their extended component C1 an H i absorption column density , where is the unknown H i spin temperature. For the same extended region, we find a mean extinction corresponding to . Considering that extinction and HI absorption sample only half of the line of sight sampled by CO emission, we obtain:
| (3) |
¿From Young et al. (1988) we find that the central 8′′ (695 pc) yields a =1–0 CO emission signal K km s-1, so that:
| (4) |
First, we obtain from this equation an upper limit to the spin temperature H i associated with the extended component C1 by assuming zero H2 column density towards the center: K . If the gas-to-dust ratio in the centre of NGC 3079 is less than that in the solar neighbourhood (), the limit on becomes more stringent. Second, since , we find , i.e., even for a ‘normal’ gas-to-dust ratio ( = 1) CO luminosities in the centre of NGC 3079 correspond to at most a twentieth of the H2 column density we would obtain by applying the ‘standard’ Galactic conversion factor. The conversion factor appropriate to NGC 3079 is thus . This value is also an upper limit because the value of used here applies to a larger area than used for the extinction. For low gas-to-dust ratios (i.e., ) and reasonable spin temperatures, and consequently rapidly become small. Conversely, CO-to-H2 conversion factors similar to that of the Galactic disk () are obtained only for very large gas-to-dust ratios (). Such large gas-to-dust ratios are more characteristic for extremely metal-poor dwarf galaxies than for the centres of spiral galaxies. These results are rather constrained and point to low values of both the H i spin temperature and the CO-to-H2 conversion factor for a large range of acceptable gas-to-dust ratios.
A low value for the CO-to-H2 conversion factor is consistent with the ‘discrepancies’ between H2 masses derived from CO and from submillimetre observations, noted in Sect. 5 of HIGW. Moreover, a rather similar result has been derived by Braine et al. (1997). On the basis of their observations, they arrive at a conservative estimate . There is some evidence that within the cavity, the nucleus itself is surrounded by a high-density, parsec-sized accretion disk. Baan Irwin’s (1995) component A exhibits a high value cm-2 K-1. Trotter et al. (1998) argue that this component is part of an inner jet emanating from a heavily absorbed nuclear engine, and that this nucleus is surrounded by a turbulent and presumably dense disk, 2 pc in diameter and traced by H2O maser emission. The nucleus may thus suffer a much higher extinction than the extended region C1. This does not change our results, because both our extinction and the HI absorption value used do not refer to the nucleus, but to the material in front of the extended cavity. In addition, the proposed circumnuclear disk has a very small filling factor with respect to the 8′′ region sampled in CO emission.
Even if the actual extinction were to be higher than assumed by us, we would still require the conversion factor to be much lower than the one applicable to the solar neighbourhood, although the constraints on spin temperature would be much relaxed. Finally, we test our result by calculating the extinction towards the extended central region required by Eq. (3) if and are both set to unity (i.e., Galactic values for the CO-to-H2 conversion factor and the gas-to-dust ratio). In this case Eq. (3) changes to the expression , so that and . This value of the extinction, although possibly appropriate to the very nucleus, is clearly ruled out for the extended circumnuclear region sampled by our data. This underlines the robustness of our conclusion that at least the CO-to-H2 conversion factor in the centre of NGC 3079 is substantially lower than the Galactic value.
The nuclear activity in NGC 3079 may be responsible for the apparent, extremely low [H2]/[CO] abundance. Theoretical models by Neufeld Dalgarno (1989) predict that this may occur in regions exposed to dissociative shocks. Behind the shock, most of the carbon will be incorporated into CO by gas-phase reactions, but the catalytic formation of H2 is severely inhibited if the essential dust grains are heated to temperatures of the level we propose for the inner parts of NGC 3079. As a result, [H2]/[CO] abundances may be depressed by one to two orders of magnitude. These theoretical predictions at least provide a consistent framework for the interpretation of the phenomena observed in the central region of NGC 3079: the presence of fast, energetic nuclear winds, shocked molecular hydrogen, hot dust and an underabundance of molecular hydrogen with respect to carbon monoxide.
4.3.2 Gaseous content of NGC 3079
Comparison of the interferometric and single dish CO data suggest that of the order of 35 to 50% of the CO emission from NGC 3079 finds its origin in the inner molecular disk within 500 pc from the nucleus (Young et al. 1988). However, in the preceding we have presented evidence for a relatively small amount of molecular hydrogen associated with the bright central CO emission. As the main body of NGC 3079 may well be characterized by more “normal” CO-to-H2 conversion factors (e.g. Braine et al. 1997) we cannot conclude that most of the molecular mass is concentrated in the central region.
Scaling the molecular mass estimate by Young et al. (1988) to our adopted distance and our estimated CO-to-H2 conversion factor, we find for the molecular disk a mass , or of the dynamical mass. For K and , we find a mean ratio , characteristic for an ISM dominated by molecular clouds. For the rest of the galaxy, Young et al. found a mass of which reduces to after scaling to our adopted distance and a “normal” conversion factor of . This is 25 times the central molecular mass, and about a third of the H i mass of NGC 3079 (Irwin Seaquist 1991). Including helium, the total mass of gas in NGC 3079 is , or about 10 of its total mass (cf. Irwin Seaquist 1991). Such a fraction of the total mass is characteristic for late-type galaxies, as is the mean ratio . We note that our molecular gas estimates again are very similar to those derived by Braine et al. (1997) under different assumptions.
It thus appears that the molecular hydrogen content of NGC 3079 is not exceptional compared to that of other late-type galaxies. Rather, the emissivity of CO in the central molecular disk is unusually high.
5 Conclusions
-
1.
The central 20′′ (kpc) of NGC 3079 exhibits a large range of near-infrared colours, representing a varying combination of intrinsic stellar colours, scattered stellar light, emission by hot dust and extinction increasing towards the nucleus. As a consequence, proper interpretation of the observed light in terms of nuclear structure and composition cannot be achieved by the use of photometry in multi-arcsec apertures, but requires imaging at the highest possible resolution.
-
2.
The nucleus suffers from significant extinction, even at near-infrared wavelengths. The peak extinction at a resolution of 1′′ is . The mean extinction of the inner disk is .
-
3.
The eastern part of the NGC 3079 bulge has () colours too blue to be explained by stars in a typical quiescent bulge, and provide evidence either for a 20% contribution of directly emitted light from young stars in the bulge, or a 20–30% contribution by scattered light from stars in the bulge or in the stellar disk. Scattering of power-law () emission from a nuclear source is less likely as it would require a rather unusual intrinsic spectrum.
-
4.
The colours show the presence of two or three dark lanes obscuring stellar light west of the nucleus. These dust lanes cause significant extinction of both bulge and disk.
-
5.
The colours of the central 3′′ (pc) are extremely red, peaking at and . They can be explained by the presence of hot dust in the central region, radiating at temperatures close to K. The -band luminosity of this hot dust is at most of the far-infrared luminosity from the central region, and of the mechanical luminosity that appears to be available from nuclear winds in the central region.
-
6.
Molecular hydrogen S(1) emission originates in a compact source centred on the nucleus and elongated along the major axis, surrounded by a region of lower surface brightness. East of the nucleus, some H2 emission appears associated with the inner outflow seen at radio and optical wavelengths. It may represent material swept away from the molecular disk out of the plane by the impacting winds. A western counterpart is lacking, and the sharp cutoff of H2 emission testifies to the significant near-infrared extinction caused by the galaxy disk intervening in the line of sight.
-
7.
The distribution of hot dust emission is practically identical to that of the bright molecular hydrogen emission and just covers the central cavity observed in the CO distribution. This morphology, and the kinematic information obtained from the H2 images, is supporting evidence for the nuclear wind model proposed by Duric Seaquist (1988) and for the conclusions reached by Veilleux et al. (1994) and Hawarden et al. (1995). The H2 and hot dust emission appears to originate in dense material shocked by fast nuclear winds impacting at a radius of about 120 pc on the inner edge of a central molecular disk.
-
8.
The high-density inner molecular disk extends out to a radius of about 290 pc. Cooler dust and molecular gas extend out to a radius of at least 1 kpc.
-
9.
The combination of extinction, H i absorption optical depth and CO emission places upper limits on both the H i spin temperature and the CO-to-H2 conversion factor in the central region of NGC 3079. For gas-to-dust ratios comparable to those in the solar neighbourhood, the H i spin temperature is well below 250 K, while is less than . Notwithstanding the concentration of CO emission in the center of NGC 3079, the central regions contain only a small fraction of all molecular hydrogen in the galaxy. The molecular hydrogen content of NGC 3079 is similar to that of other late-type galaxies, but the centrally concentrated CO appears unusually overabundant with respect to H2, possibly related to the nuclear activity.
Acknowledgements.
We thank Markus Blietz and Alfred Krabbe for their kind assistance with the FAST observations. The William Herschel Telescope was operated by the Royal Greenwich Observatory in the Spanish Observatorio del Roque de los Muchachos of the Instituto de Astrofisica de Canarias. The research of P.P. van der Werf has been made possible by a fellowship of the Royal Netherlands Academy of Arts and Sciences.References
- (1) Aaronson M., Mould J., 1983, ApJ 265, 1
- (2) Armus L., Shupe D.L., Matthews K., et al. 1994 in: Infrared Astronomy with Arrays, ed. I. McLean, (Dordrecht: Kluwer), p. 501
- (3) Arnaud K.A., Gilmore G., Cameron A.C., 1989 MNRAS 237, 495
- (4) Baan W.A., Irwin J.A., 1995, ApJ 446, 602
- (5) Braine J., Guélin M., Dumke M., et al. 1997, A&A 326, 963
- (6) Combes F., Sanders R.H., 1981, A&A 96, 164
- (7) De Bruyn A.G., 1977, A&A 58, 221
- (8) De Vaucouleurs G., De Vaucouleurs A., Corwin H.C., 1976, Second Reference Catalogue of Bright Galaxies, University of Texas Press, Austin (RC2)
- (9) Duric N., Seaquist E.R., 1988, ApJ 326, 574
- (10) Duric N., Seaquist E.R., Crane P.C., Bignell R.C., Davies L.E., 1983, ApJ 273, L11
- (11) Fabbiano G., Kim D.-W., Trinchieri G., 1992, ApJS 80, 531
- (12) Filippenko A.V., Sargent W.L.W., 1992, AJ 103, 28
- (13) Forbes D.A., Ward M.J., DePoy D.L., Boisson C., Smith M.G., 1992, MNRAS 254, 509
- (14) Hawarden T.G., Israel, F.P., Geballe T.R., Wade R., 1995, MNRAS 276, 1197 (HIGW)
- (15) Heckman T.M., Armus L., Miley G.K., 1990, ApJS 74, 833
- (16) Henkel C., Güsten R., Downes D., et al., 1984, A&A 141, L1
- (17) Hildebrand R.H., 1983, QJRAS 24, 267
- (18) Irwin J.A., Seaquist E.R., 1988, ApJ 335, 658
- (19) Irwin J.A., Seaquist E.R., 1991, ApJ 371, 111
- (20) Irwin J.A., Sofue Y., 1992, ApJ 396, L75
- (21) Israel F.P., White G.J., Baas F., 1995 A&A 302, 343
- (22) Koornneef,J., 1983, å128, 84
- (23) Kotilainen J.K., Ward M.J., 1994 MNRAS 266, 953
- (24) Kotilainen J.K., Ward M.J., Boisson C., DePoy D.L., Smith M.G., 1992, MNRAS 256, 149
- (25) Krabbe A., Rotaciuc V., Storey J.W.V., et al., 1993, PASP 105, 1472
- (26) Kuchinski L.E., Terndrup D.M., 1996, AJ 111, 1073
- (27) Kuijken K., Merrifield M.R., 1995, ApJ 443, L13
- (28) Lancon A., Rocca-Volmerange B., 1992 A&AS 96, 593
- (29) Lawrence A., Ward M.J., Elvis M., et al., 1985, ApJ 291, 117
- (30) Moorwood A.F.M., Van der Werf P.P., Kotilainen J.K., et al., 1996, A&A 308, L1
- (31) Neufeld D.A., Dalgarno A., 1989, ApJ 340, 869
- (32) Sandage A., Tammann G.A., 1987, A Revised Shapley-Ames Catalog of Bright Galaxies, second edition, Cargegie Institution of Washington Publication 635 (Washington, D.C.: Carnegie Institution of Washington).
- (33) Savage B.D., Mathis J.S., 1979, ARA&A 17, 73
- (34) Seaquist E.R., Davies L., Bignell R.C., 1978, A&A 63, 199
- (35) Shaw M., Wilkinson A., Carter D., 1993, A&A 268, 511
- (36) Sofue Y., Irwin J.A., 1992, PASJ 44, 353
- (37) Trotter A.S., Greenhill L.J., Moran J.M., 1998 ApJ 495, in press
- (38) Veilleux S., Cecil G., Bland-Hawthorn J., et al., 1994, ApJ 433, 48
- (39) Young J.S., Claussen M.J., Scoville N.Z., 1988, ApJ 324, 115
- (40) Willner S.P., Elvis M., Fabbiano G., et al., 1985, ApJ 299, 443