The X-ray Expansion of the Supernova Remnant Cassiopeia A
Abstract
We present the first X-ray expansion measurement of the SNR Cas A. We compared new ROSAT to archived Einstein HRI images with a separation of 17 years. The remnant is seen to be expanding, on average, at a rate of % yr-1, which is twice as fast as the expansion of the bright radio ring and two-thirds as fast as the ensemble of optical Fast Moving Knots. This argues that we are observing different hydrodynamical structures in each band, although all of these components are located on the same patchy ring. In addition, significant variations in expansion rate as a function of azimuth around the bright X-ray ring are found. These findings are discussed in the context of two classes of models, involving either an ambient medium with a uniform or monotonically decreasing density away from the center, or a pre-existing circumstellar shell.
1 Introduction
Cassiopeia A (Cas A) is the youngest known Galactic supernova remnant (SNR) and is believed to have been caused by a type II supernova in (van den Bergh & Kamper 1983). This shell-type SNR with a 5′ diameter is estimated to be kpc away (Reed et al. 1995). Young, rapidly evolving SNRs such as Cas A provide important laboratories in which to study high energy processes in the ISM. They are rapidly evolving and therefore allow us to observe astrophysical hydrodynamics and its coupling to radiation mechanisms in real time.
Much analytical and numerical work has gone into studying remnant dynamics (e.g., Sedov 1969, Chevalier 1982, Dohm-Palmer & Jones 1996, Borkowski et al. 1996 (B96)). To test such dynamical models, one must identify observed features with the theoretical hydrodynamical structures such as shocks or contact discontinuities. In some remnants, e.g. Tycho’s SNR (Renoso, et al. 1997), such a connection between observed radio features and theoretical hydrodynamics seems clear, with the sharp-edged ring being identified with the outer shock (Tan & Gull 1985). However, the correspondence between Cas A’s morphology and dynamics is ambiguous. In the radio, we have proposed (Koralesky & Rudnick 1998 (KR98)) that the bright ring represents the reverse shock or contact discontinuity. In the X-ray, the bright ring has been identified either with the reverse shock (Fabian et al. 1980) or the interaction region between a circumstellar shell and the SNR ejecta (B96). Therefore, detailed dynamical information in all wavebands is needed to discriminate among possible models. Below, we give a brief overview of what is currently known about the structures and motions of the optical, radio and X-ray emitting components of Cas A.
The kinematics of small and large scale radio features of Cas A are well known (e.g., Tuffs 1986, Anderson & Rudnick 1995 (AR95), KR98). The kinematics of the small-scale radio knots are significantly decelerated relative to the optical emission and inconsistent with a homologous expansion. KR98 examined the motions of the larger-scale filamentary bright radio ring and found its expansion to vary by over a factor of 2 as a function of azimuth.
The optical components of Cas A also have very disparate expansion rates. The quasi-stationary flocculi (QSFs) have velocities less than about 500 km s-1. The fast moving knots (FMKs) have velocities ranging from 4000-6000 km s-1, with an average velocity of 5300 km s-1 (Reed 1994). Fesen, Becker, & Goodrich (1988) have found velocities exceeding 10,000 km s-1. Not only do the different types of optical knots distinguish themselves by their kinematics, they have different abundances as well. The QSFs are thus thought to be shocked material in the shell and the FMKs ejecta from the SN explosion.
A velocity asymmetry was first measured in Cas A’s X-ray line of sight doppler velocities by Markert et al. (1983). Later, Holt et al. (1994) using the ASCA X-ray observatory found a 2100 km s-1 velocity asymmetry in Cas A, receding in the NW and approaching in the SE. It is likely that this is a result of the patchy, irregular illumination of Cas A’s shell, since the same asymmetry is seen in the radio rotation measures (Kenney & Dent 1985, Rudnick & Koralesky 1998 (RK98)). Thus, the X-ray velocity gradient may result from the far side being seen in the NW and the near side seen in the SE. The distribution of FMKs is also very patchy on large scales (Reed et al. 1995, Lawrence et al. 1995).
Looking at the overall remnant structure, Reed et al. (1995) found that 76% of the FMKs fall within 5″ of a spherical shell which is at the same radius as the radio and X-ray rings. A strong correlation between the X-ray and radio morphology has been demonstrated by Keohane, Rudnick, & Anderson (1996, KRA96) and Keohane, Gotthelf, & Petre (1998, KGP98). KGP98 suggest that this correlation is consistent with proportionate partition between the local magnetic field and the hot gas, which would imply turbulent mixing of the components.
Despite the overlap between the emission in the different wavebands, it is clear that there are multiple dynamical components. Even within the X-ray waveband, Cas A’s spectra have been modeled by two thermal components which have been traditionally interpreted to be outer- and inner-shocked ejecta (Markert et al. 1983, Jansen et al. 1988). The majority of Cas A’s X-ray emission has been attributed to the inner-shocked ejecta (Fabian et al., 1980), which has been shown to be enriched in S and Ar as are the FMKs (Vink, Kaastra, & Bleeker 1996). More recently, Allen et al. (1997), have found strong evidence for a high-energy tail in Cas A that dominates the X-ray spectrum above 10 keV. They argue that this is due to synchrotron radiation of electrons accelerated to energies of 40 TeV.
The kinematics of Cas A’s X-ray component are a crucial piece of information in disentangling the complex behavior of this remnant. The X-rays may be linked to the behavior in other wavebands, or may probe an entirely different hydrodynamical structure. For instance, in the case of Tycho, Hughes (1996) found that the X-ray dynamics were distinct from the behavior in the radio or optical.
2 Observations & Analysis
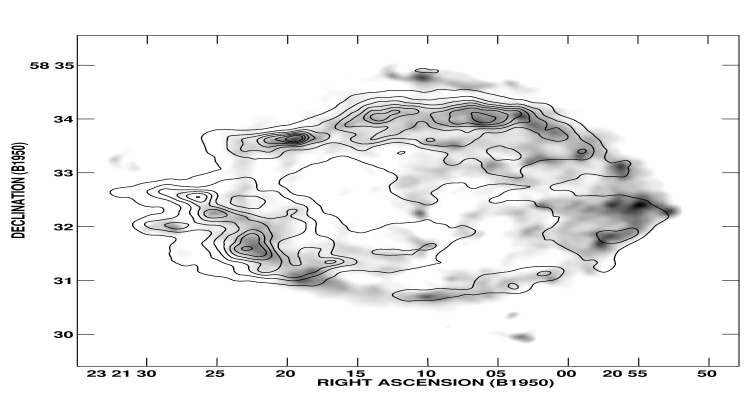
We observed Cas A with two new pointings, taken with the high resolution imager (HRI) on the ROSAT X-ray satellite, on 23 Dec. 1995 and 20 Jun. 1996 with a combined yield of 232 ks of acceptable time at an effective epoch of 1996.1. The two images were aligned and registered with the radio image as described in KGP98 and shown as contours in Figure 1. Note the lower intensity in the SW, which is due to absorption of the soft X-rays by a molecular cloud (KRA96). We compared this with an archived Einstein HRI exposure of Cas A from 1979 (Fabian et al. 1980, Murray et al. 1979). The 17.0 year baseline between Einstein and ROSAT observations represents 5% of the age of the remnant. Cas A is imaged in the center of the field on the optical axis where the resolution is optimal and the distortion minimal. The HRIs on Einstein and ROSAT are well suited for comparisons of this type because of their similar design and spectral response in their overlapping bandpasses. The measured flux from Cas A is dominated by the 1.86 keV Si line, which provides the bulk of the emission over the bandpass of both instruments. Both maps were normalized by their total counts and convolved with a 5″ Gaussian to put them on the same spatial and flux scale.
The radio expansion measurements were taken from KR98, which presents a more complete discussion of the uncertainties and possible biases in expansion analysis presented herein. The radio data were taken at the Very Large Array111The National Radio Astronomy Observatory is a facility of the National Science Foundation operated under cooperative agreement by Associated Universities, Inc. from epochs 1983.78 (observers: R.J. Tuffs, S.F. Gull, R.A. Perley) and 1994.58 (KR98) at an average frequency of 4.8 GHz.
Since optical and radio studies have shown that the motions are dominated by expansion and also vary azimuthally, we decided to focus our initial study of X-ray motions in those areas. We segmented each X-ray image into sectors of 10 degrees, and compared spatially expanded versions of the 1979.1 image, sector by sector, with the new 1996.1 image in the same manner as the radio. An expansion center of RA(1950) 23h 21m 11.4s Dec (1950) 58°32′28.5″ was assumed for consistency with the radio analysis. We used a range of expansion factors from 0.97 to 1.08. The “observed” expansion factor for each sector was determined as the one that produced the minimum rms difference between the normalized Einstein and ROSAT sector images. All analysis was done using NRAO’s AIPS. We then corrected the observed expansion factors for the 0.50% plate scale differences between ROSAT and Einstein (David et al. 1995).
The ring varies in width from 5-20″ in the radio and from 10-20″ in X-rays. In most sectors, the contributions from the bright ring dominate the determination of the expansion in both these wavebands.
Furthermore, we measured the relative radii of the rings between the X-ray and radio images using the above expansion determination method. For the ROSAT image, we used a comparison radio image interpolated to the same epoch using maps from KR98. For the Einstein image, we used the 1979 radio map from the Cambridge 5 km interferometer (Observer: R. J. Tuffs). We then minimized the rms difference as a function of “expansion” factor between each X-ray map and its respective radio counterpart, and thus determined the relative radii of the bright rings at each epoch.
3 Results
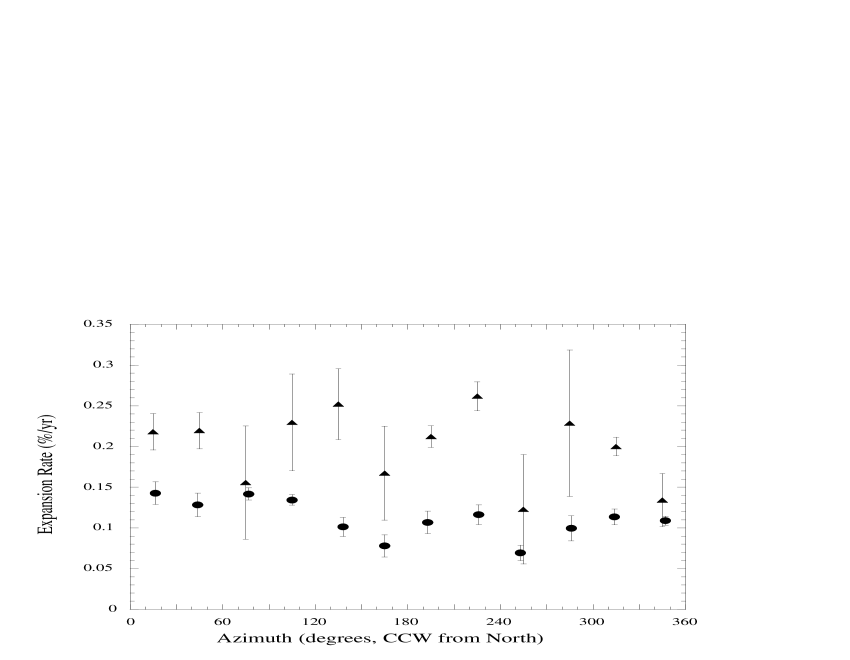
The observed and corrected expansion factors for Cas A’s X-ray emission as a function of azimuth are shown in Figure 2, along with the radio expansion values from KR98. Both have been converted onto a scale of percent expansion per year (hereinafter “expansion rate”). For this plot, we smoothed the data using a boxcar of 30∘, so there are three (five) independent points for each X-ray (radio) plotted point. The most striking result is that the median expansion rate in the X-ray, % yr-1, is twice that observed for the radio ring (KR98). These translate to an expansion parameter, and 0.35 respectively, here , where =radius to the ring and =time. For reference, these expansions correspond to and km s-1, respectively. This velocity is larger than measured by Holt et al. (1994).
We estimated the errors using (, X-ray) and (, radio) times the rms scatter among the independent sector values going into each plotted point in Figure 1. While this gives only an approximate measure of the actual errors, it does include all contributing factors including the statistical error on the count rate and structural influences to the fit accuracy.
There are also X-ray expansion rate variations of 50% as a function of azimuth. However, any differences between the center used and the unknown explosion center would result in a sinusoidal variation with azimuth in the observed expansion rate. Also, registration offsets between the Einstein and ROSAT images would mimic this effect. For example, a position offset of 5″(consistent with a mis-alignment of Einstein and ROSAT by one convolved beam), we would expect a sinusoid of magnitude 0.3% yr-1. It is therefore likely that some of the large scale azimuthal variations in Figure 2 are due to such errors. Large angular scale variations are also seen in the radio data; these cannot be due to registation uncertainties and are likely the result from different deceleration in the presence of external density gradients (AR95).
There are also significant smaller angular scale variations, such as the marginal, but sharp dips at azimuths and which are seen in both the X-ray and radio measurements. These cannot be caused by position offset biases due to their smaller angular scale. In addition, there appears to be a very sharp drop in X-ray expansion rate at . This is the region commonly known as the “jet”, where the bright ring is only marginally detected in either the radio or X-ray.
In comparing the relative radii of the X-ray and radio rings, we measured the mean X-ray size to be smaller than the radio by in 1996.1 and by in 1979. For reference, these correspond to and pc respectively. It appears that the X-ray ring is “catching up” to the radio.
4 Discussion
The dramatically different mean X-ray and radio expansion rates argue that we are observing two different hydrodynamical structures in these bands. Their emission shows that these structures are also dominated by different radiative processes. The X-ray brightness traces the regions of hot, dense gas and is sensitive to ionization state, while the radio would follow the regions of enhanced magnetic field. These populations are not necessarily coupled to the same magneto-hydrodynamic structures in a young SNR.
Several conclusions can be drawn in the context of two existing models of Cas A. For the purposes of this discussion, we will assume that we are observing a well-defined X-ray component. Since the X-ray spectra show more than one component, future work may show these are also distinct kinematically, and whether we are observing a blend. The first model is that of a SNR expanding into a uniform or monotonically decreasing density gradient. The outer shock cannot be the origin of either X-ray or radio rings, because the large-scale diffuse plateau of radio and X-ray emission exists outside of both bright rings.
The X-ray ring can also not be tracing the reverse shock during the early phase of the SNR evolution. During that time, the reverse shock is still expanding inward in the frame of the ejecta. Therefore the ejecta, which the radio is likely tied to, would be moving faster than the reverse shock in the external reference frame. However, the X-ray motions could be consistent with the later behavior of the reverse shock, once it has reflected from the explosion center and moves outward through the ejecta (Dohm-Palmer & Jones 1996). During that period, the reverse shock will expand more rapidly in the external frame than the ejecta, so might reasonably expand more rapidly than the radio structures generated by magnetic field amplification in the ejecta. This consistently explains both the higher velocity X-ray component and that it could be interior to the radio and catching up to it.
Chevalier & Liang (1989) developed a model where the remnant is dominated by SN ejecta interacting with the pre-existing circumstellar shell which was created through wind interactions during the late stages of evolution of the pre-SN star. Borkowski et al. (1996), propose that the outer shock has already been transmitted through the shell and is now propagating into the unshocked red supergiant wind, while the reverse shock is traveling into the ejecta. In the context of this model, the X-ray- and radio-emitting regions trace the shocked diffuse component of the shell, while the optical knots follow the shocked clumps which also existed in the shell.
In its simplest form, the circumstellar shell model does not explain the different velocities and positions of the X-ray and radio rings. However, it may be tenable in the case of shocks reflected within the shell as proposed by B96. Also, it could be consistent with the passage of the reflected inner shock as discussed above, or in the case of multiple shocks due to an inhomogeneous medium and viewed in projection.
The strong structural correlation between the X-ray and radio observed by KGP98 is somewhat puzzling given the kinematic differences presented here. This would seem to imply that we are observing the system at almost exactly the right moment when the features are overlapping. However, the structural and kinematic determinations actually depend on different X-ray and radio features. KGP98 find their strongest correlation in low-surface-brightness regions while our method more effectively tracks the bright ring where they find the most scatter.
5 Conclusions & Future Work
The kinematics of Cas A in the X-ray present an intriguing puzzle. The average X-ray expansion rate rests in the middle of the average radio expansion and the average fast moving optical knot velocity. All of these vary significantly as a function of azimuth. To add to the complexity, each of these components exist at the same approximate location in the remnant. Although each observed waveband reveals a separate dynamical component, the link between them has yet to be determined. As a next step, we will analyze the two-dimensional velocity distribution in the X-rays, to look for non-radial motions such as are seen in the radio (AR96).
Higher resolution X-ray instruments, such as AXAF, will be important tools to decipher the conditions in Cas A. The high spatial and spectral resolution of AXAF will allow for more detailed mapping of doppler velocities and spatial variation of abundances. By analogy with the optical data, the X-ray emission may divide into separate composition and kinematic populations. In addition, follow-up observations will allow us to see whether the X-ray and radio shells diverge, as the velocities presented suggest they should, or whether a new population of X-ray emitting features arises in the interaction region, as is probably happening with the optical knots. This may enable differentiation between the two types of models discussed above. Careful comparison of the new X-ray and radio measurements with the mid-IR, e.g. ISO (Tuffs 1998), will help trace the distributions of SN ejecta condensates.
There is also the intriguing possibility of spatially separating the two thermal and the relativistic components, all of which could be blended here. B96 noted that circumstellar shell models would give a denser, cooler shell, surrounded by a hotter, less dense shocked wind gas. This is the opposite of what one would expect from an expansion into a uniform medium.
This work provides an excellent basis for comparison to recent advancements in multi-dimensional magneto-hydrodynamic simulations which will be a crucial component of deciphering Cas A’s dynamics. This, coupled with improved non-equilibrium ionization models, will yield more realistic simulations to compare with observations.
Acknowledgments
SNR research at the University of Minnesota is supported by the NASA Graduate Research Program and the National Science Foundation under grant AST 96-19438. We would like to thank T. W. Jones and S. P. Reynolds for discussions about SNR dynamics and comments on the paper and R. Petre for assistance with the ROSAT observations.
References
Allen, G. E. et al. 1997, ApJ, 487, L97
Anderson, M. C., Jones, T. W., Rudnick, L., Tregillis, I. L., & Kang, H. 1994, ApJ, 421, L31
Anderson, M. C. & Rudnick, L. 1995, ApJ, 441, 307
Borkowski, K. J., Szymkowiak, A. E., Blondin, J. M., & Sarazin, C. L., ApJ, 466, 866
Chevalier 1982, ApJ, 259, L59
Chevalier & Liang, 1989
David, L. P., Harnden, F. R., Kearns, K. E., & Zombeck, M. V. 1995, The ROSAT High Resolution Imager (HRI)
Dohm-Palmer & Jones 1996, ApJ, 471, 279
Fabian, A. C., Willingale, R., Pye, J. P., Murray, S. S., & Fabbiano, G. 1980, MNRAS, 193, 175
Fesen, R. A., Becker, R. H., & Goodrich, R. W. 1988, ApJ, 329, L89
Holt, S. S., Gotthelf, E. V., Tsunemi, H., & Negoro, H. 1994, PASJ, 46, L151
Hughes, J. 1996, BAAS, 189, 4608
Jansen, F., Smith, A., Bleeker, J. A. M., de Korte, P. A. J., Peacock, A., & White, N. E. 1988, ApJ, 331, 949
Kenney, J. D., & Dent, W. A. 1985, ApJ, 298, 644
Keohane, J. W., Gotthelf, E. V., & Petre, R. 1998, ApJ, accepted
Keohane, J. W., Rudnick, L., & Anderson, M. C. 1996, ApJ, 466, 309
Koralesky & Rudnick, 1998, in prep.
Lawrence et al. 1995, AJ, 109, 2635
Markert, T. H., Canizares, C. R., Clark, G. W., & Winkler, P. F. 1983, ApJ, 268, 134
Murray, S. S., Fabbiano, G., Fabian, A. C., Epstein, A., & Giacconi, R. 1979, ApJ, 234, L69
Reed, J. E., Hester, J. J., Fabian, A. C., & Winkler, P. F. 1995, ApJ, 440, 706
Reed, J. E., Hester, J. J., & Winkler, P. F. 1995, preprint
Renoso, et al. 1997, ApJ, 491, 816
Rudnick, L. & Koralesky, B. 1998 preprint
Sedov, L. I. 1969, Similarity and Dimensional Methods in Mechanics (New York: Academic)
Tan, S. M., & Gull, S. F. 1985, MNRAS, 216, 949
Tuffs, R. J. 1986, MNRAS, 219, 13
Tuffs, R.J. 1998, ‘Observations of Supernova Remnants with ISO’, to appear in ‘Highlights of the ISO Mission’, ed. D. Lemke, in ‘Highlights of Astronomy’, Proc. XXIIIrd General Assembly of the IAU
van den Bergh, S., & Kamper, K. 1983, ApJ, 268, 129
Vink, J., Kaastra, J. S., & Bleeker, J. A. M., 1996, A&A, L44