Oxygen abundances in unevolved metal-poor stars from near-UV OH lines111Based on observations obtained with the William Herschel Telescope, operated on the island of La Palma by the Isaac Newton Group in the Spanish Observatorio del Roque de los Muchachos of the Instituto de Astrofísica de Canarias, as well as on observations made with the Anglo-Australian Telescope, Siding Spring, Australia.
Abstract
We have performed a detailed oxygen abundance analysis of 23 metal-poor (3.0[Fe/H]0.3) unevolved halo stars and one giant through the OH bands in the near UV, using high-resolution echelle spectra. Oxygen is found to be overabundant with respect to iron in these stars, with the [O/Fe] ratio increasing from 0.6 to 1 between [Fe/H]=1.5 and 3.0. The behavior of the oxygen overabundance with respect to [Fe/H] is similar to that seen in previous works based on O I IR triplet data (Abia & Rebolo 1989; Tomkin et al. 1992; Cavallo, Pilachowski, & Rebolo 1997). Contrary to the previously accepted picture, our oxygen abundances, derived from low-excitation OH lines, agree well with those derived from high-excitation lines of the triplet. For nine stars in common with Tomkin et al. we obtain a mean difference of 0.000.11 dex with respect to the abundances determined from the triplet using the same stellar parameters and model photospheres. For four stars in our sample we have found measurements of the [O I] 6300 Å line in the literature, from which we derive oxygen abundances consistent (average difference 0.09 dex) with those based on OH lines, showing that the long standing controversy between oxygen abundances from forbidden and permitted lines in metal-poor unevolved stars can be resolved. Our new oxygen abundances show a smooth extension of the Edvardsson et al.’s (1993) [O/Fe] versus metallicity curve to much lower abundances, with a slope (taking into account the error bars in both oxygen abundances and metallicities) in the range 3[Fe/H]1. The extrapolation of our results to very low metallicities indicates that the first Type II SNe in the early Galaxy provided oxygen to iron ratios [O/Fe]1. The oxygen abundances of unevolved stars when compared with values in the literature for giants of similar metallicity imply that the latter may have suffered a process of oxygen depletion. As a result, unevolved metal-poor stars shall be considered better tracers of the early evolution of oxygen in the Galaxy. The higher [O/Fe] ratios we find in dwarfs has an impact on the age determination of globular clusters, suggesting that current age estimates have to be reduced by about 1–2 Gyr.
1 Introduction
Oxygen is the most abundant element in stars after H and He. It is produced in massive stars and ejected into the interstellar medium when they explode as Type II SNe (see, for example, Arnett (1978); Tinsley (1979); Woosley & Weaver (1995)). Iron, however, is produced in both Type II and less massive Type I SNe (resulting from mass accretion by a C–O white dwarf, Tinsley (1979)). The fact that Type I SNe have longer lifetimes offers an opportunity to put some constraints on the time-scale of oxygen and iron production by measuring oxygen overabundance over iron. It has been argued (Tinsley (1979)) that at least a 108-yr delay between Type I and Type II SNe can lead to an enhancement of the [O/Fe] ratios in stars formed in very early epochs of the Galaxy. Theoretical models of Type II SN element yields show an increase in [O/Fe] (as well as other elements) ratio as a function of the progenitor mass (Woosley & Weaver (1995)). Abundance ratios observed in low-mass metal-poor stars allow estimates of primordial abundances of elements as well as the study of the yields of SNe of different progenitor masses.
Oxygen abundances have been measured in many globular clusters and metal-poor field stars using: 1) the O I IR triplet located at 7774 Å (Abia & Rebolo (1989); Tomkin et al., (1992); King 1994; Cavallo et al., (1997)); 2) the [O I] lines at 6300, 6363 Å (Barbuy (1988); Gratton & Ortolani (1989); Sneden et al. (1991); Kraft et al., (1992); Kraft et al., (1995); Minniti et al., (1996)), and 3) the OH lines in the UV (Bessell, Sutherland, & Ruan 1991; Nissen et al. 1994). The use of different methods has a simple physical rationale. The high-excitation ( = 9.15 eV) triplet at 7774 Å is strong and can be accurately measured in hot halo dwarfs, while forbidden lines are a good tool for cool halo giants. Molecular OH lines in the UV are observed in both giants and dwarfs with 6500 K (OH is destroyed at higher temperatures). The most relevant result from these studies was the confirmation of the theoretically expected oxygen overabundance with respect to iron. All authors agree on the point that [O/Fe] increases when [Fe/H] decreases from 0 to 1. However, the slope of the [O/Fe] versus [Fe/H] dependence and its behavior for metallicities below 1 were not clear. Results of different authors disagree. Studies of [O I] data suggest an [O/Fe] overabundance of +0.4 to +0.5 dex for [Fe/H] 0.8 (Barbuy (1988); Gratton & Ortolani (1989); Sneden et al. (1991); Kraft et al., (1992)), while the O I triplet gave systematically higher values; [O/Fe] +0.790.29 (see Cavallo et al. 1997, and references therein).
Abia & Rebolo (1989) derived oxygen abundances from the O I IR triplet of 30 dwarfs and subgiants covering a range of metallicities 2.7 [Fe/H] 0 and found that [O/Fe] reaches 1.0–1.2 at about [Fe/H]. It became clear that the [O I] line at 6300 Å give systematically lower abundances compared with the O I IR triplet. Different ideas appeared in the literature aiming to resolve this discrepancy. King (1993) has suggested a new temperature scale for metal-poor dwarfs increasing the effective temperatures by 150–200 K. However, the validity of the assumptions made in his temperature scale were criticized by Balachandran & Carney (1996). A possible source of systematic errors could be hidden in the form of the source function of the oxygen triplet. It was clear that forbidden lines and IR triplet are relatively free from non-LTE effects in metal-poor stars (Kiselman (1993); Tomkin et al. 1992). Kiselman & Nordlund (1995) proposed that correct radiative transfer in 3-D atmospheric models can decrease the strength of the O I IR triplet relative to the [O I]. Takeda (1995) has addressed this problem in terms of the excitation temperature effects after finding that the solar O I IR triplet weakens when the chromosphere is taken into account in the computations. However, it is not obvious how to apply the ideas of Takeda (1995) and Kiselman & Nordlund (1995) to the metal-poor stars. Recent observations and analysis by Cavallo et al. (1997) have shown that the problem remains unsolved.
Most of the measurements of the forbidden lines of oxygen have been performed in giants. Barbuy (1988) and Graton & Ortolani (1989) have reported [O/Fe]=0.350.15 and [O/Fe]=0.50.1 from 20 and 18 field halo giants, respectively. Sneden et al. (1991) and Kraft et al. (1992) derived [O/Fe]=0.360.05 and [O/Fe]=0.340.02 for 10 and 16 globular cluster giants with [Fe/H] and [Fe/H], respectively. These and other studies show O overabundances of [O/Fe]0.4 down to metallicities of [Fe/H]. In a given cluster, giants with almost the same metallicity may show differences in the oxygen abundance of a factor 2–3 (and even 10) with respect to other (Kraft et al. 1995; Kraft 1994, and references therein). As regards metal-poor dwarfs, the analysis of [O I] lines has been limited to those of moderately low metallicity because of the low strength of these transitions. Only a few measurements have been reported by Spite & Spite (1991), Spiesman & Wallerstein (1991) and Nissen & Edvardsson (1992) showing consistent results with previous findings in giants.
An alternative way of deriving oxygen abundances from OH lines in the UV was suggested by Bessell, Hughes, & Cottrell (1984). These lines are very strong and can be measured at much lower abundance levels than is possible with the forbidden or the permitted O I lines. However, this measurement requires the use of near-UV high-resolution spectroscopy, which for cool and distant very metal-poor stars can only be obtained in large-diameter telescopes. In addition, there are a number of difficulties related to the specific problems of deriving abundances from the lines located in the near UV. Even with the help of synthetic spectra, the identification of many blends is uncertain. In many cases it is hard to separate a weak line from the noise or a blend. In order to overcome this difficulty one needs to obtain high-S/N and high-dispersion spectra. This method has been used by Bessell et al. (1991) and Nissen et al. (1994) who derived oxygen abundances in eight and nine metal-poor stars, respectively. Bessell et al. (1991) noticed that the low-excitation lines of OH ( = 0–1.7 eV) will provide us with more accurate abundances (compared with the IR triplet) since these lines are formed in those layers of the atmosphere where the majority of neutral metal lines used for the abundance studies occur. The oxygen abundances derived from the OH lines were about 0.5 dex lower than those measured from the O I triplet. Thus, the abundances derived from OH and [O I] agreed, and it was natural to conclude that something was wrong with the IR triplet.
In the present paper, we analyze new OH data and derive oxygen abundances in a larger sample conformed by 23 metal-poor unevolved halo stars and one giant. We compare our abundances with those from OH, the O I IR triplet, and [O I] for stars in common with previous works and discuss the implications of our findings.
2 Observations
These observations belong to a wider project aimed at measuring beryllium, oxygen, nitrogen, and carbon abundances in metal-poor stars by using atomic and molecular lines located in the near UV. The observations were carried out in different runs using the Utrecht Echelle Spectrograph (UES) at the Nasmyth focus of the 4.2-m William Herschel Telescope of the Observatorio del Roque de los Muchachos (La Palma), and the UCL Echelle Spectrograph (UCLES) of the 3.9-m Anglo-Australian Telescope. Most of the spectra were obtained using the UES with a resolution of , while the resolution achieved with the UCLES was . A detailed log of the observations, including telescopes, dates, and exposure times can be found in García López et al. (1998).
All the spectra were reduced using standard iraf 222iraf is distributed by the National Optical Astronomical Observatories, which is operated by the Association of Universities for Research in Astronomy, Inc., under contract with the National Science Foundation, USA. procedures (bias subtraction, flatfield correction, and extraction of one-dimensional spectra). Different spectra for each object were co-added before wavelength calibration and continuum normalization. The final signal-to-noise (S/N) ratio varies for the different echelle orders, being in the range 30–50 for most of the stars. The final spectra span from 3025 to 3430 Å for the UES data, and from 3070 to 3390 Å for the UCLES, including some gaps between the orders.
3 Abundance analysis
3.1 Stellar parameters
The 24 stars analyzed in this paper are listed in Table 1. Effective temperatures () were estimated initially using the Alonso, Arribas, & Martínez-Roger (1996) calibrations versus and colors, which were derived applying the infrared flux method (Blackwell et al. 1990), and cover a wide range of spectral types and metal content. All the details on photometric measurements are provided by García López et al. (1998). The selection of metallicities for the program stars was carried out by critically inspecting a large number of published values, and the references can also be found in that work.
Surface gravities () were determined by comparing the observed Strömgren and indices with synthetic ones generated using the corresponding filter transmissions and a grid of Kurucz (1992) blanketed model atmospheres fluxes. This is also explained in detail by García López et al. (1998), where a comparison is given with the spectroscopic estimates by other authors. In particular, Nissen, Hg, & Schuster (1998) have recently derived surface gravities for a sample of 54 metal-poor stars using Hipparcos parallaxes to determine luminosities. For ten stars in common, the gravities derived by García López et al. are slightly lower systematically, with a mean difference of dex in . As we shall see below, a difference of this magnitude affects the oxygen abundance derived from OH lines by about 0.07 dex.
García López et al. (1998) computed synthetic spectra in the region around the Be II doublet at 3131 Å (used for deriving beryllium abundances) for different combinations of stellar parameters, within the error bars provided by the photometric calibrations; Table 1 lists the values which best reproduce the observations. These values also reproduce well other bluer and redder spectral regions where the OH lines used in this paper are located. In particular, the effective temperatures assigned to our sample agree well with those used by Abia & Rebolo (1989) and Tomkin et al. (1992), with mean differences of K (7 objects in common) and K (9 objects in common), respectively. The mean difference between our values and those used by King (1993; who proposed a hotter temperature scale) is K for 9 stars in common. For other works with a smaller number of common objects with our sample, like those of Spite & Spite (1991) and Nissen et al. (1994), the differences in are within our adopted error bars. These comparisons and the fact that a change of 100 K in translates into a change of dex in the derived oxygen abundance (as we will show below), limit strongly the abundance differences with previous works which could be attributed to the adopted temperature scale.
3.2 Atomic and molecular data
Atomic data were obtained from the VALD database (Piskunov et al. 1995). Line lists of CH, NH and other molecules were obtained from the CD-ROM no. 15 of Kurucz (1993). Laboratory wavelengths for the OH lines were taken from Stark, Brault, & Abrams (1994), and line parameters (oscillator strengths, , and lower excitation potential, ) from Goldman & Gillis (1981). The OH lines of the solar spectrum were inspected using the high-resolution solar flux atlas of Kurucz et al. (1984) and the Moore, Minnaert, & Houtgast (1966) atlas to identify relatively strong unblended OH lines. However, independently of how careful we were in selecting the OH lines, this strategy does not guarantee complete success due to the large number of unidentified lines in the solar spectrum. We have avoided an important number of strong OH lines because they were strongly blended with other metals for which we do not have accurate values. There were several unblended candidate OH lines in the regions 310510 and 31505 Å, but these were unfortunately located between our echelle orders. With due regard for possible blends, we have selected 8 clean and 3 weakly blended unsaturated features corresponding to the same spectral range available for our stellar observations. These are mainly OH (0,0) lines of the A-X electronic system in the spectral region 3080–3300 Å, and are listed in Table 2. The only OH line in common with Nissen et al. (1994) is 3139.165 Å. This is a very strong line blended with a weak Fe I line at 3138.903 Å (=2.5, =3.05 eV) which disappears at metallicities below [Fe/H]. We have also found that all the other lines used by Nissen et al. (1994) were either blended or located between our echelle orders (note that these authors used only lines located in the spectral region 3138–3155 Å). Most of the OH lines in our list are strong enough to be found in metal-poor stars with [Fe/H] 2. Two OH lines at 3128.060 and 3128.107 Å are blended, giving rise to a single OH feature, and the OH line at 3128.286 Å is blended with the weak Sc II 3128.269 Å (=0.08, =3.46 eV).
To minimize the effects associated with the errors in the transition probabilities of atomic and molecular lines in this region, we adjusted the values of the lines used until we succeeded in reproducing the solar atlas of Kurucz et al. (1984) with solar abundances. This procedure is, in principle, strictly valid only for stars with characteristics similar to those of the Sun, but it has been shown (e.g. García López, Severino, & Gomez 1995) that it provides consistent results in abundance analyses carried out for metal-poor stars in the near UV. For the OH lines in particular, this approach is justified so long as solar values are insensitive to the treatment of damping. This is indeed the case for most of the stars in our sample, for which we have been able to fit the OH lines without assuming any ad hoc values for Van der Waals broadening (two exceptions associated with stars of high gravity and low will be discussed separately).
3.3 Spectral synthesis
We have employed a grid of LTE, plane-parallel, constant flux, and blanketed model atmospheres provided by Kurucz (1992, private communication), computed with atlas9 without overshooting, which are interpolated for given values of , , and [Fe/H]. Synthetic spectra were obtained using the LTE code wita3, a new UNIX-based version of code abel6 (Pavlenko 1991).
Synthetic solar spectra were computed in the neighborhood of the selected OH lines, and were convolved with a Gaussian of FWHM =0.052 Å to reproduce the instrumental profile of the solar atlas. We used a model with =5777 K, =4.4, [Fe/H]=0.0, microturbulence , and solar chemical abundances taken from Anders & Grevesse (1989). The solar oxygen abundance used was log (O)=8.93 (on the customary scale in which log (H)=12). Values of for the OH and other lines where adjusted to reproduce the solar spectrum. Theoretical and adjusted (i.e. solar) -values of the OH lines are listed in Table 2, and examples of the fits obtained in two spectral regions are shown in Figure 1. We did not find a systematic difference between the theoretical and adjusted values for the (0,0) lines used by us, as was the case for Nissen et al. (1994), who lowered the oscillator strengths of these lines by 0.16 dex to fit the solar spectrum.
Using this set of solar values we proceeded to derive the oxygen abundances of our stars by computing synthetic spectra with the stellar parameters listed in Table 1, and changed the oxygen abundance until a good fit to the observations was obtained. Synthetic spectra were convolved with a Gaussian with an adequate FWHM to reproduce the resolutions achieved in the UES and UCLES spectra, respectively. Table 3 lists the abundances derived from each line considered with respect to the solar abundance ([O/H]=log (O/H)⋆–log (O/H)⊙), and the mean value from all lines. The lack of data in the table corresponds mainly to the bluest region where the signal-to-noise ratios were the lowest for most of the stars, as well as to those cases in which a combination of low S/N and weak lines did not allow us to derive the abundance. HD 166913 is the worst case with only two lines. It also appears that the unblended 3255 Å line located in a high-S/N region gives the lowest abundances for several stars, but we have no reasons to discard it a priori. Figure 2 shows different examples of comparisons between synthetic and observed spectra.
Two stars of the sample, HD 64090 and HD 103095, with low effective temperature and high surface gravity, show observed OH line profiles which are narrower than the corresponding synthetic ones. The instrumental profile associated with their spectra is the same as that corresponding to other stars observed with the UES spectrograph, and for which we have obtained a good fit to the observed lines. To improve the fit, Ya. V. Pavlenko kindly included an option in wita3 to compute damping constants for a few molecules (including OH), which was applied to the analysis of these two stars. The resulting synthetic spectra were much closer to the observed ones with this improvement, although in general they were still a little poorer than those obtained for the rest.
3.3.1 Uncertainties
To check the sensitivity of the derived oxygen abundances to the input stellar parameters, we computed the changes in several of the strongest OH lines associated with variations of the stellar parameters for a set of model atmospheres (=5000, 5600, and 6200 K, =3 and 4, and [Fe/H]= and ). It turned out that a typical change of K in increases [O/H] by dex. Surface gravity works in the opposite direction, and a change of dex in corresponds to a change of dex in [O/H], whereas an error in metallicity of 0.3 dex implies an uncertainty of dex in [O/H]. The same results have been obtained by Nissen et al. (1994) using osmarcs model atmospheres (Edvardsson et al. 1993), and a different line list. In our syntheses we used a fixed value for the microturbulence, , and we confirm the previous finding by Nissen et al. (1994), which indicated that errors in the microturbulence and in the differential abundance, [C/Fe], can be neglected. The uncertainties associated with the stellar parameters were estimated for each star by taking these values into account and combining them in quadrature.
Systematic errors, like unrecognized line blends and the continuum placement, also arise in this process. The location of the continuum constitutes a serious problem for low-S/N UV data. These errors vary from star to star. In many cases it is impossible to distinguish between weak spectral features and noise. The situation is especially complex for stars with metallicities [Fe/H]. Spectra of stars with [Fe/H] can be compared with the Sun in order to make an accurate differential analysis, while the continuum can be placed more easily in the spectra of very metal-poor stars due to the disappearance of a large number of weak metallic lines. A measure of these uncertainties can be obtained from the dispersion (standard deviation) in abundances found from different OH lines, which are listed in Table 2. In a typical case (with S/N and based on 9 lines) the error is about 0.09 dex. The final errors listed in Table 1 take into account the uncertainties from the stellar parameters and the dispersion in abundances from different OH lines.
Another systematic error comes from the comparison between our adopted gravities and those based on Hipparcos measurements. As mentioned above, the values adopted in this work appear to be systematically lower by dex. To put our oxygen abundances on the Hipparcos scale we should decrease the [O/H] values listed in Table 2 by dex (given the sensitivity of our analysis to changes in surface gravity).
A final check on the uncertainties related to the use of a specific set of model atmospheres and spectral synthesis code was performed by computing synthetic spectra using osmarcs models and the LTE code spectrum (included in the Uppsala Synthetic Spectrum Package). osmarcs models were kindly provided by B. Edvardsson. Below 4500 Å they are computed using opacity sampling techniques, while at longer wavelengths opacity distribution functions are employed. The latter method is used for computing Kurucz models at all wavelengths. The differences in oxygen abundances from osmarcs models with 5795/4.30/ (//[Fe/H]), 6210/4.00/, and 5550/3.35/ with respect to their corresponding Kurucz values are in the range to dex.
4 Comparison with previous oxygen measurements
4.1 Comparison of oxygen abundances derived from OH lines
The oxygen abundance of HD 140283 has been previously derived from OH lines by Bessel & Norris (1987), Ryan, Norris, & Bessell (1991), Bessell et al. (1991), and Nissen et al. (1994). This star deserves special attention for its low metallicity and high-S/N UV spectrum (it is a bright metal-poor star with mag). Figure 3 shows the comparison between the synthetic and observed profiles for this star corresponding to various regions surrounding our selected OH lines. Synthetic spectra were computed using the stellar parameters listed in Table 1 (5550/3.35/2.7) and show that [O/H] is lying between and (the mean value resulting from all the OH lines in Table 3 is [O/H]), while a value as low as (obtained by Nissen et al. 1994) does not fit the observations. Abundances derived from the OH lines at 3085 Å are more uncertain due to the low S/N achieved in the bluest echelle order. However, the local continuum can be accurately placed in the neighborhood of the lines located between 3100–3300 Å because of the high S/N of the spectra and the low metallicity of this star. Assuming 5540/3.5/2.7 from Nissen et al. (1994), we arrive at [O/H] from the strongest OH lines in our list ( 3139.169 Å), just 0.1 dex lower than the corresponding abundance listed in Table 3, which is not surprising due to the high similarities between the set of stellar parameters used in both cases.
Furthermore, one of the sets of parameters used in the comparison between synthetic spectra computed with Kurucz and osmarcs models corresponds to the values adopted for HD 140283. In this case the oxygen abundance derived using the osmarcs model is 0.15 dex smaller than that obtained from the Kurucz one. The oxygen abundance corresponding to this star would be then [O/H]. This means that the oxygen abundance derived by us, using our line list and an osmarcs model atmosphere, is indeed only about 0.1 dex higher than that obtained by Nissen et al. (1994), and this difference is directly associated with the small differences in and between both analyses.
Assuming 5779/3.79/2.49 from Nissen, Høg, & Schuster (1998), where was estimated using the Alonso, Arribas, & Martínez-Roger (1996) calibration based on , and is derived from the parallax measured by Hipparcos, we arrive at [O/H]. This is because has a larger effect on the strength of the OH lines than . However, given the metallicity adopted by Nissen et al., the [O/Fe] ratios obtained with these parameters and with those listed in Table 1 will differ by 0.06 dex only.
Bessell et al. (1991) used the following set of parameters for HD 140283: 5700/3.3/2.8 and 5800/4.5/2.8. The high value was derived from a previous parallax which is 2.5 times larger than the value measured by Hipparcos, and we have not taken it into account. Using 5700/3.3/2.8 we obtain [O/H], which is 0.35 dex larger than the abundance derived from our adopted parameters and would imply also a larger [O/Fe] ratio. The difference of 1 km s-1 in between both analyses has a negligible influence on the abundances derived. Bessell et al. (1991) used marcs model atmospheres from a grid provided by Bell, Gustafsson, & Eriksson (1979, private communication), which have much less UV opacity and different overall spectral shapes as compared to the osmarcs and Kurucz models (see Fig. 2 of Edvardsson et al. 1993), so the agreement between their oxygen abundance ([O/H]), and our value at for this star is just a coincidence due to the stellar parameters and abundance analysis working in opposite directions.
Assuming 5750/3.2/2.7 and 5600/3.0/2.8, Ryan et al. (1991) arrived at [O/H] and , which corresponds to [O/Fe] and , respectively. These values translate into [O/H] and [O/Fe], respectively, with our analysis. The model atmospheres used by these authors were those of Bell (1981, private communication) and Kurucz (1979), which also differ strongly in the UV from the osmarcs and Kurucz (1992) models. Finally, Bessell & Norris (1987) derived [O/H] and [O/Fe] for a model with 5650/3.5/2.65 (the corresponding values obtained by us are [O/H] and [O/Fe]). The line list used in that work was based on the Goldman & Gillis (1981) data. This is also the case in our analysis, as well as in those of Bessell et al. (1991) and Nissen et al. (1994), but not that of Ryan et al. (1991), who used a line list based on Kurucz (1989, private communication).
Another star in common with Nissen et al. (1994) is HD 84937. Using the set of parameters 6090/4.0/2.4 they obtained [O/H]=1.87. Adopting our stellar parameters (Table 1) and taking into account the difference between Kurucz and osmarcs models their abundance translates into [O/H]=1.57, which is just slightly lower than our mean value listed in Table 3 for five OH lines (1.450.07).
In summary, independent LTE synthetic spectra of near-UV OH lines obtained using osmarcs or Kurucz (computed with the code atlas9 without overshooting) model atmospheres, line lists taken from Goldman & Gillis (1981) and adjusted to reproduce the solar spectrum, and the same stellar parameters (especially ) provide very similar oxygen abundances. These abundances are shown to be more reliable than those obtained when using older model photospheres with a coarser treatment of the opacities in the UV.
4.2 Oxygen abundances from OH versus IR triplet
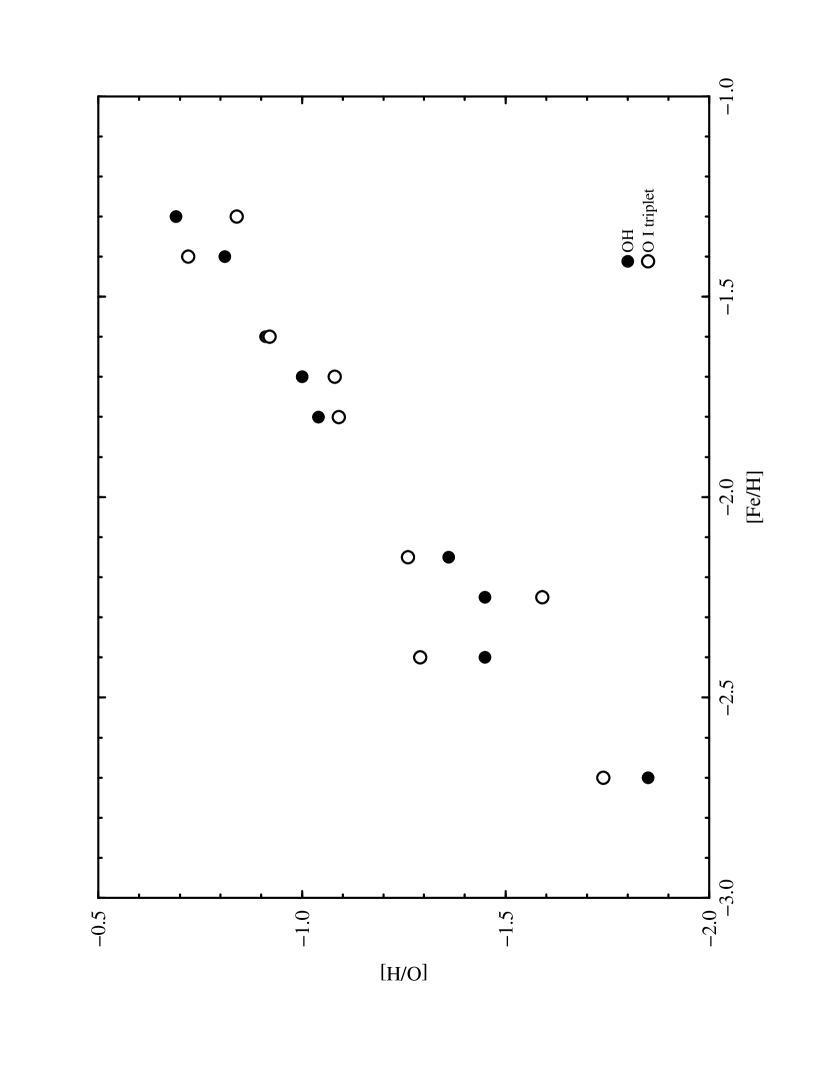
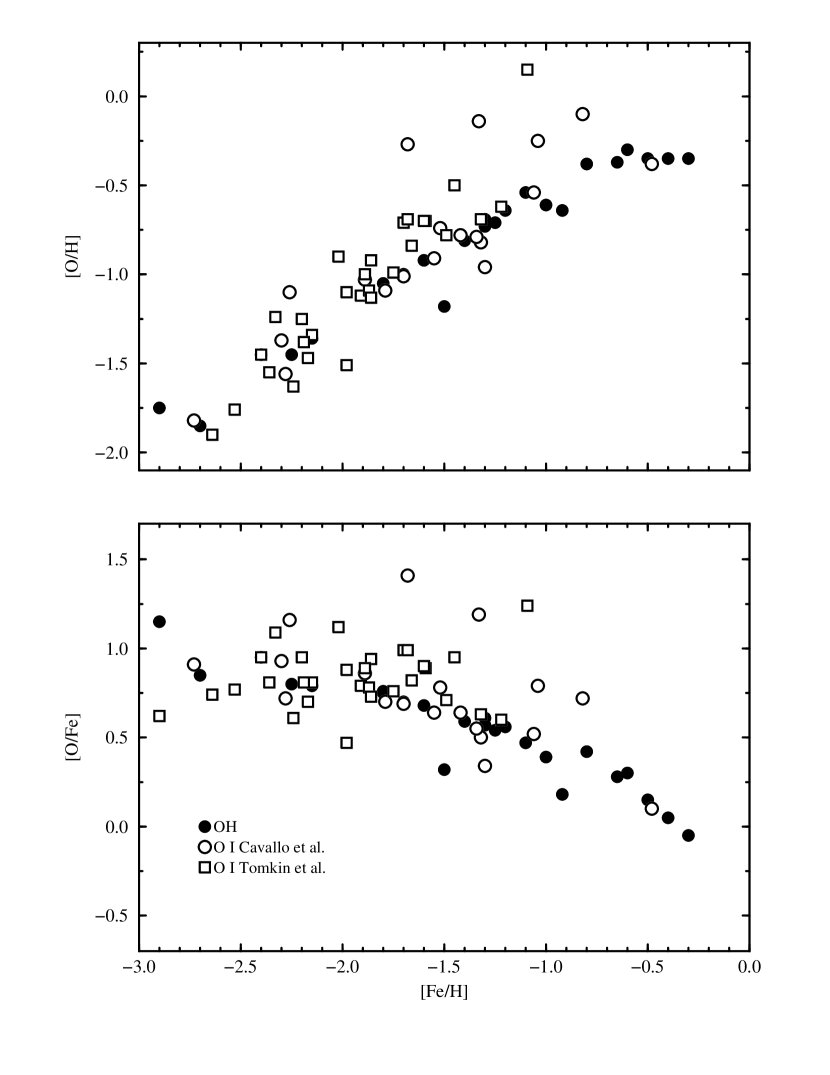
To compare our OH oxygen abundances with those coming from the O I IR triplet, we have computed them using the equivalent widths measured by Tomkin et al. (1992) and the stellar parameters listed in Table 1. The same LTE code, model atmospheres, and microturbulence used for the OH lines were employed, while the oscillator strengths were taken from Tomkin et al. Our solar oxygen abundance, derived using 5777/4.44/0.0 and equivalent widths of the O I triplet measured on the Kurucz et al. (1984) solar atlas, is log (O) (the error quoted is associated only with the uncertainties in measuring the equivalent widths). Using a microturbulence km s-1 (instead of 1 km s-1) would decrease the solar abundance to log (O). In Fig. 7 are plotted the oxygen abundances with respect to the Sun derived from OH lines and the IR triplet for nine stars in common with our sample. The agreement between both sets of abundances is very good (with a mean difference of dex) and they delineate the same trend of [O/H] with [Fe/H]. An independent comparison with abundances derived from the O I triplet is shown in Fig. 8, where we have plotted the abundances derived from OH lines together with those derived (in LTE) directly by Tomkin et al. (1992), and Cavallo et al. (1997). It can be seen that, in general, the [O/H] and [O/Fe] ratios follow the same trend with metallicity for both indicators. The abundances derived from the OH lines are mainly located in the lower part of the distribution of the measurements in the diagrams, which can be explained in terms of the different stellar parameters and models of atmospheres used by the other authors as we have seen above.
As an external confirmation to these comparisons, Spite (1997) has shown that it is possible to reconcile the oxygen abundances derived from the O I triplet and UV OH lines in dwarf stars by carefully selecting the effective temperatures and using state-of-the-art model photospheres. She illustrates this with a re-analysis of three stars ([Fe/H]) studied by Tomkin et al. (1992), and Nissen et al. (1994), for which Spite et al. (1996) provide values based on a relation. Once the reddening has been taken into account, this relation provides effective temperatures which are systematically 40–60 K hotter than those adopted by Tomkin et al. Spite (1997) estimated the new values of [Fe/H], [O/Fe]OH, and [O/Fe]OI, and find , 0.66, and 0.68, respectively, which correspond to the mean values of the three stars. This [O/Fe]OH value is dex lower than our mean value in the same metallicity range, which, again, can be explained by the effects of using Kurucz and osmarcs model photospheres (the latter one employed by Spite) and slightly different stellar parameters.
Balachandran & Carney (1996) studied the oxygen abundance of the star HD 103095 in detail using IR OH and CO lines located at the and bands, respectively; they also consistently re-assessed the abundances derived from the O I triplet and the [O I] 6300 Å line with similar model atmospheres to those employed in our work. With a set of stellar parameters also very similar to those used in our analysis, they obtained [O/H], [O/H], and [O/H]. This star is included in the group of nine stars in common with Tomkin et al. (1992), and our estimate for the oxygen abundance derived from the O I triplet, [O/H], is in excellent agreement with the corresponding value of Balachandran & Carney. However, there is a difference of 0.24 dex between the abundances derived from OH lines in the UV and IR. As explained before, HD 103095 is also one of the two stars for which the synthetic OH spectra look broader than the observed ones, and this could explain part of the discrepancy. In any case, the difference in abundance is well within the error bars.
Tomkin et al. (1992) examined both C and O in halo dwarfs, using CI and CH lines and the O triplet. They found a temperature-dependent divergence between the abundances from C I and CH and concluded that the C I abundances suffered a temperature-related error. They have also argued by extension that the O I abundances suffered a similar error, but that the stellar C/O ratio could be reliably obtained from the C I and O I lines. Based on this, they concluded that the C/O ratio in halo dwarfs was relatively constant. There is a problem when making the analogy between C I versus CH and O I versus OH. In the present paper we do not find a divergence between abundances for O I and OH. We consider that the fact that oxygen and carbon abundances derived from molecular lines do not show trends versus effective temperature, in contrast with the abundances derived from atomic lines, could be an indication of model atmosphere and radiative transfer problems which deserve a careful investigation which goes beyond the scope of this paper.”
4.3 OH versus forbidden lines
We have found only four dwarfs in our sample for which oxygen abundances have been derived using [O I]. These are HD 22879 (King & Boesgaard 1995), HD 76932 (Magain 1987; Barbuy 1988), HD 103095 (Spite & Spite 1991; Balachandran & Carney 1996), and HD 134169 (Spite & Spite 1991). In Table 4 we list the model parameters used by each of these authors and the oxygen abundances they inferred from the [O I] line (columns 3 and 4, respectively). In order to compare these abundances with those we have derived from OH lines we have synthesized the forbidden oxygen line adopting the same set of stellar parameters than for the OH analysis and the value given by Lambert (1978). We derived the solar oxygen abundance from the 6300 Å forbidden line measured on the Kurucz et al. (1984) solar atlas and using the same model atmosphere previously employed for the OH and O I lines. From an equivalent width of 5.4 mÅ we obtained a solar oxygen abundance log (O), which is consistent with similar analyses in the literature (see e.g. Balachandran & Carney 1996). Then, using the equivalent widths provided by the authors for the 6300 Å line and our model parameters (Table 1) we derived the abundances that are listed in column 5, which we find in reasonable agreement with those in column 4, but still lower than those we derived from our OH lines (column 6).
When we compared the sensitivity of OH lines and the [O I] 6300 Å line to the stellar parameters we noticed the high effect of gravity in the latter case. We decided to investigate whether the reason of the discrepancy may lie in an inappropriate gravity determination for these objects. Fortunately, Hipparcos parallaxes are available for these stars from which we have inferred new, presumably better, gravities listed in column 7. In order to derive these gravities we followed the same recipe than Nissen, Høg, & Schuster (1998). These values are larger by 0.22 dex in average than the values we adopted in Table 1, which implies a reduction of the oxygen abundance inferred from OH lines and an increase of the abundance derived from the forbidden line. The final values are listed in columns 8 and 9 of Table 4, respectively, where both abundances show very good agreement for HD 22879 and HD 134169 and still some reasonable discrepancy of 0.15 dex for the other two stars, which can be accounted for by the uncertainties associated with the equivalent width measurements, which are particularly difficult in the case of extremely weak lines as it is the case of the forbidden line in these two stars (equivalent width less than 2 mÅ). In addition, and as we have already mentioned before, our OH analysis for HD 103095 provides broader than observed lines which make difficult to carry out detailed comparisons for this star. The average difference between oxygen abundances derived from OH and [O I] lines for our four stars is 0.09 dex. This exercise strongly suggests that an Hipparcos-based gravity scale may indeed be key to explain the discrepancies on oxygen abundances from forbidden and permitted lines in several unevolved metal-poor stars.
5 Discussion
5.1 Dependence of [O/H] and [O/Fe] on metallicity
The [O/H] abundances listed in Table 1 show a clear decrease with decreasing metallicity, and this is illustrated in Figure 4. A noteworthy feature of this figure is the smooth continuation of the trend found by Edvardsson et al. (1993) from their study of disk stars with 1.0 [Fe/H]0.3 using the O I IR triplet. Note that their abundances were scaled to the [O I] results of Nissen & Edvardsson (1992). Abundances derived from OH lines are slightly higher than those of Edvardsson et al. Simple linear regressions (not taking the error bars into account) performed on both samples show a common slope of , and a systematic difference of dex in the abundances. This effect could be associated with the systematic differences observed in abundances derived from Kurucz and osmarcs model photospheres.
Our [O/Fe] ratios are listed in Table 1 and plotted versus [Fe/H] in Figure 5. A shift of dex has been applied to the values of Edvardsson et al. (1993) to move them, on average, to the same abundance scale as that of our analysis. The figure shows a smooth trend of increasing [O/Fe] with decreasing metallicity. Nissen et al. (1994) found an increase in [O/Fe] from 0.4 to 0.8 between [Fe/H]=1.5 and 3.0. The corresponding increase in Fig. 5 goes from 0.6 to 1.0. As explained in §3, a difference of dex is related to the model photospheres and stellar parameters used in both analyses. The data do not indicate any clear flattening out of [O/Fe] with decreasing metallicity below [Fe/H], and can be fitted using a straight line with a slope (not taking the error bars into account) in this metallicity range. Taking into account the error bars in oxygen abundances and metallicities, using the routine fitexy of Press et al. (1992) available in the IDL Astronomy User’s Library, the resulting slope is for 17 stars.
We have investigated the presence of possible systematic dependences of [O/H] on or in Fig. 6 (upper and lower panels, respectively). The absence of any trend in these figures suggests that the uncertainties in the derived oxygen abundances are only related to the errors listed in Table 1 (with the exception of the errors implicit in the model photospheres and the uncertainties in applying the solar values to stars with different characteristics from the Sun).
5.2 Comparison between dwarf and giant stars: mixing in giants
We have discussed above the reliability of oxygen abundances derived from OH lines in metal-poor dwarfs and we are driven to conclude that the [O/Fe] ratio is systematically higher in dwarfs than in giants (up to 0.5 dex). Does this mean that O is depleted in giants, or is this discrepancy related to problems in the analysis of giants or in the analysis of the forbidden lines in general?
It is well known that the analysis of chemical abundances in cool metal-poor giants is subject to significant uncertainties. For instance, we note the work by Dalle Ore (1993), who found serious inconsistencies among the temperatures obtained from the excitation and ionization equilibria of several cool giants. The reliability of abundances based on the [O I] 6300 Å has been questioned by King & Boesgaard (1995). Therefore, there are reasons to be cautious when inferring conclusions from these measurements in giants and it would be worth measuring different oxygen spectral lines in these stars. Nevertheless, it is possible that the oxygen content of metal-poor giants is really lower on average than in dwarfs of similar metallicity. A plausible reason for this is mixing of nuclear-processed material, depleted in oxygen, with the upper atmospheric layers. Evidence for oxygen depletion in globular-cluster giants, associated with N enhancements, has been found by Pilachowski (1988), and low ratios of 12C/13C and 12C/14N have been discovered in several metal-poor giants (Sneden, Pilachowski, & VandenBerg 1986), indicating depletion of carbon. A global anticorrelation between O and Na has been discovered by Cohen (1978) and Peterson (1980) and confirmed by more recent studies of giants in M13, M3, and M5 (Kraft et al. 1992, 1995; Kraft 1994; Minniti et al. 1996). Recently Pilachowski, Sneden, & Kraft (1996) compared Na abundances in 60 metal-poor halo subgiants, giants and horizontal-branch stars with similar metallicities (but of higher luminosity) in globular clusters. They found a small effect of increasing [Na/Fe] by 0.12 dex when moving from halo subgiants to horizontal-branch stars, which could be interpreted as due to the dredgeup of Na-enriched material from CNO burning. In addition to CNO elements, Na, Mg and Al abundances are also correlated in a large number of globular cluster stars (Kraft 1994) showing the general effects of mixing. However, the degree of mixing which can be appealed is restricted by observables like the 12C/13C ratios, since it is likely that ON-cycled material will also show very low ratios.
On the theoretical side, Sweigart & Mengel (1979) have already proposed meridional currents to cause the mixing of CNO products with the upper atmosphere. It also became clear that Na and Al enhancements observed in many globular-cluster giants (Kraft 1994) can be produced by the 22Ne(p,)23Na reaction of the NeNa-cycle (Langer, Hoffman, & Zaidins 1997, and references therein). However, the fact that 22Ne is not an abundant part of Ne suggests considering the 14N(,)18F(,)18O(,)22Ne reaction as a source of 22Ne. Thus, one would need a material which had undergone significant ON or CN processing. In the O-depleted layers one would also expect a transformation of the 26Mg and 25Mg isotopes of Mg into Al in the MgAl-cycle (Langer, Hoffman, & Sneden 1993). Recently Denissenkov, Weiss, & Wagenhuber (1997) argued against the purely primordial interpretation (Cottrell & Da Costa 1981) of the large star-to-star abundance variations observed in many globular-cluster giants. They have proposed a mechanism which combines primordial abundance anomalies with deep mixing. It has also been shown recently (Langer et al. 1997) that the use of updated rates of Ne–Na cycle reactions can explain the Na–O abundance anticorrelation observed in globular-cluster giants, and the Na–N correlation observed in field halo giants. Even without going into details of the theory which explains depletion of different elements and their mixing with an upper atmosphere, it has become increasingly apparent that giants are not reliable for studying the primordial abundances of CNO-cycle elements. Clearly, it is not safe to use CNO, Na, Al and Mg elements in giants as probes of Galactic chemical evolution.
5.3 On the chemical evolution of oxygen in the Galactic halo
Our [O/Fe] versus [Fe/H] curve shows that the [O/Fe] ratio increases monotonically with decreasing metallicity until it reaches 1.0 at [Fe/H]. We do not observe a clear “plateau” or a change in the slope at low metallicities when all error bars are taken into account, in contrast with McWilliam et al.’s (1995) claim for a flattening in the overabundance of other elements at metallicities between 2.0 and 3.0. The most metal-deficient star in our sample (BD 23°3130) is a giant, and it is possible that the [O/Fe] derived for this star is not primordial for the reasons mentioned above, but, even removing this object from the plot, the evidence for any flattening of the distribution of points at very low metallicites is very marginal, and it seems that the [O/Fe] ratio continues increasing below [Fe/H]. It is of considerable importance to extend the number of oxygen measurements at such low metallicities to investigate the nucleosynthesis by supernovae at early times, the mixing of the ejected material in the interstellar medium (Audouze & Silk 1995), as well as the possible existence of a pre-Galactic population of super-massive stars.
There is increasing evidence for a large scatter in the abundances of other elements in some halo stars with metallicities below . McWilliam et al. (1995) found negative [Mg/Fe] ratios in the stars CS22968-014 and CS22952-015, with [Fe/H] near , while Fuhrmann, Axer, & Gehren (1995) found [Mg/Fe] for BD 3°740. At the same time, McWilliam et al. (1995) have found [Mg/Fe] for CS22949-037, another very metal-poor star with [Fe/H]. The origin of this scatter, and its possible relation to the MgAl nuclear cycle (Langer et al. 1993), which would induce large enhancements of Al which are not observed, are issues which still remain unresolved. Star-to-star differences exist also for heavy elements in metal-poor stars (Gilroy et al. 1988; McWilliam et al. 1995). This is in fact an indication that the protohalo was not well mixed before these low-mass stars formed. The large abundance variations observed at very low metallicities can be caused, for example, by shot noise from the small number of SNe determining the Galactic nucleosynthesis during the first epochs of star formation. It will be very important to check whether or not the oxygen abundances show a similar scatter at very low metallicities, as well as the correlation with Mg and Ca. This abundance determination can be carried out by using OH lines, since they will be observable even at extremely low metallicities.
5.4 The ages of globular clusters
Freedman et al. (1994) and Mould et al. (1995) estimate the age of the Universe from measurements of the Hubble constant based on observations with Hubble Space Telescope (HST) and arrive at =8–11 Gyr, while Sandage et al. (1996) find =11–15 Gyr. These determinations appear to be in conflict with the so far generally accepted ages of globular clusters =15.82.1 Gyr (see e.g. Bolte & Hogan 1995). Recently D’Antona, Caloi, & Mazzitelli (1997) have shown that the FST (full spectrum of turbulence) models of stellar evolution may decrease the estimated ages of globular clusters but by an amount not exceeding 10 with respect more conventional stellar evolution models. Their best estimate is =11–12 Gyr, offering a plausible way to alleviate any age discrepancy.
Our finding of the high [O/Fe] ratios at low metallicities may also play an important role in resolving an “age conflict”. The abundance of oxygen affects both the internal opacity and the energy generation (thermonuclear burning) of cool metal-poor stars near the turn-off loci of the color-magnitude diagram. Ages derived from comparison of theoretical evolutionary tracks with observational color-magnitude diagrams will be significantly affected (VandenBerg 1992, and references therein). It has been shown that, for very metal-poor stars, the reduction in age caused by an oxygen enhancement is first of all caused by the change in the H-burning nucleosynthesis rate through the CNO cycle. From the computations of isochrones and the plots of the turn-off luminosity versus age (VandenBerg 1992) one finds that an increase of 0.5 dex in [O/Fe] implies a reduction of 1 Gyr in the estimated age. If our oxygen values are representative of the initial oxygen abundances of globular-cluster stars, it would imply a considerable reduction of globular cluster ages. For example, the use of isochrones with oxygen enhancement given by our value [O/Fe]=0.8 at [Fe/H]=2.5 will reduce the age estimation of a globular cluster by 2 Gyr with respect to isochrones with solar [O/Fe]. D’Antona et al. (1997) considered an oxygen enhancement of 0.3–0.5 dex when dealing with the age analysis for the most metal-poor globular clusters; based in our results, a larger enhancement, 0.8–1.0 dex, appears more adequate, implying that their best age estimate for these clusters should be reduced by 1 Gyr, to arrive at 10–11 Gyr. It is very important to determine oxygen abundances in turn-off stars of the most metal-poor globular clusters to confirm whether their oxygen overabundances are as high as we find in field unevolved halo stars.
6 Conclusions
We have obtained oxygen abundances of metal-poor unevolved stars from an analysis of OH lines observed with high spectral resolution in the near ultraviolet. We find that the [O/Fe] ratio increases linearly as metallicity decreases from [Fe/H]0.5 to , reaching values of 0.6 at [Fe/H] =1.5 and 1.0 at [Fe/H] =3.0. This result is in good agreement with the [O/Fe] ratios derived using the O I IR triplet (Abia & Rebolo 1989; Tomkin et al. 1992; Cavallo et al. 1997), and is consistent with a smooth extrapolation of the results by Edvardsson et al. (1993) in disk stars of higher metallicities.
For two stars in common with the OH analysis of Nissen et al. (1994) we find oxygen abundances that differ by less than 0.2 dex. The difference, which is within error bars, can be explained by the use of different model atmospheres (Kurucz models versus osmarcs), different line lists, and slightly different stellar parameters. For four stars in our sample we have derived oxygen abundances from the [O I] 6300 Å line which are consistent within measurement errors with those inferred from the OH lines. The use of presumably more reliable gravities determined from Hipparcos parallaxes seems to be key to understand the discrepancies between abundances based on these two types of lines in dwarf stars. The fact that oxygen abundances derived from UV lines, from the O I triplet, and from the [O I] line agree supports the reliability of our measurements. Our work stresses the previously noticed discrepancy between abundances of metal-poor dwarf and giant stars. Either the analysis of the forbidden lines in giants is subject to larger uncertainties than currently accepted, or oxygen is depleted in these stars via mixing processes, which is rather plausible given the amount of evidence supporting internal mixing in globular-cluster giants and to some extent in their field counterparts.
We conclude that field halo dwarfs are better tracers of the early evolution of oxygen in the Galaxy. We do not find any flattening out of [O/Fe] with decreasing metallicity from 0 to 3. Extrapolation of our results to much lower metallicities suggests that the average ratio of oxygen to iron provided by the first Type II SNe was close to 1.0 dex or possibly higher, as opposed to previous findings based on the analysis of the forbidden lines in giants giving values close to 0.5 dex. Our observations suggest a reduction of current estimates of ages of very metal-poor globular clusters which may contribute significantly to remove any conflict among them and values of the age of the Universe inferred from recent measurements of the Hubble constant.
References
- Abia & Rebolo (1989) Abia, C., & Rebolo, R. 1989, ApJ, 347, 186
- (2) Alonso, A., Arribas, S., & Martínez-Roger, C. 1996, A&A, 313, 873
- Anders & Grevesse (1989) Anders, E., & Grevesse, N. 1989, Geochim. Cosmochim. Acta, 53, 197
- Arnett (1978) Arnett, W. D. 1978, ApJ, 219, 1008
- Audouze & Silk (1995) Audouze, J., & Silk, J. 1995, ApJ, 451, L49
- Balachandran & Carney (1996) Balachandran, S., & Carney, B. W. 1996, AJ, 111, 946
- Barbuy (1988) Barbuy, B. 1988, A&A, 191, 121
- Bessell et al., (1984) Bessell, M. S., Hughes, S. M. G., & Cottrell, P. L. 1984, Publ. of Ast. Soc. of Austral., 5, 547
- Bessell & Norris (1987) Bessell, M. S., & Norris, J. E. 1987, J. of A&A, 8, 99
- Bessell et al., (1991) Bessell, M. S., Sutherland, R. S., & Ruan, K. 1991, ApJ, 383, L71
- Blackwell et al. (1990) Blackwell, D. E., Petford, A. D., Arribas, S., Haddock, D. J., & Selby, M. J. 1990, A&A, 232, 396
- Bolte & Hogan (1995) Bolte, M., & Hogan, C. J. 1995, Nature, 376, 399
- Cavallo et al., (1997) Cavallo, R. M., Pilachowski, C. A., & Rebolo, R. 1997, PASP, 109, 226
- Cohen (1978) Cohen, J. G. 1978, ApJ, 223, 487
- Cottrell & Da Costa (1981) Cottrell, P., & Da Costa, G. 1981, ApJ, 245, L79
- D’Antona, Caloi & Mazzitelli (1997) D’Antona, F., Caloi, V., & Mazzitelli, I. 1997, ApJ, 477, 519
- (17) Dalle Ore, C. M. 1993, PhD Thesis, University of California, Santa Cruz
- Denisenkov, Weiss & Wagenhuber (1997) Denissenkov, P. A., Weiss, A., & Wagenhuber, J. 1997, A&A, 320, 115
- Edvardsson et al., (1993) Edvardsson, B., Andersen, J., Gustafsson, B., Lambert, D. L., Nissen, P. E., & Tomkin, J. 1993, A&A, 275, 101
- Freedman et al., (1994) Freedman, W. L. et al. 1994, Nature, 371, 757
- (21) Fuhrmann, K., Axer, M., & Gehren, T. 1995, A&A, 301, 492
- (22) García López, R. J., Rebolo, R., Pérez de Taoro, M. R., & Alonso, A. 1998, A&A (in preparation)
- (23) García López, R. J., Severino, G., & Gomez, M. T. 1995, A&A, 297, 787
- Gilroy et al., (1988) Gilroy, K. K., Sneden, C., Pilachowski, C. A., & Cowan, J. J. 1988, ApJ, 327, 298
- Goldman and Gillis (1981) Goldman, A., & Gillis, J. R. 1981, J. Quant. Spec. Radiat. Transf., 25, 111
- Gratton & Ortolani (1989) Gratton, R. G., & Ortolani, S. 1989, A&A, 211, 41
- King (1993) King, J. R. 1993, AJ, 106, 1206
- King (1994) King, J. R. 1994, ApJ, 436, 331
- King & Boesgaard (1995) King, J. R., & Boesgaard, A. M. 1995, AJ, 109, 383
- Kiselman (1993) Kiselman, D. 1993, A&A, 275, 269
- Kiselman and Nordlund (1995) Kiselman, D., & Nordlund, Å. 1995, A&A, 302, 578
- Kraft (1994) Kraft, R. P. 1994, PASP, 106, 553
- Kraft et al., (1992) Kraft, R. P., Sneden, C., Langer, G. E., & Prosser, C.F. 1992, AJ, 104, 645
- Kraft et al., (1995) Kraft, R. P., Sneden, C., & Langer, G. E. 1995, AJ, 109, 2586
- (35) Kurucz, R. L. 1979, ApJS, 40, 1
- Kurucz et al., (1984) Kurucz, R. L., Furenlid, I., Brault, J., & Testerman, L. 1984, Solar Flux Atlas from 296 to 1300 nm, NOAO Atlas No. 1
- Kurucz (1993) Kurucz, R. L. 1993, CD-ROMs, ATLAS9 Stellar Atmospheres Programs and 2 Grid (Cambridge: Smithsonian Astrophys. Obs.)
- Lambert, D. (1978) Lambert, D. L. 1978, MNRAS, 183, 249
- Langer, Hoffman & Sneden (1993) Langer, G. E., Hoffman, R., & Sneden, C. 1993, PASP, 105, 301
- Langer, Hoffman & Zaidins (1997) Langer, G. E., Hoffman, R., & Zaidins, C. S. 1997, PASP, 109, 244
- Magain (1987) Magain, P. 1987, in IAU Symp 132, The Impact of Very High S/N Spectroscopy on Stellar Physics, ed. G. C. d. Strobel and M. Spite (Dordrecht: Kluwer), p. 458
- Maeder (1992) Maeder, A. 1992, A&A, 264, 105
- McWilliam et al., (1995) McWilliam, A., Preston, G. W., Sneden, C., & Searle, L. 1995, AJ, 109, 2757
- Minniti et al., (1996) Minniti, D., Peterson, R. C., Geisler, D., & Clariá, J. J. 1996, ApJ, 470, 953
- Moore et al., (1966) Moore, C. E., Minnaert, M. G. J., & Houtgast, J. 1966, The Solar Spectrum 2935 Å to 8770 Å, National Bureau of Standards, Monograph 61
- Mould et al., (1996) Mould, J., et al. 1995, ApJ, 449, 413
- Nissen & Edvardsson (1992) Nissen, P. E., & Edvardsson, B. 1992, A&A, 261, 255
- Nissen et al., (1994) Nissen, P. E., Gustafsson, B., Edvardsson, B., & Gilmore, G. 1994, A&A, 285, 440
- Nissen et al., (1997) Nissen, P. E., Hg, E., & Schuster, W. J. 1998, proceedings of the “Hipparcos Venice’97 Symposium”, ESA SP-402 (in press)
- Pavlenko (1991) Pavlenko, Ya. V. 1991, Soviet Astr., 35, 212
- Peterson (1980) Peterson, R. C. 1980, ApJ, 237, L87
- Pilachowski (1988) Pilachowski, C. 1988, ApJ, 326, L57
- Pilachowski, Sneden & Kraft (1996) Pilachowski, C., Sneden, C., & Kraft, R. 1996, AJ, 111, 1689
- Piskunov et al., (1992) Piskunov, N. E., Kupka, F., Ryabchikova, T. A., Weiss, W. W., & Jeffery, C. S. 1995, A&AS, 112, 525
- Press et al. (1992) Press, W. H., Teukolsky, A. A., Vetterling, W. T., & Flannery, B. P. 1992, Numerical Recipes, 2nd. ed., Cambridge University Press, Cambridge
- Ryan et al., (1991) Ryan, S. G., Norris, J. E., & Bessell, M. 1991, AJ, 102, 303
- Sandage et al., (1996) Sandage, A., Saha, A., Tammann, G. A., Labhardt, L., Panagia, N., & Macchetto, F. D. 1996, ApJ, 460, L15
- Sneden et al. (1986) Sneden, C., Pilachowski, C., & VandenBerg, D. A. 1986, ApJ, 311, 826
- Sneden et al. (1991) Sneden, C., Kraft, R. P., Prosser, C.F., & Langer, G. E. 1991, AJ, 102, 2001
- Spiesman & Wallerstein (1991) Spiesman, W. J., & Wallerstein, G. 1991, AJ, 102, 1790
- Spite (1997) Spite, M. 1997, in IAU Symp. 189, Fundamental Stellar Properties: The Interaction between Observations and Theory, ed. T. Bedding, A. Booth & J. Davis (Dordrecht: Kluwer), p. 185
- Spite & Spite (1991) Spite, M., Spite, F. 1991, A&A, 252, 689
- Stark et al., (1994) Stark, G., Brault, J. W., & Abrams, M. C. 1994, J. of Opt. Soc. of Amer. B, 11, 3
- Sweigart and Mengel (1979) Sweigart, A. V., & Mengel, J. G. 1979, ApJ, 229, 624
- Takeda (1995) Takeda, Y. 1995, PASJ, 47, 463
- Theilemann, Nomoto & Hashimoto (1997) Theilemann, F.-K., Nomoto, K., & Hashimoto, M. 1996, ApJ, 460, 108
- Tinsley (1979) Tinsley, B. M. 1979, ApJ, 229, 1046
- Tomkin et al., (1992) Tomkin, J., Lemke, M., Lambert, D. L., & Sneden, C. 1992, AJ, 104, 1568
- VandenBerg (1992) VandenBerg, D. 1992, ApJ, 391, 685
- Woosley & Weaver (1995) Woosley, S. E., & Weaver, T. A. 1995, ApJS, 101, 181


| Star | [Fe/H] | [O/H] | [O/Fe] | ||
|---|---|---|---|---|---|
| HD 6582 | 5330100 | 4.300.15 | 0.650.10 | 0.370.22 | 0.28 |
| HD 19445 | 5810150 | 4.300.10 | 2.150.10 | 1.360.32 | 0.79 |
| HD 22879 | 5915100 | 4.100.15 | 0.800.20 | 0.380.23 | 0.42 |
| HD 38510 | 5780100 | 3.900.10 | 0.920.20 | 0.720.22 | 0.20 |
| HD 64090 | 5385100 | 4.450.10 | 1.800.10 | 1.040.22 | 0.76 |
| HD 76932 | 5800100 | 3.850.10 | 1.100.10 | 0.620.23 | 0.48 |
| HD 84937 | 6210120 | 4.000.10 | 2.250.15 | 1.450.25 | 0.80 |
| HD 94028 | 5975120 | 4.100.10 | 1.600.10 | 0.910.25 | 0.69 |
| HD 103095 | 5030100 | 4.550.35 | 1.300.10 | 0.680.26 | 0.62 |
| HD 134169 | 5820100 | 3.800.15 | 1.000.20 | 0.610.22 | 0.39 |
| HD 140283 | 5550100 | 3.350.10 | 2.700.10 | 1.850.22 | 0.85 |
| HD 157214 | 5625100 | 3.700.15 | 0.600.20 | 0.290.22 | 0.31 |
| HD 165908 | 6010120 | 4.050.15 | 0.400.20 | 0.350.25 | 0.05 |
| HD 166913 | 5965120 | 3.900.20 | 1.800.10 | 1.050.27 | 0.75 |
| HD 170153 | 6100120 | 4.000.20 | 0.300.20 | 0.350.26 | 0.05 |
| HD 188510 | 5495100 | 4.100.10 | 1.700.10 | 1.010.23 | 0.69 |
| HD 189558 | 5650100 | 3.500.10 | 1.300.20 | 0.730.22 | 0.57 |
| HD 194598 | 5960120 | 4.150.10 | 1.400.15 | 0.810.27 | 0.59 |
| HD 201889 | 5615100 | 3.600.15 | 1.250.15 | 0.710.25 | 0.54 |
| HD 201891 | 5870100 | 4.000.10 | 1.200.20 | 0.630.23 | 0.57 |
| HD 211998 | 5280100 | 3.000.20 | 1.500.15 | 1.180.23 | 0.32 |
| HD 225239 | 5605100 | 3.150.20 | 0.500.20 | 0.360.22 | 0.14 |
| BD 23°3130 | 5130150 | 2.500.30 | 2.900.20 | 1.730.33 | 1.17 |
| BD 37°1458 | 5260100 | 3.000.20 | 2.400.10 | 1.430.27 | 0.97 |
| Transition | (Å) | (Å) | (eV) | |||
|---|---|---|---|---|---|---|
| (18.5) | 3084.895 | 3084.887 | 1.943 | 1.906 | 0.037 | 0.067 |
| (5.5) | 3085.199 | 3085.194 | 2.013 | 2.060 | 0.007 | 0.843 |
| (9.5) | 3123.948 | 3123.945 | 1.982 | 2.086 | 0.104 | 0.204 |
| (15.5) | 3127.687 | 3127.672 | 1.581 | 1.590 | 0.009 | 0.612 |
| (5.5) | 3128.060 | 3128.060 | 2.425 | 2.358 | 0.067 | 0.102 |
| (8.5) | 3128.107 | 3128.101 | 2.998 | 3.221 | 0.223 | 0.209 |
| (8.5) | 3128.286 | 3128.278 | 2.026 | 2.070 | 0.044 | 0.209 |
| (17.5) | 3139.169 | 3139.161 | 1.559 | 1.762 | 0.203 | 0.760 |
| (21.5) | 3167.169 | 3167.167 | 1.823 | 1.694 | 0.129 | 1.108 |
| (16.5) | 3186.084 | 3186.088 | 1.958 | 2.097 | 0.139 | 0.685 |
| (18.5) | 3203.975 | 3203.970 | 1.815 | 1.920 | 0.105 | 0.843 |
| (23.5) | 3255.492 | 3255.485 | 1.844 | 1.835 | 0.009 | 1.300 |
| Star | 3084 | 3085 | 3123 | 3127 | 3128.1 aaBlended with OH (1,1) 3128.06 Å. | 3128.3 | 3139 | 3167 | 3186 bbBlended with OH (1,1) 3185.98 Å. | 3203 | 3255 | [O/H] |
|---|---|---|---|---|---|---|---|---|---|---|---|---|
| HD 6582 | – | – | 0.35 | 0.45 | 0.35 | 0.45 | – | – | 0.25 | – | – | 0.370.08 |
| HD 19445 | 1.35 | 1.25 | 1.35 | 1.45 | 1.35 | 1.45 | 1.25 | 1.35 | 1.25 | 1.35 | 1.55 | 1.360.09 |
| HD 22879 | – | – | 0.40 | – | 0.45 | 0.20 | 0.45 | – | – | – | – | 0.380.10 |
| HD 38510 | – | – | 0.60 | 0.80 | 0.70 | 0.70 | 0.80 | – | – | – | – | 0.720.08 |
| HD 64090 | – | – | 0.90 | 1.00 | 1.10 | 1.10 | 1.10 | – | – | – | – | 1.040.08 |
| HD 76932 | 0.70 | 0.50 | 0.50 | 0.50 | 0.65 | 0.50 | 0.70 | 0.70 | 0.60 | 0.70 | 0.80 | 0.620.10 |
| HD 84937 | – | – | 1.40 | 1.55 | – | 1.50 | 1.45 | 1.35 | – | – | – | 1.450.07 |
| HD 94028 | – | – | 0.80 | – | 0.90 | 0.90 | 0.90 | 0.90 | 1.00 | – | 1.00 | 0.910.06 |
| HD 103095 | – | – | 0.60 | 0.60 | 0.60 | 0.60 | 0.80 | 0.90 | 0.680.12 | |||
| HD 134169 | 0.50 | 0.60 | 0.50 | 0.60 | 0.60 | 0.60 | 0.55 | 0.70 | 0.60 | 0.60 | 0.80 | 0.610.08 |
| HD 140283 | 1.80 | 1.80 | 1.80 | 1.90 | 1.80 | 1.80 | 1.80 | 1.95 | 1.80 | 1.95 | 1.95 | 1.850.07 |
| HD 157214 | 0.40 | 0.30 | 0.20 | 0.30 | 0.30 | 0.30 | 0.30 | 0.20 | 0.20 | 0.30 | 0.40 | 0.290.07 |
| HD 165908 | 0.40 | 0.30 | 0.30 | 0.40 | 0.30 | 0.40 | 0.25 | 0.40 | 0.30 | 0.40 | 0.40 | 0.350.06 |
| HD 166913 | – | – | 1.15 | – | – | – | 0.95 | – | – | – | – | 1.050.10 |
| HD 170153 | 0.40 | 0.30 | 0.30 | 0.40 | 0.20 | 0.50 | 0.30 | 0.40 | 0.30 | 0.40 | 0.35 | 0.350.08 |
| HD 188510 | – | – | – | 1.20 | 1.00 | 1.00 | 0.95 | 0.90 | 0.90 | 1.00 | 1.10 | 1.010.10 |
| HD 189558 | – | – | 0.70 | 0.60 | 0.60 | 0.80 | 0.70 | 0.80 | 0.70 | 0.80 | 0.85 | 0.730.09 |
| HD 194598 | – | – | 0.95 | 0.80 | 0.70 | 1.00 | 0.80 | 0.70 | 0.70 | – | 0.80 | 0.810.11 |
| HD 201889 | – | – | 0.85 | 0.65 | 0.75 | 0.75 | 0.55 | 0.55 | 0.55 | 0.80 | 0.95 | 0.710.14 |
| HD 201891 | – | – | 0.50 | 0.70 | 0.65 | 0.60 | 0.60 | 0.60 | 0.50 | 0.75 | 0.80 | 0.630.10 |
| HD 211998 | – | – | 1.30 | 1.20 | 1.10 | 1.20 | 1.10 | – | – | – | – | 1.180.08 |
| HD 225239 | 0.40 | 0.30 | 0.30 | 0.40 | 0.35 | 0.30 | 0.30 | 0.35 | 0.30 | 0.45 | 0.45 | 0.360.06 |
| BD 23°3130 | – | – | 1.70 | 1.70 | 1.70 | 1.80 | 1.60 | 1.70 | 1.70 | 1.90 | – | 1.730.08 |
| BD 37°1458 | – | – | 1.20 | 1.30 | 1.50 | 1.20 | 1.50 | 1.50 | 1.40 | 1.55 | 1.70 | 1.430.16 |
| Star | Ref. | //[Fe/H] | [O/H][OI] | [O/H][OI] | [O/H]OH | [O/H]OH | [O/H][OI] | |
|---|---|---|---|---|---|---|---|---|
| literature | literature | Table 1 | Table 1 | Hipparcos | Hipparcos | Hipparcos | ||
| HD 22879 | K&B | 5859/4.29/0.84 | 0.59 | 0.61 | 0.38 | 4.38 | 0.48 | 0.50 |
| HD 76932 | C | 5840/3.90/1.04 | 1.02 | 1.00 | 0.62 | 4.12 | 0.72 | 0.90 |
| HD 103095 | B&C | 5050/4.70/1.22 | 0.89 | 0.93 | 0.68 | 4.68 | 0.73 | 0.88 |
| HD 134169 | S&S | 5780/3.40/1.00 | 0.97 | 0.78 | 0.61 | 4.00 | 0.68 | 0.70 |
References. — K&B, King & Boesgaard 1995; C, Cavallo et al. (1997); B&C, Balachandran & Carney (1996); S&S, Spite & Spite (1991). For HD 76932 we list the stellar parameters and oxygen abundance given by Cavallo et al. (1997) who reanalyzed the measurement of Magain (1987), while for HD 103095 we show the parameters and abundance listed by Balachandran & Carney (1996) who used the equivalent width provided by Spite & Spite (1991).