The hidden X–ray Seyfert nucleus in 3C 273: BeppoSAX Results
Abstract
We present the results of 5 BeppoSAX AO1 Core Program observations of 3C 273 performed in Jan. 1997 and compare them in detail with data obtained during the satellite Science Verification Phase (SVP), in Jul. 1996 (Grandi et al. 1997).
3C 273 was about 15% brighter in the first 1997 observation than in the last one, and, on average, a factor 2 brighter than the SVP observation. A count rate variation in the 2–10 keV band of % in day was clearly detected during the last of the four pointings.
Power–law fits with Galactic absorption to all observations yield spectral indices in the range . Though a power law is an acceptable representation of the data in the whole 0.1–200 keV range, there is indication of a steepening of the spectrum as the energy increases. Residuals with respect to a single power law suggest the presence of a weak fluorescence iron line in the MECS data. No other features are detectable. Our data therefore mark a difference with respect to the SVP data, where a steeper power law below 0.5 keV, an absorption feature at keV, and a more prominent fluorescence iron line have been found.
The weakening of cold/warm matter signatures in our data with respect to the SVP ones may indicate that, at higher luminosities, the featureless continuum produced in a relativistic jet overwhelms any thermal and/or reprocessed radiation, while the two components were almost comparable during the lower state of Jul. 1996.
We quantitatively test this scenario, by considering an emission model which comprises the contribution from a thermal Seyfert–like nucleus and a non–thermal power–law component, and find that indeed the observed features in both the AO1 and SVP data are consistently reproduced by varying only the intensity of the non–thermal emission. Within this scenario, this radio–loud source shows evidence not only for thermal disk–like emission, but also substantial reprocessing of X–rays onto cold matter. There is no evidence of a direct correlation between the two components.
Key Words.:
Quasar: 3C 273; X–rays: galaxies1 Introduction
3C 273 is a nearby () quasar, and is one of the extragalactic objects best studied across the entire electromagnetic spectrum. It shows almost all the features proper of high–luminosity quasars, i.e. radio and optical jet with high polarization, double radio lobes, superluminal motion, variability at all frequencies, broad emission lines and signs of thermal emission in the UV band (Big Blue Bump). Multifrequency campaigns (e.g. Courvoisier et al. 1987) showed that the broad band Spectral Energy Distribution (SED) is rather complex, with two clear peaks at UV ( eV) and ray ( MeV) energies (Ramos et al. 1997, von Montigny et al. 1997). The general interpretation is that the radio–to–ray continuum is produced by the jet either via synchrotron and inverse Compton emission (e.g. Marscher & Travis 1996, Ghisellini et al. 1996), or by a proton-initiated cascade (Mannheim 1993), while the accretion disk is responsible for the UV bump (see von Montigny et al. 1997, and discussion therein). Part of the accretion disk thermal emission could be Comptonized in an accretion disk corona (e.g., Haardt & Maraschi 1991), or in the hot two temperature inner disk region, along the line originally proposed by Shapiro, Lightman & Eardly (1976), and more recently by Chakrabarty & Titarchuk (1995).
The first detection in the X–ray band was obtained by Bowyer et al. (1970). Observations in the medium–hard X–ray range (up to 30 keV with GINGA) showed a hard power law continuum with photon index ranging between (Turner et al. 1990, 1991; Williams et al. 1992; Yaqoob et al. 1994), while both EXOSAT (Turner et al. 1995) and, more recently, ROSAT data (Staubert 1992) reveal evidence of an excess above the extrapolation of the hard power law at energies keV. The study of the spectrum as seen by ROSAT (Leach, McHardy & Papadakis 1995) indicates the presence of a soft component (0.1–0.3 keV) with photon index uncorrelated with the hard X–ray power law. Cold matter signatures such as a Compton reflection hump and an iron line were barely detected by GINGA (Williams et al. 1992). An emission line at 6.4 keV (source frame) seen at low flux levels was later confirmed by ASCA (Cappi & Matsuoka 1996).
3C 273 shows prominent ray emission as well, detected by OSSE (Johnson et al. 1995), COMPTEL (Hermsen et al. 1993) and EGRET (Hartman et al. 1992), on board the Compton Gamma–Ray Observatory (CGRO). OSSE data reveal that the hard power law extends up to 1 MeV, with a break at higher energies (McNaron–Brown et al. 1995).
Recently (Jul. 1996), the BeppoSAX SVP observation of 3C 273 has, for the first time, made available a simultaneous coverage of the 0.2–200 keV energy band. Grandi et al. (1997) confirmed that the power law extends at least up to 200 keV without any appreciable deviation, neither a Compton reflection hump nor a break. At energies below 1 keV both an absorption feature and a soft excess were present in the spectrum. A weak iron line at 6.4 keV (source frame) was also present, with an equivalent width (EW) 30 eV, consistent with GINGA (Williams et al. 1992) and ASCA (Cappi & Matsuoka 1996) results.
Here we present and discuss the results of pointings of 3C 273 performed in Jan. 1997. We will also make a comparison of these data with the SVP data, in view of understanding the long term behaviour of the source. The 3C 273 observations discussed here are part of the AO1 Core Program dedicated to bright blazars.
The paper is organized as follows: in §2 observations and data reduction techniques are described, while §3 is devoted to the presentation of data analysis procedures. In §4 we present BATSE and optical data obtained during simultaneous observations. Results are then discussed, together with implications for theoretical models, in §5. Finally, a brief summary and conclusions are drawn in §6. Results of a preliminary analysis have been discussed in Maraschi, Fossati & Haardt (1997) and Haardt et al. (1997). If not otherwise indicated, hereinafter energies are measured in the observer frame.
2 Observations and data reduction
| Obs. (start date) | Net Exposure Time (ks) | Count rate (cts/s) | |||||
|---|---|---|---|---|---|---|---|
| LECS | MECS | PDSa | LECSb | MECSc | PDSd | ||
| A (01/13/97) | 13.6 | 25.4 | 22.8 | ||||
| B (01/15/97) | 13.3 | 24.1 | 21.6 | ||||
| C (01/17/97) | 12.5 | 27.6 | 25.0 | ||||
| D (01/22/97) | 8.8 | 22.5 | 18.6 | ||||
| a Exposure time for half of the PDS effective area. | |||||||
| b 0.12–4.0 keV count rate. | |||||||
| c 1.6–10.5 keV count rate. | |||||||
| d 13–200 keV count rate on half of the effective area. | |||||||
2.1 The BeppoSAX mission in brief
For an exhaustive description of the Italian/Dutch BeppoSAX mission we refer to Boella et al. (1997). Here we briefly review the main characteristics of the instrumentation, and the data reduction techniques applied.
The narrow field coaligned instrumentation on BeppoSAX consists in a Low Energy Concentrator Spectrometer (LECS), three Medium Energy Concentrator Spectrometers (MECS), a High Pressure Gas Scintillation Proportional Counter (HPGSPC), and a Phoswich Detector System (PDS). The LECS and MECS have imaging capabilities in the 0.1–10 keV and 1.3–10 keV energy band, respectively, with energy resolution of % at 6 keV. At the same energy, the angular resolution is about 1.2 arcmin (Half Power Radius). In the overlapping energy range the MECS effective area ( cm2) is times that of the LECS. The HPGSPC covers the range 4–120 keV, and the PDS the range 13–300 keV. In the overlapping energy interval, the PDS is more sensitive, while the HPGSPC has a better energy resolution. HPGSPC data will not be discussed in the present paper.
2.2 The BeppoSAX observations
The observations of 3C 273 were performed as part of the BeppoSAX AO1 Core Program. The source was observed between Jan. 13–23, 1997. In this period 3C 273 has been observed 5 times: Jan. 13, observation period (OP) 1492, hereinafter referred as observation ”A”; Jan. 15, OP 1502, observation ”B”; Jan. 17–18, OP 1513, observation ”C”; and Jan. 22–23, OP 1561 and OP 1563, observation ”D”. The datasets of the last two OPs have been merged into a single one due to the extremely short exposure time of OP 1561. The total effective exposure was 45.2 ks in the LECS, 92.1 ks in the MECS, and 88.0 ks in the PDS. A journal of observations is given in Table 1. For comparison, the net exposure times for LECS, MECS and PDS in the SVP were 12, 131 and 128 ks, respectively.
2.3 LECS and MECS data reduction
Light curves and spectra for the LECS and the MECS have been accumulated using the Xronos and Xselect tools (Ftools v4.0). We extracted the events from within a radius of 8’ for the LECS and 6’ for the composite MECS image, consisting of the three co–added MECS images. These selected events were then used to construct the light curves and to accumulate energy spectra for each pointing. Different spectral binnings have been used and tested, such as the pre–constructed channel grouping templates as provided by the BeppoSAX Science Data Center (SDC)111For details, see documentation at URLs http://www.sdc.asi.it/software/cookbook/spectral.html and ftp://www.sdc.asi.it/pub/sax/cal/responses/grouping/, or more standard groupings aimed to achieve a given minimum S/N across the entire spectrum. Unless otherwise indicated, the results of the spectral analysis will refer to spectra accumulated over the grouping2 template released by the SDC.
LECS data have been considered only in the range 0.12–4 keV due to calibration problems at higher energies (Guainazzi 1997). The average count rate in the four 3C 273 pointings is 0.726 cts/s in the LECS, and 1.766 cts/s in the MECS. Spectral analysis has been performed with the XSPEC 10.00 package, using the response matrices released in Sept. 1997.
2.4 PDS data reduction
The PDS was operated in collimator rocking mode, with a pair of units pointing at the source and the other pair pointing at the background, the two pairs switching on and off source every 96 seconds.
Source visibility windows were selected following the criteria of no Earth occultation and high voltage stability during the exposures. In addition, the observations closest to the South Atlantic anomaly were discarded from the analysis. From collimators positions the ON and OFF time windows were also created and merged with the source visibility window to create the final time windows on which the source+background and background spectra were accumulated for each of the four PDS units, using the XAS software package, with an improved rise–time correction. The source was detected above 3 up to 200 keV in pointings A,B,C, and only up to 150 keV in D. The grouped spectra from the four units were then coadded.
In the calibrated energy band ( 12–200 keV), the spectra were binned for all pointings in 15 energy intervals. The fits were performed with the XSPEC 10.00 package using a response matrix appropriate for the improved, channel-dependent, subtraction of the background, for the correction for the dead layer of the PDS crystals, and for the improved rise–time correction. The average PDS count rate in the four pointings is 1.29 cts/s, on half of the effective area.

3 Data analysis and results
3.1 Temporal analysis
In Fig. 1, 2 and 3 the overall light curves for the three instruments are shown. A decreasing trend is apparent in all the three instruments. We selected the MECS data for a detailed temporal analysis, as they are the BeppoSAX data best suited for such a purpose, on account of better statistics and reliable performance stability.
The MECS count rate monotonically decreases on time scale of days (Fig. 2). The difference in the count rate between the first and last observation is %. Similar variations are present also in the LECS and PDS data (Table 1), although the paucity of data does not allow to simply set limits on any lag between different spectral bands. We applied the test to the total MECS light curve using time bin size ranging from 100 to 8000 s, and found that, independently of the time binning used, the count rate variation is significant at 99.99% level.
The general trend shows up also in the LECS and PDS (see Table 1, and Fig. 2 and 3), though the lower statistics does not allow a meaningful comparison with the MECS light curve.

We also checked for MECS variability within single pointings. While the first three observations are consistent with a constant count rate, the last one is not, at the 99.88% significance level. The count rate reverses the decreasing trend and increases by about % in about half a day.

| Obs. | () | |||
|---|---|---|---|---|
| A | (0.75) | |||
| B | (1.41) | |||
| C | (1.11) | |||
| D | (1.19) |
Note: quoted errors are 90% confidence intervals for 3 interesting parameters ().
(a) NH fixed at Galactic value cm-2.
(b) LECS power law normalization relative to the MECS.
(c) PDS power law normalization relative to the MECS.
3.2 Spectral analysis
We first present the broad band spectrum analysis and then consider each instrument separately.
3.2.1 Broad Band Spectrum

We jointly fit the data of the three instruments, for each of the four observations. The model adopted is a single power law with Galactic absorption (N cm-2, Lockman & Savage 1995). We add two further parameters, which we allow to be free, accounting for the mis-calibration of the LECS and PDS with respect to the MECS, which turned out to be the best calibrated instrument following independent tests.
The data and the data/model ratio are plotted in Fig. 4 and Fig. 5, respectively, while the best fit parameters are listed in Table 2. As the fit to the broad band spectrum is dominated, in terms of statistics, by the MECS data points, the best fit value of the spectral index is essentially that of the MECS data (see next §3.2.3). As shown in Table 2, a single absorbed power law is an acceptable representation of the data for observations A and C, it is marginally consistent with data set D, while it is rejected at 99.9% level in observation B. Visual inspection of Fig. 5 shows that large scatter is present in the PDS data, which also appear to be systematically steeper than the MECS data. A feature around keV is present in the LECS data.
It is worth noting that, though the relative LECS/MECS and PDS/MECS normalizations are marginally consistent with the fiducial ranges as given by the SDC (0.7–0.75 and 0.8–0.85, respectively), the LECS/MECS ratio possibly varies among different datasets. One should be careful in interpreting variations of the LECS/MECS normalization ratio, as the presence of the strongback and of a support grid structure in the LECS window can actually affect such quantity (Parmar et al. 1997). Recently, an in–flight raster scan of the central area of the LECS and MECS detectors (14 short observations of LMCX1) has allowed to map the LECS/MECS count ratio in the 2–8 keV band as a function of the position of the source in the LECS field of view. The scan has shown that the LECS/MECS ratio can decrease by about 22 across the detector (Ricci 1998, private comunication). However, such effect occurs when the centroid of the source lies at least at from the LECS center. Since 3C 273 was always in the center of the field of view during the AO1 observations, and the positions of the source centroid do not differ by more than , it is unlikely that window support obscuration affects the LECS/MECS ratio in our datasets.
Nevertheless we must stress that fiducial values apply only under the assumption that the fitted model is a good description of the data throughout all the three instruments. If the model fails to describe the data in one of the instruments, this affects the resulting value of the inter–calibration parameter.
We therefore conclude that a single power law, which is essentially determined by the MECS statistics, is not a good description of the data in the LECS and PDS instrument ranges.

3.2.2 LECS
| Obs. | NH | F[0.2-1]keV | () | |
|---|---|---|---|---|
| ( cm-2) | ( erg/cm2/s) | |||
| A | 1.69 (f) | 12.6/32 (0.40) | ||
| 11.3/31 (0.37) | ||||
| B | 1.69 (f) | 42.2/32 (1.32) | ||
| 35.4/31 (1.14) | ||||
| C | 1.69 (f) | 25.1/32 (0.78) | ||
| 25.1/31 (0.81) | ||||
| D | 1.69 (f) | 37.4/32 (1.17) | ||
| 30.7/31 (0.99) |
Note: quoted errors are 90% confidence intervals for one () or two interesting parameters ().
The LECS spectra for the four observations were fit by a simple power law with free absorption. Data/model ratios are plotted in Fig. 6, while the best fit parameters are presented in Table 3. All the four data sets can be fit reasonably well by the absorbed power–law model. The 90% confidence regions for NH and are shown in Fig. 7. The spectral index is also plotted in Fig. 8, for NH = NH,gal. The value of is in general smaller than that obtained in the broad band fit with fixed Galactic absorption. Observations B and D require a value of NH slightly lower than the Galactic absorption column density. This could indicate that a weak soft excess is present in the data, although the evidence is, at best, marginal. In fact the spectral indices for all the four observations are, within the errors, consistent with the average value (see also Fig. 8). No apparent correlation of NH with the flux is found.

As evident from Fig. 5 and 6, in all the observations other than A, most of the contribution to the is due to residual structures at keV. It is known that they are spurious and produced by a mis–calibration of the LECS in the Carbon edge region (Fossati & Haardt 1997, Guainazzi & Grandi 1997, Orr et al. 1997). The latest LECS response matrices coupled with the new data reduction pipeline strongly reduce the amplitude of these features, but do not completely remove them. Some excess of residuals is also present near keV, probably due to inaccuracies in the calibration of the instrumental gold feature.

Therefore, within these uncertainties, LECS data are consistent with a power–law spectrum absorbed by Galactic material along the line of sight. In two out of four observations (B and D) there is some marginal indication of the presence of a soft excess. There is no evidence of changes of the spectral index among the four observations.

3.2.3 MECS
| Obs. | F[2-10]keV | () | |
|---|---|---|---|
| ( erg/cm2/s) | |||
| A | 29.0/37 (0.78) | ||
| B | 42.1/37 (1.14) | ||
| C | 36.7/37 (0.99) | ||
| D | 48.7/37 (1.32) |
Note: quoted errors are 90% confidence intervals for one interesting parameter ().
(a) NH fixed at LECS best fit value (see Table 3).
MECS data of all of the four observations are well described by a single power law. Data/model ratios and best fit spectral indices are shown in Fig. 9 and 8 respectively, and their values are reported in Table 4. Cold gas absorption column density was fixed at the appropriate LECS value in each data set. In any case, its precise value does not affect the fit of the MECS data, as NH is always lower than several times cm-2.
With an average flux of erg/cm2/s [2–10 keV], the source was roughly in the middle of the range of fluxes historically observed ( erg/cm2/s) and the corresponding unabsorbed 2–10 keV luminosity in the Quasar frame is erg/s (/50 km/s/Mpc, ).

The energy spectral index is rather flat, with for three of the four observations (see Table 4), consistent with the GINGA results (Lawson & Turner 1996), but slightly flatter than ASCA 1994 observations (Yaqoob et al. 1994). The spectrum during observation C is instead steeper (). Given the small errors in the determination of the slope, the variation of spectral index, albeit small, is statistically significant. It is also important to note that the spectral index in the MECS range is only barely consistent with the index derived for the lower LECS energy range (see Fig. 8).
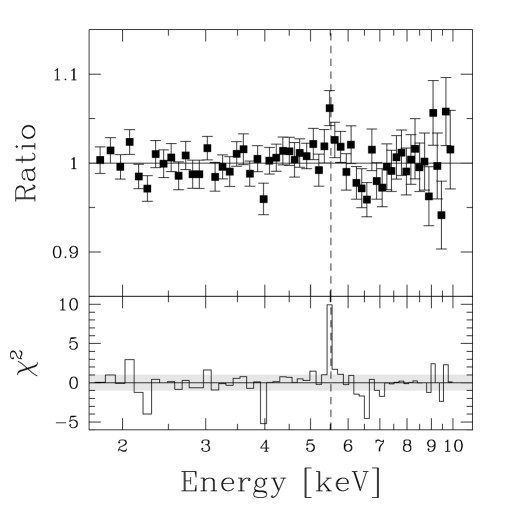
The inclusion of an iron emission line (at 6.4 keV) does not statistically improve the fit in any of the four observations. All the available MECS counts could be added in a single spectrum to improve the statistics but, in view of the difference existing in the value of between observation C and the other three, we chose to sum the data normalized to the best fit of each observation, with the errors propagated accordingly. Furthermore, as weak narrow features could be smoothed out using a bin size that is too wide, in order to test for emission lines we binned the spectrum using the grouping3 template, which allows for a larger number of bins than grouping2. As shown in Fig. 10, both the shape of the residuals with respect to a constant (), and the sum of the ratios itself, clearly indicate the presence of an emission line at the source frame energy of 6.4 keV. The significance of such a feature is above , and its equivalent width is estimated to be eV. Although the residuals in Fig. 10 might be even suggestive of the presence of an iron absorption edge at the expected energy, the statistics is not good enough to discriminate this feature from the noise.
3.2.4 PDS
| Obs. | F[20-100]keV | () | |
|---|---|---|---|
| ( erg/cm2/s) | |||
| A | 8.9/13 (0.69) | ||
| B | 20.1/13 (1.55) | ||
| C | 16.3/13 (1.25) | ||
| D | 2.6/12 (0.22) |
Note: quoted errors are 90% confidence intervals for one interesting parameters ().
Power law fits to the four PDS datasets alone are satisfactory in observations A, C and D (see Fig. 11 and Table 5), despite a large scatter in the data points (probably related to a not–well calibrated background subtraction). The exceedingly large value of the fit to observation B is essentially due to a single bin at keV, and, again, it is probably background related. The large error in the determination of the slope does not allow to detect spectral variations in the PDS data. The PDS spectral indices we derived are consistent with the OSSE results (McNaron–Brown et al. 1995). However, as shown in Fig. 8, they are statistically steeper than the MECS values in at least three out of four observations.

We also analyzed the PDS spectra extracted using the SAXDAS software package, which, among other differences, does not includes the rise–time correction (see Section 2.4). While the spectral indices are consistent with those reported in Table 5, the 90% confidence range is systematically shifted to lower values for all the four observations, and marginally consistent with the MECS slopes.
In conclusion, the steepening of the broad band spectrum towards higher energies (Fig. 8) is evident using the pipelines of both of the two data reduction softwares, though the significance and degree of such a trend depends somewhat on the adopted PDS data reduction technique.
3.3 SVP spectral analysis
It is useful to compare the results of the BeppoSAX AO1 observations with the previous BeppoSAX SVP data, presented in Grandi et al. (1997) where the interested reader may find a detailed description of the observations and data reduction.
We have repeated the LECS and MECS analysis of the SVP data taking advantage of the revised response matrices. The Grandi et al. results are, within the errors, quantitatively confirmed (see Table 6).
The MECS continuum is described by a power law which is marginally steeper than that observed in Jan. 1997, while the flux is a factor lower. MECS data also reveal a weak emission line interpreted as fluorescence Kα transition of cold or mildly ionized iron. In order to estimate the line equivalent width, we operated as follows: first, we obtained the slope of the continuum by fitting the data excluding the 5–6 keV interval (model (e) in Table 6), where the redshifted 6.4 keV line shows up; then we fit the continuum plus emission line keeping frozen the power law index, and the line energy and intrinsic width (model (f) in Table 6).
In the LECS data a clear absorption feature and possibly a soft excess below 0.5 keV, are superimposed to the power law. The fit to the 0.2–4 keV data with a broken power law (the slope at energies keV is kept fixed at the MECS value) is not statistically distinguishable from a fit with a single steep power law plus absorption edge (see Table 6). However, as shown in Fig. 12 the larger value of in the broken power law fit is entirely due to extra contributions occurring in the 0.5–0.7 keV range, i.e. there is a systematic defect at the energy of the absorption feature.


To further check the reliability of the absorption feature and soft excess detection, we computed the ratio between the SVP and the AO1 LECS data, as the ratio is certainly less subjected to instrumental effects. Fig. 13 unambiguously indicates that the soft excess and the absorption edge at 0.6 keV are genuinely present in the SVP data only.
| LECS | Model | NH | E/E | F[0.2-1]keV | () | ||
|---|---|---|---|---|---|---|---|
| ( cm-2) | (keV) | ( erg/cm2/s) | |||||
| PLa | 1.69 (f) | …. | …. | 0.152 | 43.2/32 (1.35) | ||
| PL+NHb | …. | …. | 0.148 | 29.4/31 (0.95) | |||
| BKN PLc | 1.69 (f) | 1.599 (f) | 0.154 | 30.7/31 (0.99) | |||
| PL+edged | 1.69 (f) | 0.149 | 24.0/30 (0.80) | ||||
| MECS | Model | NH | E | EW | F[2-10]keV | () | |
| ( cm-2) | (keV) | (eV) | ( erg/cm2/s) | ||||
| PLe | 1.69 (f) | …. | …. | 0.670 | 41.1/32 (1.28) | ||
| PL+linef | 1.69 (f) | 1.599 (f) | 6.4 (f) | 0.673 | 46.9/37 (1.27) |
Note: quoted errors are 90% confidence intervals for one (), two (), or three interesting parameters ().
(a) single power law with Galactic absorption.
(b) single power law with free absorption.
(c) broken power law with Galactic absorption.
(d) single power law with Galactic absorption plus absorption edge.
(e) single power law with Galactic absorption, excluding the data in the range 5–6 keV.
(f) single power law with Galactic absorption plus emission line. The line width is fixed at 0.1 keV, .
(g) Energy in the source frame.
Note also that the feature detected in the AO1 LECS data at 0.4 keV vanishes almost completely in the SVP/AO1 ratio. This implies that either it is equally present in both datasets or has an instrumental origin. We performed a survey in a sample of LECS datasets of different blazars (Fossati & Haardt 1997) and concluded that the latter option is the most likely.
4 Simultaneous observations
3C 273 has been constantly monitored by BATSE during the last few years, and it is of some interest to frame the BeppoSAX SVP and AO1 observations into such a long look of the source.
In Fig. 14 we show the BATSE light curve over 500 days covering both of the BeppoSAX observations. The fluxes in the 20–100 keV energy band have been obtained by folding a single power law of photon index 1.7, after the PDS results. The BATSE data were collected by the Large Area Detectors (LADs) in Earth occultation mode. The occultation of a hard X-ray source in the sky by the Earth produces a step like feature superposed to the continuous detector background count rate. A pair of rising and setting steps are generated, and the standard Earth occultation technique (Harmon et al. 1992) has been applied to monitor X-ray sources on a daily basis. In the case of 3C 273 a bin of 20 days of the daily data has been applied in order to improve the statistics and enlight the trend of the source on longer time scales.

Despite the fact that local minima or maxima are present in the BATSE light curve on monthly scale, Fig. 14 shows that the BeppoSAX SVP observation was performed during a period of long term increase of the source, while the AO1 observations occurred in a period of long term decrease.
We also performed an optical monitoring during the AO1 observations. The optical data were taken from Jan. 12 to Jan. 31 at the Torino Astronomical Observatory, with the telescope REOSC. The instrumentation comprises a CCD camera with per pixel scale and standard Johnson-Cousins filters. Typical exposure times for 3C 273 are 180 s in the R band, 240 s in V, and 300 s in B. Data were analyzed with the Robin procedure locally developed, which performs bias subtraction, flat field correction and circular Gaussian fit after background subtraction. The source magnitude is obtained by relative photometry with respect to the reference stars calibrated by Smith et al. (1985). Errors are of the order of a few hundredths of magnitude. Optical fluxes were calculated using the absolute flux calibration by Bessell (1979); no correction for galactic extinction is needed for 3C 273.
The R, B and V average magnitudes are 12.7, 13.0 and 13.1, respectively, corresponding to an integrated flux in R and V of erg/cm2/s, of erg/cm2/s in B. These values are slightly larger than the flux in the 2–10 keV band (see Table 4). It worths noting that no optical variability at a level larger than a few percent has been detected during the monitoring.
5 Discussion: The hidden Seyfert nucleus
As reported in the previous section, the AO1 data are only marginally consistent with a simple single power law model with Galactic absorption. There are (admittedly weak) indications of features, namely iron emission line and a high energy curvature of the BeppoSAX spectra. More importantly, the presence of these same (but stronger) features, absorption around 0.6 keV, and a soft excess component at very soft energies during the weakest SVP state, lead us to consider a more complex underlying (variable) emission model.
In particular, it has been already (qualitatively) suggested (see references in the Introduction, Cappi et al. 1998) that an iron emission line in the spectra of radio–loud quasars might indicate that the X–ray emission comprises two components: a Seyfert–like thermal X–ray spectrum, characterized by features induced by reflection over optically thick cold material subtending to the ‘primary’ source, and a flat non–thermal component, arising as emission from plasma moving at relativistic speed in the jet, as typical of radio–loud objects.
We therefore modelled the data with a complex model, consisting in the sum of a constant ‘thermal’ component and a variable non–thermal power law. Clearly our aim is not to obtain a significantly better fit for the AO1 data, but rather to determine whether the variations in the observed features between the different observations are consistent with the scenario of an accreting object which dissipates energy in an accretion disc and its corona but where also a powerful jet is formed producing extremely variable beamed emission.
The thermal spectrum has been represented by parameters typical of Seyfert spectra (e.g. Nandra & Pounds 1994) with a primary power–law emission impinging on cold matter subtending a 2 solid angle, giving rise to an iron line at 6.4 keV (source frame) with an EW of 150 eV. In order to establish the absolute normalization of the thermal component, we considered the SVP data. The flux of the underlying Seyfert–like spectrum is determined by the simple requirement that the intrinsic 150 eV of the iron line EW are observed, once diluted by the non–thermal component, as eV. This sets the flux of the Seyfert–like component at 6.4 keV (source frame) in the SVP to be 1/5 of the SVP total observed flux at this energy. We then assume that such flux level characterizes the Seyfert–like component in all the source states, i.e. the Seyfert–like component did not change among SVP and AO1 data. In other words, we test the hypothesis that all of the spectral differences observed among SVP and AO1 observations are accounted for by the variable non–thermal component. The latter has been modelled as a power–law with a (parabolic) turnover, to mimic the cutoff around a few MeV, detected in the –ray data (e.g. McNaron–Brown et al. 1995).


| Parameter | Value | Units |
|---|---|---|
| General Parameters | ||
| # NH | 1.69 | (1020 cm-2) |
| # z | 0.158 | |
| LECS/MECSb | ||
| PDS/MECSb | ||
| Seyfert Parameters | ||
| # R | 1 | |
| # Efold | 100 | (keV) |
| # cos(i) | 0.95 | |
| # | 1.9 | |
| # Eline | 6.4 | (keV) |
| # | 0.1 | (keV) |
| # F | (photons/cm2/s) | |
| E | (keV) | |
| # F[2-10keV] | 0.129 | (10-10 erg/cm2/s) |
| Jet Parameters | ||
| E | (keV) | |
| # E | 2.0 | (MeV) |
| F[2-10keV] | ||
| SVP: | 0.544 | (10-10 erg/cm2/s) |
| A: | 1.060 | (10-10 erg/cm2/s) |
| D: | 0.892 | (10-10 erg/cm2/s) |
| () | 230.6/238 (0.969) | |
Note:
(a) Parameters marked with a ’#’ have not been allowed to vary during the fit. The reported best–fit values and errors are those obtained keeping the value of the “Peak Energy” (Epeak) fixed at 2 MeV. The only parameter significantly affected by a change in Epeak is Ebreak. However for Epeak moving in the range 1 – 100 MeV it always holds E keV.
(b) quoted errors are 90% confidence intervals for one interesting parameter ( = 2.706).
(c) this line flux gives an equivalent width EW = 29, 16 and 19 eV for SVP, A and D datasets respectively.
Finally, as required by SVP–LECS data, we added to the model an absorption edge at low energy222We refer to Grandi et al. 1997 for a discussion of the origin of this feature., making the assumption that it actually affects only the Seyfert–like continuum.
We then fit this model to the LECS–MECS–PDS data, for SVP and the AO1 brightest and faintest states (A and D). The three states are fit simultaneously, i.e. the edge energy and optical depth, the non–thermal power law index, and the LECS/MECS, PDS/MECS inter–calibrations constants are forced to be the same for the different sets of data in the fitting procedure. Only the normalization of the non–thermal component is allowed to be different for different datasets.
The global fit is statistically good, with the best fit parameters reported in Table 7. The best fit model with all the different components relative to the SVP and AO1 data is shown in Fig. 15, and the data to model ratios for the three states are reported in Fig. 16.
The resulting values of the inter–calibration constants (LECS/MECS = , PDS/MECS= ) are very close to the fiducial figures recommended by the BeppoSAX SDC.
The edge is reasonably well constrained by the data at E keV with an optical depth .
The shape of the beamed component is determined by three parameters, namely the spectral index , the energy above which the spectrum has a parabolic (in log) shape , and the peak of the spectrum .
The beamed component turns out to have , fully consistent with spectral indices detected in the brightest states of this source, when the non–thermal emission is likely to completely dominate the X–ray flux. In particular, we considered the recent results from ASCA by Cappi et al. (1998). The uncertainties in the calibration discussed by Cappi et al. do not allow a quantitative comparison with the BeppoSAX results (see e.g. the discussion about the iron line EW by these authors). Nevertheless, we find that the model is also qualitatively consistent with the ASCA results, in particular with the hardening of the 2–10 keV spectrum as the source gets brighter.
The curved shape of the non–thermal continuum nicely accounts for the observed steep spectral index in the PDS range (see Fig. 8).
The quality of the fit is rather insensitive to the energy of the peak of the parabolic component, and good fits are compatible with the power law starting steepening at energies above the MECS range and peaking around a few MeV. The values reported in Table 7 are obtained with the peak of the parabolic component fixed at 2 MeV.
Our results show that BeppoSAX observations of 3C 273 can be interpreted in a framework where the increase of the non–thermal emission in the AO1–A swamps out the spectral features connected to the Seyfert–like component, such as the soft-excess, the absorption edge and the iron line. Moreover, it should be stressed that, in this model, the steep ‘primary’ thermal emission in the SVP state exceeds the non–thermal one at the lowest energies and naturally reproduces the steeper power law detected in the LECS energy range. The steepening of the higher energy spectrum observed in the AO1 data is simply interpreted as the curvature of the inverse Compton emission reaching its peak.
Once again, we stress that the model has not been constructed in order to best fit all the available data. The number of free parameters coupled with the data uncertainties would make this meaningless. Note in particular that there is no reason why any thermal component should be constant and there is actually clear evidence for variability in the spectral slope (e.g., observation C in AO1), with no apparent correlation with the source intensity. Similar uncorrelated spectral variations have been also reported in EXOSAT and GINGA observations (Turner et al. 1990). Also, we can not exclude that the reflection hump is at a level lower than assumed (i.e., ), as seems the case in Broad Emission Line Galaxies (Wozniak et al. 1998).
However, from the fitting of the three states (SVP, low and high states of AO1) we conclude that Seyfert–like emission from an accretion disk and its corona is likely present, roughly at comparable flux level with the highly variable beamed non–thermal emission from a relativistic jet. The model in fact well reproduces three BeppoSAX observations and is consistent with the ASCA ones, by only allowing for a change in the normalization of the non–thermal emission.
6 Summary and conclusions
The results of BeppoSAX observations of 3C 273 performed in Jan. 1997 have been presented. The source varied within the observations and with respect to previous SVP data. Most notable is the variation of X–ray features clearly detected during the low state SVP, and barely present in the AO1 data (and qualitatively consistent with the ASCA results recently reported by Cappi et al., 1998).
The variable strength of the observed spectral features is consistent with a spectrum consisting of X–ray emission by a typical Seyfert–like nucleus, namely direct and reprocessed radiation dissipated in or above an optically thick accretion disk, and a variable non–thermal beamed component generated by the plasma moving in the relativistic jet. Although the AO1 data could be satisfactorily modelled by a single power law, slightly steepening above keV, the comparison with the SVP phase suggests that any thermal emission is indeed more evident in low source states (corresponding to weaker non–thermal radiation). Indeed the data available can be basically accounted for in this picture, by varying the absolute value of the normalization of the non–thermal emission. Clearly, monitoring of 3C 273 to derive variability information on the broad BeppoSAX energy range will allow to develop a more consistent and detailed model.
Indications of thermal/Seyfert–like emission in 3C 273 have been recognized for a long time, in different spectral bands, showing that in this source both thermal and non–thermal emission processes are taking place, with comparable radiative dissipation rate. The X–ray results fit well and support this picture. Further observations of the high energy broad band spectra of radio–loud objects are critical in understanding the/any relationship between the dissipation in the accreting and ejected material.
Acknowledgements.
We thank the SAX–Team for providing valuable help and support, and M. Cappi, M. Guainazzi and S. Molendi for helpful comments and useful discussions. This research, in its early stages, made use of SAXDAS linearized and cleaned event files (rev0.0) produced at the BeppoSAX Science Data Center. GF and AC acknowledge the Italian MURST for financial support.References
- (1) Bessell M.S., 1979, PASP 91, 589
- (2) Boella G. et al., 1997, A&AS, 122, 299
- (3) Bowyer C.S., Lampton M., Mack J., de Mendonca F., 1970, ApJ, 161, L1
- (4) Cappi M., Matsuoka M., 1996, in Proc. of 2nd Integral Workshop, “The Transparent Universe”, St Malo, Ed. C. Winkler, T.J.-L Courvoisier & P. Durouchoux, ESA SP-382, p389
- (5) Cappi M., Matsuoka M., Otani M., Leighly K.M., 1998, PASJ in press
- (6) Chakrabarti S.K., Titarchuk L.G., 1995, ApJ, 455, 623
- (7) Courvoisier T.J.-L., et al., 1987, A&A, 176, 197
- (8) Fossati G., Haardt F., 1997, SISSA/ISAS report, ref. SISSA 146/97/A, (August 1997)
- (9) Ghisellini G., Maraschi L., Dondi L., 1996, A&AS, 120, 503
- (10) Grandi P., et al., 1997, A&A, 325, L17
- (11) Guainazzi M., 1997, private communication
- (12) Guainazzi M., Grandi P., 1997, BeppoSAX SDC technical report TR 14, August 1997
- (13) Haardt F., Maraschi L., 1991, ApJ, 380, L51
- (14) Haardt F., et al. 1997, In: “The Active X–ray Sky: Results from BeppoSAX and Rossi–XTE”, Scarsi L., Bradt H., Giommi P., Fiore F. (eds.), Nuclear Physics B Proc. Supp., in press
- (15) Harmon B.A., et al., 1992, The Compton Observatory Science Workshop, NASA CP3137, eds C.R. Shrader, N. Gehrels, B. Dennis, 69
- (16) Hartman R.C. et al., 1992, ApJ, 385, L1
- (17) Hermsen W. et al., 1993, A&A, 97, 97
- (18) Johnson W.N. et al., 1995, ApJ, 445, 182
- (19) Leach C.M., McHardy I.M., Papadakis I.E., 1995, MNRAS, 272, 221
- (20) Lockman F.J., Savage B.D., 1995, ApJS, 97, 1
- (21) Mannhein K., 1993, A&A, 269, 67
- (22) Maraschi L., Fossati G., Haardt F., 1997, Conf. Proc. S.I.F., vol. 58, p35
- (23) Marscher A., Travis J.P., 1996, A&AS, 120, 537
- (24) McNaron–Brown K., et al., 1995, ApJ, 451, 575
- (25) Nandra K., Pounds K.A., 1994, MNRAS, 268, 405
- (26) Parmar A.N., et al., 1997, A&AS, 122, 309
- (27) Ramos E., Kafatos M., Fruscione A., Bruhweiler F.C., McHardy I.M., Hartman R.C., Titarchuk L.G., von Montigny C., 1997, ApJ, 482, 167
- (28) Shapiro S.L., Lightman A.P., Eardley D.M., 1976, ApJ, 204, 187
- (29) Smith P.S., Balonek T.J., Heckert P.A., Elston R., Schmidt G.D., 1985, AJ 90, 1184
- (30) Staubert R., 1992, in X–Ray Emission from AGN and the Cosmic X–Ray Background, ed W. Brinkmann & J. Trümper (MPE Rep. 235), p42
- (31) Turner M.J.L., Courvoisier T., Staubert R., Molteni D., Trümper J., 1985, in Proc. of 18th ESLAB Symp., ed A. Peacock (Dodrecht: Reidel), p623
- (32) Turner M.J.L., et al., 1990, MNRAS, 244, 310
- (33) Turner M.J.L., Weaver K.A., Mushotzky R.F., Holt S.S., Madejski G.M., 1991, ApJ, 381, 85
- (34) von Montigny C., et al., 1997, ApJ, 483, 161
- (35) Williams O.R., et al., 1992, ApJ, 398, 157
- (36) Wozniak P.R., Zdziarski A.A., Smith D., Madejski G.M., Johnson W.N., 1998, MNRAS, in press
- (37) Yaqoob T., et al., 1994, PASJ, 46, L49