Detection of Li i enhancement during a long-duration flare in the recenltly discovered X-ray/EUV selected, chromospherically active binary 2RE J0743+224
D. Montes1,2, L.W. Ramsey1
1 The Pennsylvania State University,
Department of Astronomy and Astrophysics,
525 Davey Laboratory, University Park, PA 16802, USA
2 Departamento de Astrofísica,
Facultad de Físicas,
Universidad Complutense de Madrid, E-28040 Madrid, Spain
Presented at the: 192nd Meeting of the AAS (June 7-11 1998)
1998, Bull. American Astron. Soc., Volume 30, No. 3, (192, #82.03)
(see also: http://www.ucm.es/OTROS/Astrof/rej0743.html)
Abstract
We report the detection of a long-duration optical flare in the recenltly discovered, X-ray selected, chromospherically binary 2RE J0743+224. The high resolution echelle spectroscopic observations taken in 12-21th January 1998 exhibit a dramatic increase in the chromospheric emissions (H and Ca ii IRT lines) that we interpret as a flare based on: the temporal evolution of the event, the broad component observed in the H line profile, the detection of the He i D3 in emission and a filled-in He i 6678 Å.
During these obsevations we detect a Li i 6708 Å line enhancement which is clearly related with the temporal evolution of the flare. The maximum Li i enhancement occurs just after the maximum chromospheric emission observed in the flare. A significant increase of the 6Li/7Li isotopic ratio is also detected. From all this we suggest that this Li i enhancement is produced by spallation reactions during the flare. This is the first time that such Li i enhancement associate with a stellar flare is reported, and probably the long-duration of this flare is a key factor for this detection. A large fraction of the stellar surface seems to be covered by starspots during the event, as we deduce for the analysis of the TiO 7055Å band. Thus taking into account that Li i line is very temperature sensitive, we can not discard that the Li i variations are related the presence of starspots. However, the correlation with the temporal evolution of the flare, lack of detection of changes in the other photospheric absorption lines, and the large changes observed in the core of the Li i, as predict the models, argue in favour of the hypothesis that the Li i is produced during the flare.
A long-duration flare
2RE J0743+224 (BD +23 1799) is a chromospherically active star selected by X-rays and EUV emission detected in the Einstein Slew Survey and ROSAT Wide Field Camara (WFC) all sky survey, and classified as single-lined spectroscopic binary by (Jeffries et al. 1995). We present here high resolution (0.16 Å) echelle spectroscopic observations of this binary, obtained during a 10 night run 12-21 January 1998 using the 2.1m telescope at McDonald Observatory. These observations reveal it to be a double-lined spectroscopic binary with a orbital period of 10 days and a K1III primary.
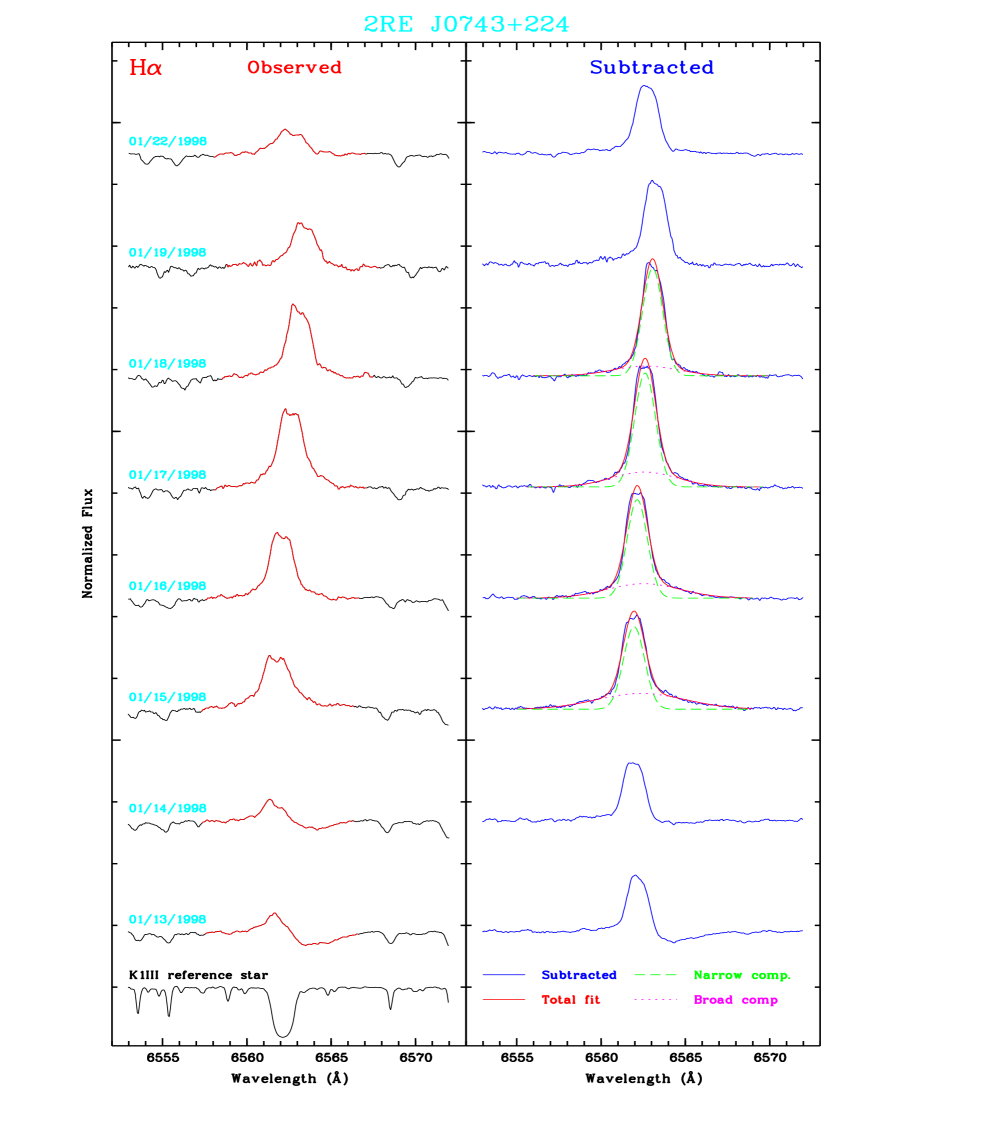
A dramatic increase in the chromospheric emissions (H and Ca ii IRT lines) is detected during the observations (see Fig. 1). Several arguments favor the interpretation of this behavior as an unusual long-duration flare.
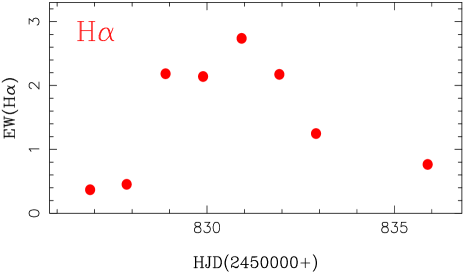
- 1) The temporal evolution of the event is similar to the observed in other solar and stellar flares, with an initial impulsive phase characterized by a strong increase in the chromospheric lines. The H emission equivalent width increases by a factor of 5 in only one day (from the 2nd to the 3rd night) and by a factor of 7 at the maximun (5th night). After maximum the emission decreases slowly (gradual phase) until the end of the observations (10th night) where the emission is larger than at the time of the 1st observation. The time evolution of the EW(H) during the flare is displayed in Fig. 2.
- 2) A broad component in the H line profile is observed just at the begining of the event. A two Gaussian components fit to the subtracted spectra is displayed in the right panel of Fig. 1.
- 3) The detection of the He i D3 in emission and a filled-in He i 6678 Å as have been observed in other solar and stellar flares (Zirin 1988; Huenemoerder & Ramsey 1987; Montes et al. 1996; 1997; 1998; Welty & Ramsey 1998).
The analysis of the TiO 7055Å (O’Neal et al. 1996) band indicates that a fraction of the stellar surface is covered by starspots. Strong changes are observed in this band deph from night to night in the same way that the chromospheric lines change. This suggest that the chromospheric region responsible for the flare is spatially coincident with photespheric cool spot(s) and could be produced, as have been observed in the largest solar flares, by the interaction of new emerging magnetic flux with old magnetic structures associated to the spot groups.
Li i enhancement during the flare
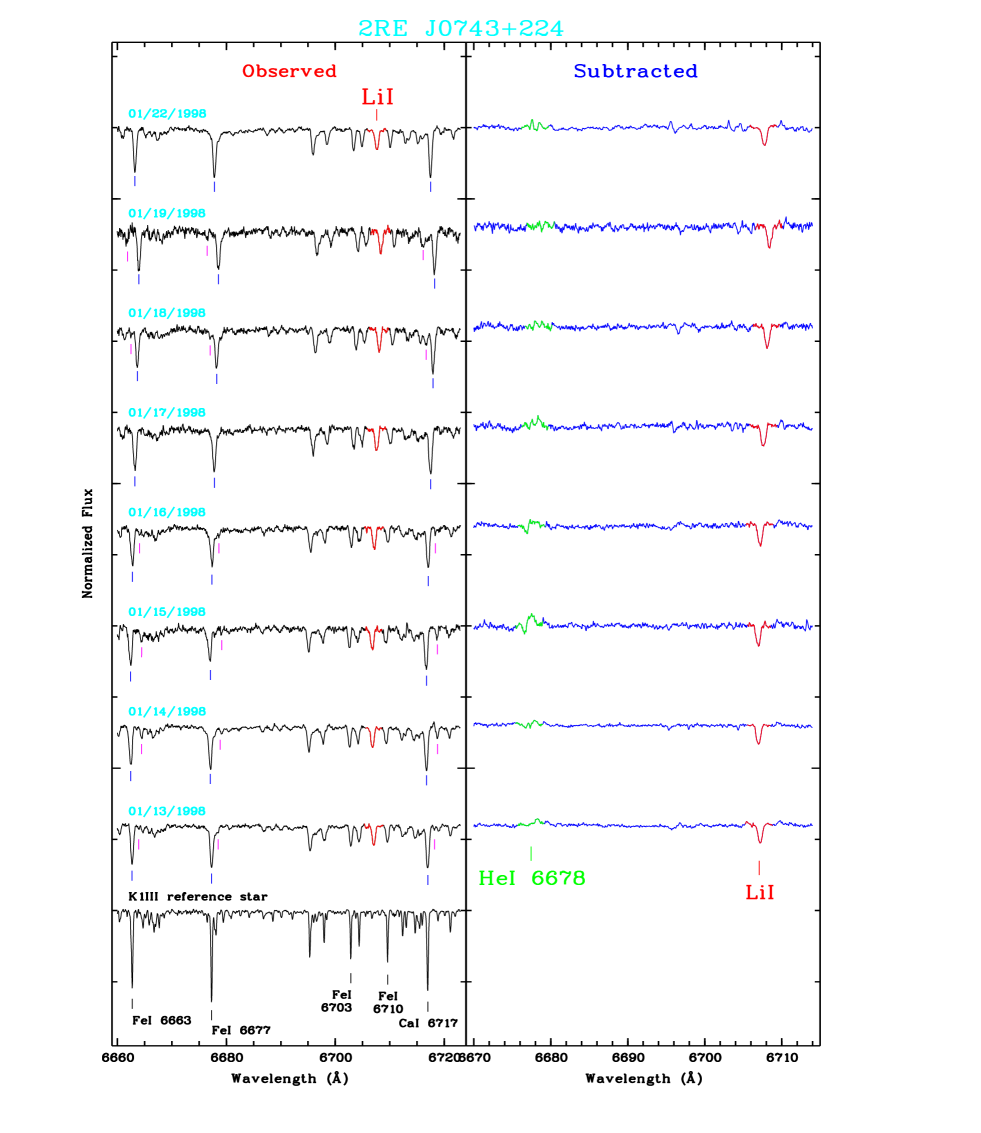
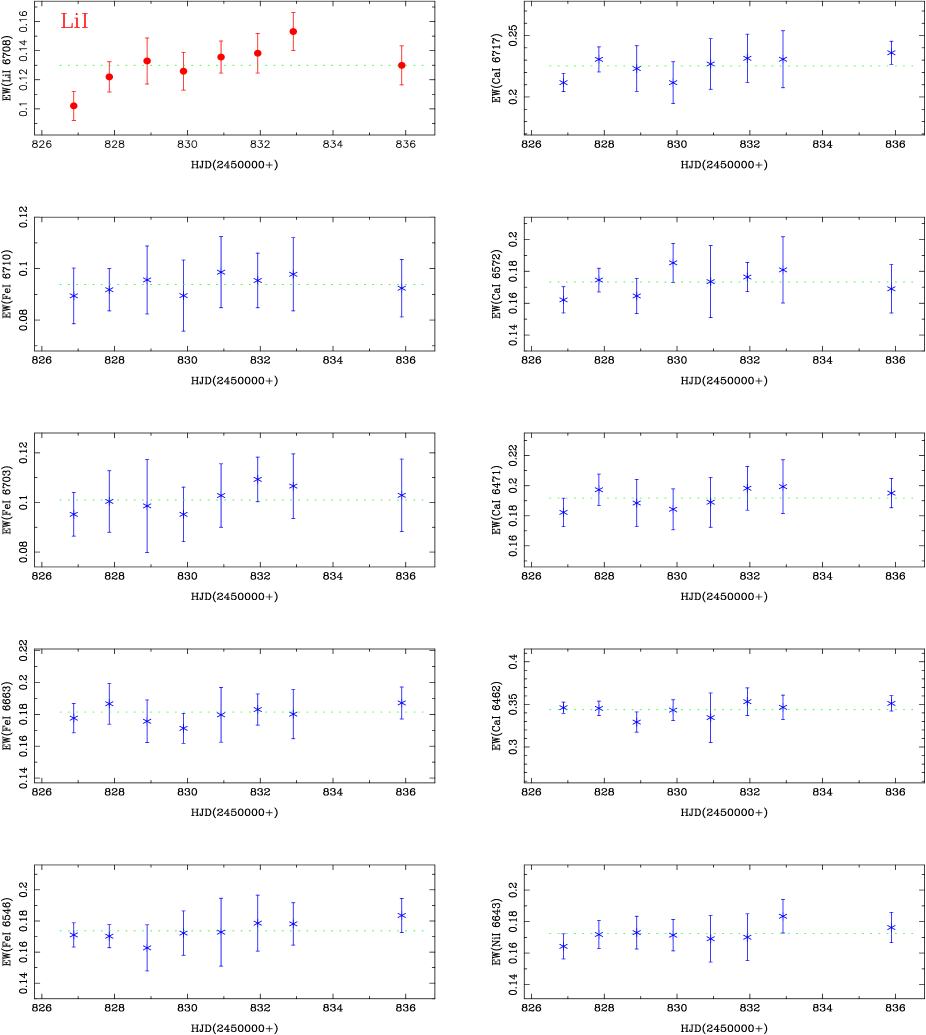
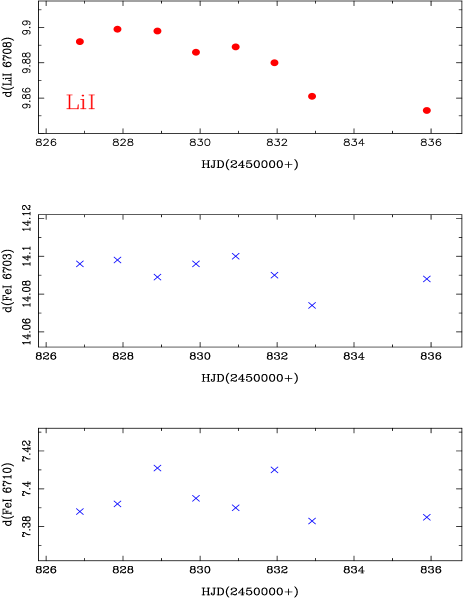
The Li i 6708 Å absorption feature is clearly observed in our spectra (Fig. 3) with a mean EW of 130 mÅ. The line appears centered at the wavelength-position corresponding to the primary component with no evidence for a contribution from the secondary. A carefull analysis of the Li i line indicates that the line profile, EW, and intensity, I, are changing during the observations. The measured EW and I are given in Table 1 and plotted in Fig. 4, where we can see that the increase of Li i line follows the temporal evolution of the flare. The maximum Li i enhancement (40% in EW) occurs just after the maximum chromospheric emission observed in the flare. In order to test if these variations are real we have also measured the EW of other photospheric lines. We have selected several isolated lines in the same spectral order as the Li i line; Fe i 6710.3 Å and Fe i 6703.6 Å close and similar in strength to the Li i line and the more intense lines Fe i 6663.4 Å and Ca i 6717.7 Å. Other intense lines included in different spectral order were also measured. All are neutral lines and, as the Li i line, the EW should be enhanced in a different way depending of their excitational potencial when the the temperature decrease. These lines are listed in Table 2 together with their excitational potencial and the mean EW, the standard deviation, and the peak to peak variation (EWmax - EWmin). The measured EW for each night is plotted in Fig 4. As can be see the variations in these lines are very small and contrary to the Li i line any correlation with the temporal evolution of the flare is observed. The peak to peak variation in the Li i line is a factor 3 larger than in the other lines. Furthermore, no clear systematic behaviour is observed with different excitation potentials.
The Li i line variations can be due to different causes, including line blends with other close lines or lines for the secundary componet in the SB2 sytem, variations related with starspots and faculae in the stellar surface, and Li formation by spallation reactions during the flare. In the following we discuss each of these possibilities to find the most plausible hypothsesis.
Line blends?
One source of variability of the Li i 6708 Å line could be the fact that it is blended with TiO bands at 6707.29, 6707.92, and 6708.16 Å and CN bands at 6707.64 Å and that these molecular bands become stronger at the lower temperatures of the starspots. However the calculations of the Li i abundance in sunspots that take into account these bands (Engvold et al. 1970; Ritzenhoff et al. 1997) concluded that the molecuar blend is of low importance. Thus it seems resonable assume that this effect in the stellar spectra is negligible.
At this spectral resolution the Li i line is blended with the nearby Fe i 6707.41 Å line, the EW of this line is normally subtracted from the measured Li i + Fe i in order to obtain the real value of the Li i EW. This Fe i is clearly see in the spectra of the inactive and Li free star HR 5340 (K1 III) which we use in the spectral subtraction. The mean EW measured in these spectra is 20 (mÅ), which is much smaller than the observed Li i EW. Furthermore, taking into account that the other photospheric lines we have measured did not show significant variations, we conclude that this line will not produce any variation in the measured Li i EW.
Due to the SB2 nature of this binary in some orbital phases the lines of the primary component could be blended with the lines from the secondary. This is clearly seen in the spectrum from the 5th night (which is very close the conjuntion). The EW of the strongest lines measured during this night are noticeably larger than in the rest of the nights due to the contribution (about 15%) to the EW from the secondary. We have corrected the EW for this effect by subtracting the EW of the lines in the secondary measured at other orbital phases where the lines are not blended. These corrected values are what we have plotted in Fig. 4. However, for weak lines with EW similar to the Li i line the contribution of the secondary seems to be negligeable and this effect is not observed.
In conclusion the observed Li i line variations do not seem to be due to any kind of line blends.
Starspots and faculae?
The Li i line variations could be related with possible cold spots and faculae in the stellar surface (see the review by Fekel 1996). Since this line is very temperature sensitive, the EW should be enhanced in dark spots but reduced in the bright facular regions as shown by solar observations (Giampapa 1984). While Giampapa (1984) suggests this can substantially alter the EW in stellar spectra, other authors find this is not the case. No detection of Li i EW variations in six active dwarfs have been reported by Boesgaard (1991). The calculations of Soderblom et al. (1993) indicate that the effect is only significant when the fraction of the surface covered by spots is very high (see also Stuik et al. 1997). Pallavicini et al. (1993) show by means of spectral synthesis simulations that the effects may be less pronounced than that suggested by Giampapa (1984) and found no evidence that changes in the EW is correlated with the photometric variability due to starspots in four active stars. The simulations done by Barrado (1996) also indicated smaller changes in the EW and even, in certain cases, the presence of faculae can cancel these changes. By aplication of the Doppler imaging technique Hussain et al. (1997) found no evidence for the Li i abundance being enhanced or depleted in starspots.
Until now significant variations in the Li i EW have been found only in some stars with very high Li i abundances such as pre-main sequence stars (Patterer et al. 1993; Fernández & Miranda 1998; Neuhäuser et al. 1998) and other young and very active stars (Robinson et al. 1986; Jeffries et al. 1994; Soderblom et al. 1996). Large EW variation has been observed at larger amplitude in V band in V410 Tau (peak to peak variability of 0.12 Å when the amplitude in V was 0.6 mag) (Fernández & Miranda 1998). This result is conrfirmed on the young star Par 1724 by Neuhäuser et al. (1998). However, in CAB little or no variations have been previously reported (Pallavicini et al. 1993) and in recent observations (Berdyugina et al. 1998) of the extremely CAB II Peg, which exhibits high V band variations and spot filling factors, very small Li i EW variations (10 mÅ), not quite correlated with quasi-simultaneous photometric observations, have been found.
The Li i EW variations that we observe are clearly larger than those reported in other CAB with similar activity levels and Li i abundance. In other stars that exhibit large Li i EW variations other photospheric lines exhibit similar EW variations (Fernández & Miranda 1998), contrary to the behaviour we observe in this star. Taking into account all these facts, the starspots, on the surface of 2RE J0743+224, not seem to be the primary cause of the Li i line variation we observed.
Spallation reactions?
The formation of Li by low energy spallation reactions in stellar flares was originally considered by Fowler et al. (1955), Canal (1974), Canal et al. (1975). The possibility of detecting Li i abundance inhomogeneities resulting from spallation reactions in the solar photosphere have been discussed by Hultqvist (1974, 1977) and evidence for such Li formation have been found through the deexcitation line Li(478keV) resulting from He-He reactions, which has been detected by Gamma-ray spectral observations of solar flares with OSO-7 (Chupp et al. 1973), SMM (Murphy et al. 1990) and Yohkoh (Yoshimori et al. 1994; Kotov et al. 1996). The recent calculation of Li production in solar flares (Livshits 1997) agree with Gamma line observations and suggest that enhancement of Li, especially in the intensity of the Li i 6708 line, should be observed in the Sun and other active stars. Evidence for a Li enhancement at one umbral position, during a solar flare is reported by Livingston et al. (1997).
In other stars (including the UV Ceti flares stars) no evidence of production of Li by nuclear reactions have been found until now. The possibility of Li production have been discussed only in terms of the energy required (Ryter et al. 1970; Karpen & Worden 1979) or as a possibility to explain the high Li abundances observed in CAB (Pallavicini et al. 1992), active stars with high flare activity (Mathioudakis et al. 1995), or the widespread presence of lithium in very cool dwarfs (Favata et al. 1996).
The Li i EW variations that we observe are clearly correlated with the temporal evolution of the flare (Fig. 2 and 4), and large changes observed in the core of the Li i, as predict the models of Li production in flares (Livshits 1997). Thus taking into account that the other possible causes of variability have been eliminated above we suggest that this Li i is produced by spallation reactions in the flare. This is the first time that such Li i enhancement associate with a stellar flare is reported, and probably the long-duration of this flare is a key factor for this detection. The observed 6Li/7Li ratio also support this hypothesis.
6Li/7Li ratio enhancement
Another signature of Li production from spallation reactions is that the 6Li/7Li isotopic ratio should increase. The predicted 6Li/7Li ratio for the lithium produced by spallation is 0.4 (Audouze 1970) or 0.5 (Walker et al. 1985) while the ratio measured in the Sun is between 0.01 and 0.04 (Traub & Roesler 1971; Müller et al. 1975), in Population I stars is 0.04 (Andersen et al. 1984; Maurice et al. 1984; Rebolo et al. 1986; Pallavicini et al. 1987), and in Population II stars is 0.05 (Smith et al. 1993; Hobbs & Thorburn 1994; 1997).
In order to estimate the 6Li/7Li in our high resolution spectra we adopt the method used by Herbig (1964) based on the shift of the center of gravity (cog) of the Li i blend toward longer wavelenths as the 6Li fraction increases. If each Li i component is weighted by its gf-value, pure 7Li would produce a cog wavelenth of 6707.8117 Å while pure 6Li would be 6707.9713 Å and, for weak lines, intermediate mixtures would yield a wavelenth, , between the two isotopes that would be weighted by the 6Li/7Li ratio,
6Li/7Li = ( - 6707.8117) / (6707.9713 - )
To determine the value of we have measured the difference between the Li i and Ca i features ( = Ca i - Li i) and adopt a wavelenth of 6717.681 Å for the Ca i line. We give this values and the corresponfing 6Li/7Li ratio obtained in Table 1. In order to test the possible errors we have also measured this diference, , for other phostospheric lines included in the same spectral order than the Li i feature. In Fig.5 we plot for the Li i lines and the other lines. The other line ’s do not show any trend during the observations and the with respect to the mean value is 0.008. The Li i line shows a tendancy to decrease toward the end of the flare, attaining a maximum difference 0.05. This significant change in and thus in the 6Li/7Li ratio is consistent with increasing 6Li during the flare. This is what is predicted for the production of Li i by spallation reactions.
References
– Andersen J., Gustafsson B., Lambert D.L., 1984, A&A 136, 65
– Audouze J., 1970, A&A 8, 436
– Barrado D., 1996, Ph. D. Universidad Complutense de Madrid
– Berdyugina S.V., Jankov S., Ilyin I., Tuominen I., Fekel F.C., 1998, A&A 334, 863
– Boesgaard A. M., 1991, In: The Formation and Evolution of Stars Clusters, ASP Conf. Series 13, 463
– Canal R. 1974, ApJ 189, 531
– Canal R., Isern J., Sanahuja B. 1975, ApJ 200, 646
– Chupp E.L., Forrest D.J., Higbie P.R., et al. 1973, Nature, 241, 333
– Engvold O., Kjeldseth Moe O., Maltby P., 1970, A&A 9, 79
– Favata F., Micela G., Sciortino S., 1996, A&A 311, 951
– Fekel F.C., 1996, In: Stellar Surface Structure, IAU Symp 176, Strassmeier K.G., Linsly J.L. (eds.), Kluweer Acad. Publ., p. 345
– Fernández M., Miranda L.F., 1998, A&A 332, 629
– Fowler W.A., Burbidge G.R., Burbidge E.M., 1955, ApJS 2, 167
– Giampapa M.S., 1984, ApJ 277, 235
– Herbig G.H., 1964, ApJ 140, 702
– Hobbs L.M., Thorburn J.A., 1994, ApJ 428, L25
– Hobbs L.M., Thorburn J.A., 1997, 491, 772
– Huenemoerder D.P., Ramsey L.W., 1987, ApJ 319, 392
– Hussain G.A.J., Unruh Y.C., Collier Cameron A, 1997, MNRAS 288, 343
– Hultqvist L., 1974, Solar Phys. 34, 25
– Hultqvist L., 1977, Solar Phys. 52, 101
– Jeffries R.D., Byrne P.B., Doyle J.G., Anders G.J., James D.J., Lanzafame A.C., 1994, MNRAS 270, 153
– Jeffries R.D., Bertram D., Spurgeon B.R., 1995, MNRAS 276, 397
– Karpen J.T. Worden S.P., 1979, A&A 71, 92
– Kotov Y.D., Bogovalov S.V., Endalova O.V., Yoshimori M., 1996, ApJ 473, 514
– Livshits M.A., 1997, Solar Phys. 173, 377
– Livingston W., Poveda A., Wang Y., 1997, Advances in the Physics of Sunspots, B. Schmieder, J.C. del Toro Iniesta, M, Vázquez (eds.), ASP Conf. Ser., 118, 86
– Mathioudakis M., et al., 1998, A&A 302, 422
– Maurice E., Spite F., Spite M., 1984, A&A 132, 278
– Montes D., Sanz-Forcada J., Fernández-Figueroa M.J., Lorente R., 1996, A&A 310, L29
– Montes D., Fernández-Figueroa M.J., De Castro E., Sanz-Forcada J., 1997, A&AS 125, 263
– Montes D., Saar S.H., Collier Cameron A., Unruh Y.C., 1998, MNRAS (in press)
– Müller E.A., Peytremann E., de la Reza T., Solar Phys. 41, 53
– Murphy R.J., Hua X. -M., Kozlovsky B., Ramaty R., 1990, ApJ 351, 299
– Neuhäuser R., Wolk S.J., Torres G., et al., 1998, A&A 334, 873
– O’Neal D., Saar S.H., Neff J.E., 1996, ApJ 463, 766
– Pallavicini R., Cerruti-Sola M., Duncan D.K., 1987, 174, 116
– Pallavicini R., Randich S., Giampapa M.S., 1992, A&A 253, 185
– Pallavicini R., Cutispoto G., Randich S., Gratton R., 1993, A&A 267, 145
– Patterer R.J., Ramsey L.W., Huenemoerder D.P., Welty A.D., 1993, AJ 105, 1519
– Rebolo R., Crivellari L., Castelli F., Foing B., Beckman J.E., 1986, A&A 166, 195
– Ritzenhoff S., Schröter e.H., Schmidt W., 1997 A&A 328, 695
– Robinson R.D., Thompson K., Innis J.L., 1986, Proc. Astron. Soc. Aust. 6, 500
– Ryter C., Reeves H., Gradsztajn E., Audouze J., 1970, A&A 8, 389
– Smith V.V., Lambert D.L., Nissen P.E., 1993, ApJ 408, 262
– Soderblom D.R., Jones B.F., Balachandran S., et al., 1993, AJ 106, 1059
– Soderblom D.R., 1996, in: Cool Stars, Stellar Systems, and the Sun, R. Pallavicini & A.K. Dupree (eds.) ASP Conf. Series 109, 315
– Stuik R., Bruls J.H.M.J., Rutten R.J., 1997, A&A 322, 911
– Walker T.P., Mathews G.J., Viola V.E., 1985, ApJ 299, 745
– Welty A.D., Ramsey L.W., 1998, AJ in press
– Yoshimori M., Suga K., Morimoto K., Hiraoka T., Sato J., Kawabata K., Ohki K. 1994, ApJ 90, 639
– Zirin H., 1988, in Astrophysics of the Sun, (Cambridge University Press)
| HJD | EW | I | Ca - Li | 6Li/7Li | |
|---|---|---|---|---|---|
| (2450000+) | Å | Å | Å | ||
| 826.8794 | 0.102 | 0.146 | 9.892 | 6707.789 | 0. |
| 827.8537 | 0.122 | 0.149 | 9.899 | 6707.782 | 0. |
| 828.8925 | 0.133 | 0.161 | 9.898 | 6707.783 | 0. |
| 829.8929 | 0.126 | 0.165 | 9.886 | 6707.795 | 0. |
| 830.9239 | 0.136 | 0.164 | 9.889 | 6707.792 | 0. |
| 831.9308 | 0.138 | 0.177 | 9.880 | 6707.801 | 0. |
| 832.9098 | 0.153 | 0.178 | 9.861 | 6707.820 | 0.06 |
| 835.8891 | 0.130 | 0.144 | 9.853 | 6707.828 | 0.11 |
| Line Id. (M) | E | EW | EWmax-min | ||
|---|---|---|---|---|---|
| (Å) | (eV) | (Å) | (Å) | ||
| Li i (1) | 6707.8 | 0.000 | 0.130 | 0.014 | 0.051 |
| Ca i (18) | 6462.566 | 2.523 | 0.344 | 0.008 | 0.024 |
| Ca i (18) | 6471.660 | 2.526 | 0.192 | 0.006 | 0.017 |
| Ca i (1) | 6572.781 | 0.000 | 0.173 | 0.007 | 0.023 |
| Ca i (32) | 6717.685 | 2.709 | 0.225 | 0.009 | 0.024 |
| Fe i (268) | 6546.245 | 2.758 | 0.174 | 0.006 | 0.021 |
| Fe i (111) | 6663.446 | 2.424 | 0.180 | 0.005 | 0.016 |
| Fe i (268) | 6703.573 | 2.758 | 0.101 | 0.005 | 0.017 |
| Fe i (34) | 6710.310 | 1.485 | 0.094 | 0.003 | 0.009 |
| Ni i (43) | 6643.641 | 1.676 | 0.172 | 0.005 | 0.019 |