2 Institut d’Astrophysique de Paris, 98bis Boulevard Arago, F–75014 Paris, France
3 D.A.E.C, Observatoire de Paris-Meudon, F–92195 Meudon Principal Cedex, France
4 European Southern Observatory, Karl-Schwarzschild Strae 2, D–85748 Garching bei München, Germany
5 418 Walnut Ave., Santa Cruz, CA 95060, USA
6 I.U.C.A.A., Post Bag 4, Ganesh Khind, Pune 411 007, India
On the kinematics of damped Lyman- systems††thanks: Partly based on observations carried out at the European Southern Observatory, La Silla, Chile.
Abstract
We report on high spectral resolution observations of five damped Lyman- absorbers: = 3.0248 toward Q 0347–383, = 2.1411 and 2.8112 toward Q 0528 –250, = 2.6184 toward Q 0913+072, and = 2.5226 toward Q 1213+093. Line velocity profiles and heavy element abundances are discussed.
Nitrogen is found to have abundances less than silicon in the systems toward Q 0347383, Q 0913+072, and Q 1213+093. The absorber toward Q 0913+072 is the most metal-deficient damped system known, with [Fe/H] 3.2. The simple kinematical structure of the metal absorptions makes this system ideal to discuss the [O/Si] and [N/O] ratios. We find [O/H] 2.7 and 2.7 [Si/H] 2.2.
By combining these data with information gathered in the literature, we study the kinematics of the low and high ionization phases in a sample of 26 damped Lyman- systems in the redshift range 1.174.38. We note a strong correlation between the velocity broadenings of the Si ii1808 and Fe ii1608 lines whatever the line optical depth, implying that the physical conditions are quite homogeneous in the sample. Statistically this shows that large variations of abundance ratios and thus large variations of depletion into dust grains are unlikely. The velocity broadening of the absorption lines, , is correlated with the asymmetry of the lines for 150 km s-1. The broader the line the more asymmetric it is, as expected in case rotation dominates the line broadening. However this correlation does not hold for larger suggesting that evidence for rotational motions is restricted to velocity broadenings 150 km s-1. The systems with 200 km s-1 are peculiar with kinematics consistent with random motions. They show sub-systems as those expected if the objects are in the process of merging.
Although the sample is not large enough to draw firm conclusions, there is a trend for the mean velocity broadening to decrease with redshift from 80 km s-1 at 2.2 to 50 km s-1 at 2.2.
The kinematics of the low and high ionization species are found to be statistically correlated, though the high-ionization phase has a much more disturbed kinematical field than the low-ionization phase. This should be taken into account in any model of high redshift damped Lyman- systems.
Key Words.:
Quasars: absorption lines – Quasars: individual: Q 0347–383, Q 0528–250, Q 0913+072, Q 1213+093 – Galaxies: halos| Object | mV | Date | Instrument | Resolution | Wavelength | S/N | |
|---|---|---|---|---|---|---|---|
| range (Å) | |||||||
| (1) | (2) | (3) | (4) | (5) | (6) | (7) | (8) |
| Q 0347–383 | 17.30 | 3.230 | 20/08/90 | CASPEC | 13000 | 4250–6100 | 12 (25) |
| 16/12/92 | EMMI–R | 33000 | 6100–9900 | 12 (19) | |||
| Q 0528–250 | 17.24 | 2.779 | 16/01/89 | CASPEC | 13000 | 3650–5100 | 10 (18) |
| 16/12/92 | EMMI–R | 33000 | 5795–9900 | 13 (25) | |||
| 26/02/95 | CASPEC | 20000 | 3650–5095 | 13 (26) | |||
| 19/11/95 | CASPEC | 35000 | 3750–4875 | 14 (20) | |||
| Q 0913+072 | 17.10 | 2.785 | 16/01/91 | CASPEC | 13000 | 4150–5600 | 15 (37) |
| 16/12/92 | EMMI–R | 33000 | 5800–9900 | 13 (23) | |||
| 26/02/95 | CASPEC | 20000 | 3900–5095 | 12 (20) | |||
| Q 1213+093 | 17.20 | 2.719 | 26/02/95 | CASPEC | 20000 | 3900–5120 | 12 (38) |
1 Introduction
Damped Lyman- (hereafter DLA) systems are characterized by a hydrogen column density (H i) 1020 cm-2. The optical depth at the Lyman limit is large enough so that hydrogen is neutral. The gas is either cold ( 1000 K) or warm ( 104 K) for the highest or lowest column densities respectively (Petitjean et al. peti92 (1992)). As a consequence of the shape of the column density distribution, d2/dd with 1.5, most of the mass is in the systems of highest column densities. The number density of the latter decreases with time presumably as a consequence of star-formation (Wolfe et al. wolf86 (1986); Lanzetta et al. lanz95 (1995)). Indeed, the cosmic density of neutral hydrogen in DLA absorbers at 3 is similar to that of stars at the present time (e.g. Wolfe et al. wolf95 (1995), Storrie-Lombardi et al. stor96 (1996); see also Turnshek turn97 (1997)).
Metallicities and dust content have been derived from zinc and chromium observations (Meyer et al. meye89 (1989); Pettini et al. pett94 (1994), 1997a ; Lu et al. 1996b ). The [Zn/Cr] ratio can be considered as an indicator of the presence of dust if it is assumed, that, as in our Galaxy, zinc traces the gaseous abundances whereas chromium is heavily depleted into dust-grains. Although these assumptions have been questioned by Lu et al. (1996b ) and Prochaska & Wolfe (1997a ), counterarguments have been given by Pettini et al. (1997b ). The typical dust-to-gas ratio determined this way is of the order of 1/30 of the Milky Way value (Pettini et al. 1997a ; see also Vladilo 1998). The corresponding amount of dust could bias the observed number density of DLA systems (Fall & Pei fall93 (1993)) and solve the G-dwarf problem (Lanzetta et al. lanz95 (1995)). Metallicities are of the order of a tenth solar with a tendency for decreasing metallicity from 2 to 3 (Pettini et al. 1997b ; see Boissé et al. bois98 (1998) for lower redshift). At any redshift however, the scatter is large and it may be hasardous to draw prematured conclusions from the small sample available.
Recently, Prochaska & Wolfe (1997b ) have used Keck spectra of 17 DLA absorbers to investigate the kinematics of the neutral gas using unsaturated low excitation transitions such as Si ii1808. They show that the absorption profiles are inconsistent with models of galactic haloes with random motions, spherically infalling gas and slowly rotating hot disks. The CDM model (Kauffmann kauf96 (1996)) is rejected as it produces disks with rotation velocities too small to account for the large observed velocity broadening of the absorption lines. Models of thick disks ( 0.3, where is the vertical scale and the radius) with large rotational velocity ( 225 km s-1) can reproduce the data (see also Prochaska & Wolfe proc98 (1998)). In a subsequent paper however, Haehnelt et al. (haeh98 (1998)) use hydrodynamic simulations in the framework of a standard CDM cosmogony to demonstrate that the absorption profiles can be reproduced by a mixture of rotational and random motions in merging protogalactic clumps. The typical virial velocity of the halos is about 100 km s-1.
The fact that damped systems originate in thick disks has been questioned previously. In particular, the metallicity distribution of DLA systems is inconsistent with that of stars in the thick disk of our Galaxy (Pettini et al. 1997b ; see however Wolfe & Prochaska wolf98 (1998)). Arguments in favor of DLA systems being associated with dwarf galaxies have also been reviewed by Vladilo (1998). However, it has been shown recently that DLA systems at intermediate redshift are associated with galaxies of very different morphologies (Le Brun et al. lebr97 (1997)). This strongly suggests that the objects associated with high-redshift DLA absorbers are progenitors of present-day galaxies of all kinds.
The discussion of whether high redshift DLA absorption systems are produced in large, fast rotating disks or in building blocks of galaxies is important since it is related to how present-day galaxies form, either through initial formation of large disks and subsequent accretion of gas or as a result of merging of pregalactic clumps. In this paper, we add observations of five DLA systems to information gathered in the literature to further address this problem. We present the observations in Sect. 2, and analyse the velocity profiles and the abundances in Sect. 3 and 4. In Section 5, we construct an homogeneous sample of 26 high-redshift DLA systems, and discuss the kinematics of the low and high ionization species. We draw our conclusions in Sect. 6.
2 Observations
The data were collected at the F/8 Cassegrain focus of the 3.6m telescope, and at the Nasmyth focus of the 3.5m NTT telescope at the La Silla observatory, ESO Chile. Blue spectra were obtained with the ESO echelle spectrograph (CASPEC). A 300 line mm-1 cross disperser was used in combination with a 31.6 line mm-1 echelle grating. For Q 0347–387 and Q 0913+072, the detector was a RCA CCD with 640x1024 pxl of 15m square and a read-out noise of 25 electrons rms. The resolution was = 13000. Additional data were obtained on Q 0528–250, Q 0913+072 and Q 1213+093 with higher spectral resolution ( = 20000; = 35000 for Q 0528–250 as well). In this case, a Tektronix CCD with 568x512 pxl of 27m square and a read-out noise of 10 electrons was used. Three spectra were obtained through the red arm of the ESO multi-mode instrument (EMMI) in the echelle spectroscopic mode. A standard grism was used as cross disperser in combination with the echelle grating # 10 and a slit width of 2 arcsec, resulting in a resolution of = 33000. The detector was a Thomson THX31156 with 1024x1024 pxl of 19m square and a read-out noise of 5 electrons rms. For each exposure on the object, flat-field images and a wavelength comparison Thorium-Argon spectrum were recorded. The accuracy in the wavelength calibration measured on the calibrated Thorium-Argon spectra is about a tenth the resolution quoted above.
The observation log is given in Table 1. The magnitudes and quasar redshifts are taken from Junkkarinen et al. (junk91 (1991)). The mean signal-to-noise ratio over the wavelength range considered has been computed from the photon statistics after subtraction of the spectral lines. It is indicated in the last column together with its maximum value (inside brackets). The data were reduced using the ECHELLE package implemented within MIDAS, the image processing system developped at ESO. The cosmic-ray events have been removed in the regions between object spectra before extraction of the object. The exposures were co-added to increase the signal-to-noise ratio. During this merging procedure, the cosmic-ray events affecting the object pixels were recognized and eliminated. The background sky spectrum was difficult to extract separately due to the small spacing between the orders in the blue. Instead, we have carefully fitted the zero level to the bottom of the numerous saturated lines in the Ly forest. The uncertainty on the determination is estimated to be 5%.
We have identified all the absorption features with equivalent widths larger than 5FWHM where is the noise rms in the adjacent continuum. Metal line profiles were fitted consistently assuming a pure turbulent broadening. Ionic column densities were derived with a least-squares technique using Voigt profiles convolved with the instrumental spread function, available in MIDAS (FITLYMAN program; Fontana & Ballester font95 (1995)). The oscillator strengths are taken from the compilation of Morton (mort91 (1991)) and the updated values of Savage & Sembach (sava96 (1996)). The column densities and the metallicities measured in the five DLA systems described in the next section are summarized in Table 2. We give the total column densities obtained by summation over all the sub-components derived from the fit. Metallicities were estimated assuming that neutral and singly ionized species were associated with the neutral phase from which the H i column density originates. Upper limits of detection are computed under the optically thin case approximation. When the lines are saturated, we indicate a lower limit obtained by assuming a mean turbulent broadening = 18 km s-1. Turbulent values are given in the text for lines suspected to lie at the low column density end of the logarithmic part of the curve of growth; otherwise stated, the line is optically thin and the resulting column density depends weakly on the Doppler parameter.
3 Comments on individual systems
3.1 Q 0347–383, = 3.0248
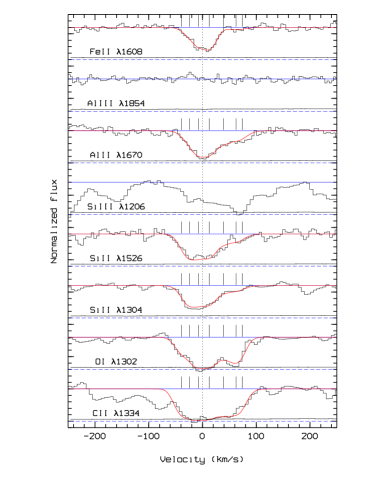
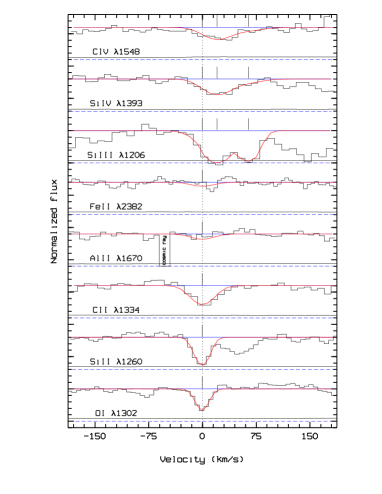
The damped nature of this Ly absorber has been first recognized by Williger et al. (will89 (1989)) with a hydrogen column density log (H i) = 20.80.1 cm-2. Pettini et al. (pett94 (1994)) give log (H i) = 20.70.1. The strongest part of the absorption produced by most of the low-ionization species is spread over less than 60 km s-1 consistently centered at = 3.02483 (see Fig. 1). As noted by Junkkarinen et al. (junk91 (1991)), the existence of a strong C iv doublet at = 2.3852 accounting for the 5241.0, 5249.7 features (Steidel stei90 (1990)) is doubtful. As shown in Fig. 1, these features can be identified with O i1302 and Si ii1304 respectively, arising from the DLA system. Moreover neither C ii1334 nor Si ii1260 lines at 2.3852 are detected down to = 0.14 Å (5). There is also no Ly associated absorption (Pierre et al. pier90 (1990); Williger et al. will89 (1989)).
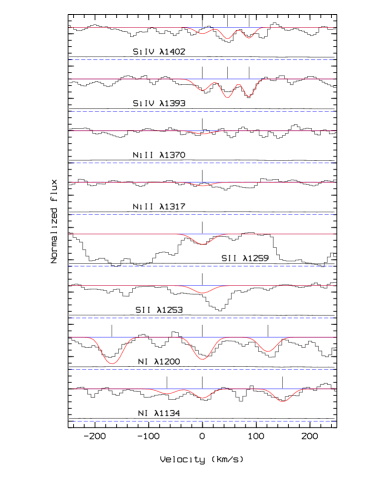
The Zn ii2026 and Cr ii2056 absorptions associated with the DLA system have equivalent widths smaller than our detection limit, 0.10 and 0.12 Å respectively at the 5 confidence level (see also Pettini et al. pett94 (1994)). We marginaly detect C iv1548 with = 0.24 Å, while the Si iv1393,1402 doublet is stronger though moderately weak. N v1242 (N v 1238 is blended) and Al iii1854 are undetected at the 5 upper limits 0.10 and 0.08 Å respectively. We do confirm the presence of N i (Fig. 2) but with a column density smaller than previously derived by Vladilo et al. (vlad97 (1997)). By fitting the two N i triplets together, we derive log (N i) = 14.160.09 cm-2 assuming a Doppler parameter = 19 km s-1.
3.2 Q 0528–250, = 2.1411
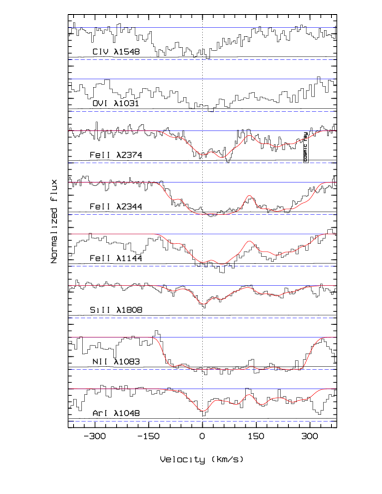
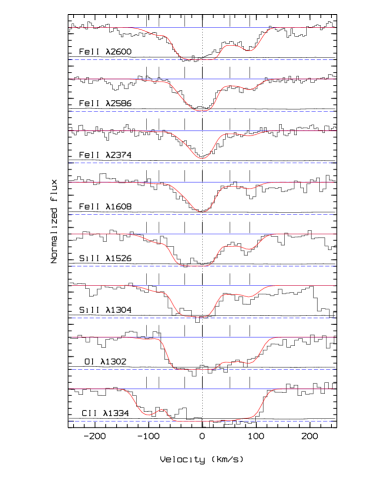
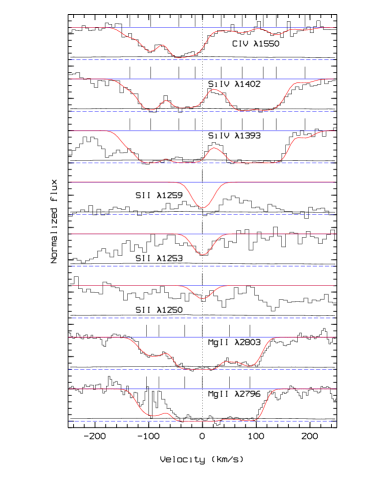
This DLA system has been previously studied by Lu et al. (1996b ). We confirm the hydrogen column density derived by Morton et al. (mort80 (1980)), log (H i) = 20.75 0.15 cm-2. The Fe ii column density is mostly constrained by the Fe ii2374 line which, together with the other iron lines available, has been adjusted with a Doppler parameter = 20 km s-1 (see Table 2). The strongest part of the Fe ii absorptions has a width of approximately 65 km s-1 (Fig. 3) whereas the O i1302 and C ii1334 lines are spread over 160 km s-1. The Fe ii absorption lie at the red end of the C iv absorption. There is a strong Si iv component centered at +100 km s-1 and spread over 105 km s-1 that is barely seen in C iv (Fig. 4). For this component only, we derive column densities in excess of 14.55 cm-2 and equal to 13.780.18 cm-2 for Si iv and C iv respectively.
3.3 Q 0528–250, = 2.8112
Most of the metal lines have been observed by Lu et al. (1996b ). Our spectrum goes further into the blue however and we show in Fig. 5 the lines not observed previously at equivalent resolution together with a few others for comparison.
This system has drawn much attention because of the high H i column density, log (H i) = 21.35 cm-2 (Møller & Warren moll93 (1993)) and the detection of H2 molecules, log (H2) = 16.8 cm-2 at = 2.8112 (Levshakov & Varshalovich levs85 (1985); Srianand & Petitjean sria98 (1998), see also Cowie & Songaila coso95 (1995)). The absorption redshift ( = 2.8112, as measured from the Ni ii lines by Meyer & York meye87 (1987) and from the H2 lines) is higher than the QSO emission redshift ( = 2.77: Morton et al. mort80 (1980)) by 3000 km s-1 which makes this system very peculiar eventhough the QSO emission redshift may have been underestimated. Three Ly emission-line objects have been detected within 21 arcsec from the quasar (or 120 kpc at this redshift and = 0.1) by Møller & Warren (moll93 (1993)) and confirmed by Warren & Møller (warr96 (1996)) to have redshifts within 200 km s-1 from the redshift of the DLA system. The width of the Ly emission lines is very large ( 600 km s-1) and continuum emission could be present (Warren & Møller warr96 (1996)). This suggests that the gas is not predominantly ionized by the quasar and that star-formation may occur inside the clouds.
The low C i/H2 ratio cannot be easily explained by simple photo-ionization models if solar metallicity ratios are assumed (Srianand & Petitjean sria98 (1998)). Indeed, the low C iv/N v ratio and low abundances ( 0.2: Srianand & Petitjean sria98 (1998)) indicate that the gas is most certainly not directly associated with the QSO (see Petitjean et al. peti94 (1994)). The fact that the three Ly objects are aligned on the same side of the QSO and have velocities +190, 120, +110 km s-1 relative to the damped absorption for projected separations 9, 66 and 115 kpc respectively, argues against the assumption that all the gas is part of a large rotating disk (Warren & Møller warr96 (1996)). The system looks like a conglomera of individual clouds. The low and high ionization absorptions are spread over 440 km s-1 and are organized in two main sub-systems centered at +40 and +220 km s-1 relative to the H2 absorption, with a velocity broadening of 220 and 140 km s-1 respectively. It is interesting to note that the high and low ionization species have similar kinematical structures with well defined sub-components. Indeed, the weak N v absorption is at the same redshift as the H2 absorption. This again argues for a group of individual clouds embedded in a somewhat isotropic ionizing field.
3.4 Q 0913+072, = 2.6184
From the Ly line, we derive log (H i) = 20.2 0.1 cm-2 consistent with the measurement by Pettini et al. (1997b ). The low-ionization metal absorptions O i and Si ii show a single and weak component. A second component could be present in the red wing of C ii1334 (see Fig. 6 in which the higher resolution data are used for O i and Si ii).
The fit of all low-ionization lines together gives a best value = 7 km s-1. This means that the lines are barely resolved. The true value of could thus be smaller and the column densities larger than those indicated in Table 2. However, the non-detection of Si ii1304 puts strong constraints on . Indeed in order for this line to be unseen in our data, the Si ii column density cannot be larger than 13.58 whatever the value is. For smaller values, the fit would be inconsistent with the stronger Si ii lines. The lower limit for the Si ii column density is 1013.1 cm-2. If it is assumed that the above value is the same for O i then the O i column density is well determined. Although the data are consistent with a single O i, Si ii component, we cannot completely rule out the possibility that the Si ii line, in reality, spans a slightly larger velocity range than O i which would imply a smaller value for O i than for Si ii.
It is important to note that the Fe ii2382 line is not detected down to 0.15 Å at the 5 confidence level.
We do not detect high ionization lines (Si iii, Si iv and C iv) at the velocities of the low ionization lines. Rather, the high ionization absorptions lie at +21 and +65 km s-1 relatively to the low ion absorptions.
3.5 Q 1213+093, = 2.5226
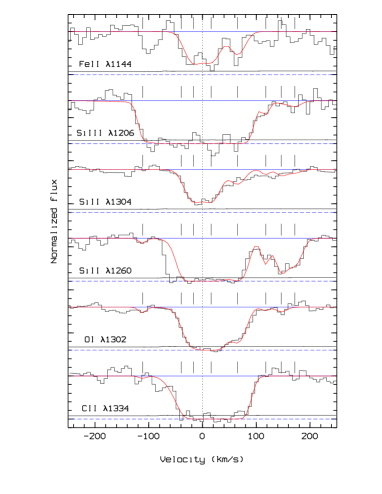
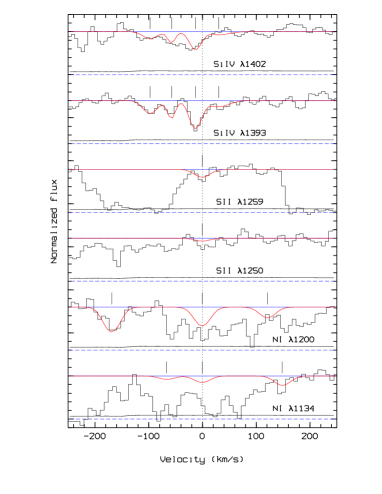
We confirm the damped nature of this system with a hydrogen column density log (H i) = 20.10.1 cm-2. The redshift derived from the Si ii1304 line is = 2.5226 (the strongest part of the absorption is spread over less than 60 km s-1, see Fig. 7). There is an additional satellite component detected by Si ii absorption at +145 km s-1. This satellite system is however barely seen in O i1302 and not seen at all in C ii1334. The nitrogen triplets are heavily blended (see Fig. 8) but the N i1199 line, which leads to a low column density, log (N i) = 13.860.06 cm-2, for = 18 km s-1. Down to = 0.12 Å (5), we do not detect the N v1242 line associated with the possible N v1238 absorption mentioned by Sargent et al. (sarg88 (1988)).
4 Metallicity
The metal and dust contents of DLA systems have been estimated in the past few years using weak lines of zinc and chromium (Meyer et al. meye89 (1989); Pettini et al. pett94 (1994)). The ratio [Cr/Zn] is assumed to be an indicator of the depletion of refractory elements into dust as zinc is not depleted in the ISM of our Galaxy whereas chromium is.
| Q 0347–383 ( = 3.02) | Q 0528–250 ( = 2.14) | Q 0528–250 ( = 2.81) | Q 0913+072 ( = 2.61) | Q 1213+093 ( = 2.52) | ||||||
|---|---|---|---|---|---|---|---|---|---|---|
| Ion | log | [Z/H]⋆ | log | [Z/H]⋆ | log | [Z/H]⋆ | log | [Z/H]⋆ | log | [Z/H]⋆ |
| (cm-2) | (cm-2) | (cm-2) | (cm-2) | (cm-2) | ||||||
| (1) | (2) | (3) | (4) | (5) | (6) | (7) | (8) | (9) | (10) | (11) |
| H i | 20.700.10a | …… | 20.750.15 | …… | 21.350.10b | …… | 20.200.10 | …… | 20.100.10 | …… |
| C ii | 14.87 | -2.38 | 15.34 | -1.96 | 15.58c | -2.32 | 14.08 | -2.67 | 15.36 | -1.29 |
| C iv | 13.150.13 | …… | 14.75† | …… | 15.00c | …… | 13.540.11 | …… | …….. | …… |
| N i | 14.160.09 | -2.51 | …….. | …… | …….. | …… | 13.28 | -2.89 | 13.860.06 | -2.21 |
| N ii | 14.73 | …… | …….. | …… | 15.60 | …… | 13.70 | …… | …….. | …… |
| N v | 13.35 | …… | …….. | …… | 13.990.04c | …… | 12.98 | …… | 13.82 | …… |
| O i | 15.16 | -2.41 | 15.62 | -2.00 | 15.94c | -2.28 | 14.280.14 | -2.79 | 15.59 | -1.38 |
| O vi | …….. | …… | …….. | …… | 15.37 | …… | …….. | …… | …….. | …… |
| Mg ii | …….. | …… | 14.61 | -1.72 | 15.88c | -1.05 | …….. | …… | …….. | …… |
| Al ii | 13.13 | -2.05 | 13.46c | -1.77 | 14.20c | -1.63 | 11.94 | -2.74 | …….. | …… |
| Al iii | 12.04 | …… | 12.770.08c | …… | 14.07c | …… | 12.27 | …… | …….. | …… |
| Si ii | 14.41 | -1.84 | 15.260.04c | -1.04 | 16.050.10 | -0.85 | 13.340.24 | -2.41 | 14.74 | -0.91 |
| Si iii | 13.58 | …… | …….. | …… | …….. | …… | 13.98 | …… | 15.88 | …… |
| Si iv | 13.450.12 | …… | 14.46† | …… | 14.52c | …… | 13.290.11 | …… | 13.500.16 | …… |
| S ii | 14.460.04 | -1.51 | 15.08 | -0.94 | 15.590.03c | -1.03 | 13.92 | -1.55 | 14.22 | -1.15 |
| Ar i | …….. | …… | …….. | …… | 14.53 | -1.24 | …….. | …… | …….. | …… |
| Cr ii | 12.86 | -1.52 | 13.100.04c | -1.33 | 13.650.12c | -1.38 | 12.53d | -1.35 | …….. | …… |
| Mn ii | …….. | …… | 12.380.10c | -1.90 | …….. | …… | 12.27 | -1.46 | …….. | …… |
| Fe ii | 14.25 | -1.96 | 14.680.07 | -1.58 | 15.450.11c | -1.41 | 12.43 | -3.28 | 14.61 | -1.00 |
| Ni ii | 12.94 | -2.01 | 13.220.06c | -1.78 | 13.890.03c | -1.71 | 13.02 | -1.43 | 13.02 | -1.33 |
| Zn ii | 12.15 | -1.20 | 12.28c | -1.12 | 13.090.07c | -0.91 | 11.90d | -0.95 | …….. | …… |
Some controversy has arisen recently about the presence of dust in DLA systems. Lu et al. (1996b ) have argued that nucleosynthesis alone can explain the element abundance ratios observed in DLA systems and that the presence of dust is thus questionable. They claim that the relative abundances are consistent with the bulk of heavy elements being produced by Type II supernovae. Pettini et al. (1997b ) have shown however that, even though the nucleosynthesis history of the gas must play a role, the depletion levels of the refractory elements indicate the presence of dust. The subsequent level of extinction (Kulkarni et al. 1997; Vladilo vlad98 (1998)) is in qualitative agreement with the direct extinction measurement by Pei et al. (pei91 (1991)). We discuss here in turn the three most interesting absorbers toward Q 0347–383, Q 0913+072 and Q 1213+093.
In the ISM of our Galaxy, sulfur is not heavily depleted into dust grains (Sembach & Savage semb96 (1996)). The gas-phase metallicity in the = 3.0248 system toward Q 0347–383 is thus of the order of 1.5. The silicon and iron abundances are of the same order of magnitude, [Si/Fe] 0 and [S/Fe] 0.5. This is consistent with solar relative abundances and little depletion into dust. Nickel seems to be slighly depleted as compared to iron. It is interesting to note however that, in our Galaxy, stars with [Fe/H] 1, have [Si/Fe] [S/Fe] 0.4 (e.g. François fran87 (1987)) and [Ni/Fe] 0 (Gratton & Sneden grat91 (1991)). This suggests that indeed the nucleosynthesis history of the damped systems may be different from that of our Galaxy and that the presence of dust at such a low level may be difficult to disentangle from nucleosynthesis effects.
The most important observation in this system comes from N i. The nitrogen to silicon abundance ratio is smaller than solar ([N/Si] 0.65). A similar abundance pattern is observed in the = 2.6184 absorber toward Q 0913+072 (see below), and in the = 2.5226 absorber toward Q 1213+093 (see Table 2). Such low values of the relative nitrogen abundance have been observed as well at = 2.2794, 2.309, 2.5379 and 2.8443 toward Q 2348–147, Q 0100+130, Q~2344+124 and Q 1946+769 respectively (Pettini et al. pett95 (1995); Molaro et al. mola98 (1998); Lipman lipm95 (1995); Lu et al. lu95 (1995), see also Lu et al. lu98 (1998)). It is important to recall that the ionization correction factor for nitrogen is always close to unity for log (H i) 20 cm-2 (Viegas vieg95 (1995)).
The system toward Q 0913+072 is characterized by low metallicities and simple kinematical structure. This implies that absorptions from usually heavily saturated lines (O i1302 and C ii1334) can be used to derive abundances. The data are consistent with [C/H] [O/H] 2.7 although the fit of the lines gives a Doppler parameter 7 km s-1, which indicates that the lines are barely resolved in our spectrum and may be slighly saturated. We have argued in Sect. 3.4 that 2.7 [Si/H] 2.2 which implies that [Si/O] might be slighly over-solar. The iron abundance is surprizingly low, [Fe/H] 3.2, which, if confirmed, would be the smallest value amongst known DLA systems. Moreover, [Fe/Si] 0.8. The abundance pattern is similar to that observed in the = 2.076 system toward Q 2206–199 (Prochaska & Wolfe 1997a ) in which [Si/H] 2.2 and [Fe/Si] = 0.4. In the framework of chemical evolution models, and assuming no depletion into dust grains, these numbers can be explained if the system is in the early phase of a burst of star-formation. In such models, however, the oxygen abundance is expected to be twice that of silicon (Matteucci et al. matt97 (1997)). It would be interesting to investigate whether such an abundance pattern is similar to that in Ly forest clouds with log (H i) 15 cm-2 (Cowie et al. cowi95 (1995)).
The [N/Si] ratio is found to be less than solar. Given the low absolute metallicity, this system should be studied in more detail to investigate the nucleosynthesis history of DLA systems in the framework presented by Lu et al. (lu98 (1998)). Indeed, although the resolution of our data is slighly too low to definitively conclude, it seems that [O/Si] may be slighly over-solar.
5 The metal line profiles of DLA systems
Recently, Prochaska & Wolfe (1997b ) have studied the velocity profiles of unsaturated low ionization metal transitions (mostly Si ii1808) of 17 DLA systems. They conclude that the observed structures are consistent with a model of rapidly rotating, thick disk and inconsistent with disk models from a CDM structure formation scenario (Kauffmann kauf96 (1996)). Haehnelt et al. (haeh98 (1998)) have shown however that the data can be reconciled with such models if a detailed treatment of the gas dynamics is included. Here we want to address the problem of the kinematics without any a priori model in mind. We emphasize that large velocity broadenings arise most often in peculiar systems and that high and low-ionization species show some correlation in their kinematics.
We have compiled a sample of 26 damped Ly systems from the literature (see Table 3 for references). For each of them we have measured the velocity broadening of the profiles for the low and high ionization species at different optical depths. is the velocity width of a low-excitation line measured as the velocity separation of the wavelengths at which the residual in the normalized spectrum is . We consider = 0.9 and 0.5. Except for a few cases, there is a redshift at which the optical depth of unsaturated low-excitation transitions (Zn ii, Fe ii) reaches a maximum. We take this redshift as the origin of velocities. ( 0) and ( 0) are the largest and smallest velocities for which the residual in the normalized spectrum is . We define an asymmetry parameter = that is close to zero for a symmetric profile and close to one for a one-sided profile. The results are presented in Table 3. We emphasize that the velocity interval considered here is larger than that of Prochaska & Wolfe (1997b ). These authors have chosen to ignore 5% of the integrated optical depth at each edge of the profiles to correct for the internal broadening of the components. For high level of asymmetry, our definition of leads consequently to slightly smaller values of this parameter. After rescaling however, the distributions of the asymmetry parameter considered in both paper are similar (see Sect. 5.2). In Column 12 of Table 3, we give the measurements of dl↔h which is the velocity difference between the maximum of the optical depth for the low and high-ionization species respectively.
| Object | log (H i) | Ref. | Transition | V | V | Transition | V | dl↔h | |||
|---|---|---|---|---|---|---|---|---|---|---|---|
| (cm-2) | (km s-1) | (km s-1) | (km s-1) | (km s-1) | |||||||
| (1) | (2) | (3) | (4) | (5) | (6) | (7) | (8) | (9) | (10) | (11) | (12) |
| Q~0450–132 | 1.17 | … | 1 | Fe ii2344 | 205 | 140 | 0.71 | … | … | … | … |
| Q~0449–134 | 1.27 | … | 1 | Fe ii2586 | 85 | 55 | 0.27 | … | … | … | … |
| Q~0935+417 | 1.37 | 20.30 | 2 | Fe ii2586 | 102 | 47 | 0.49 | … | … | … | … |
| Q~1946+769 | 1.74 | … | 1 | Fe ii2344 | 52 | 34 | 0.29 | C iv1548 | 97 | 1.10 | 25 |
| Q~0216+080 | 1.77 | 20.00 | 1 | Fe ii2586 | 95 | 40 | 0.00 | … | … | … | … |
| Q~1331+170 | 1.78 | 21.18 | 3 | Fe ii1608 | 95 | 75 | 0.60 | C iv1548 | 375 | 0.01 | 130 |
| Q~2206–199 | 1.92 | 20.65 | 4 | Fe ii1608 | 203 | 153 | 0.70 | C iv1548 | 300 | 0.50 | 32 |
| Q~0201+365 | 1.95 | 20.18 | 5 | Fe ii1608 | 245 | 205 | 0.17 | … | … | … | … |
| Q~2231–0015 | 2.07 | 20.56 | 1 | Fe ii1608 | 170 | 113 | 0.77 | … | … | … | … |
| Q~2206–199 | 2.08 | 20.43 | 4 | Fe ii1608 | 15 | … | … | C iv1548 | 62 | 0.19 | 7 |
| Q~0528–250 | 2.14 | 20.70 | 1 | Fe ii1608 | 160 | 65 | 0.38 | C iv1548 | 187 | 0.44 | 43 |
| Q~2348–147 | 2.28 | 20.57 | 6 | Si ii1304 | 40 | 30 | 0.00 | … | … | … | … |
| Q~0216+080 | 2.29 | 20.45 | 1 | Fe ii1608 | 160 | 95 | 0.58 | C iv1548 | 500 | 0.48 | 5 |
| Q~0100+130 | 2.31 | 21.40 | 7 | Fe ii1608 | 77 | 55 | 0.64 | C iv1548 | 103 | 0.26 | 50 |
| Q~0201+365 | 2.46 | 20.38 | 5 | Fe ii1608 | 235 | 215 | 0.02 | C iv1550 | 360 | 0.78 | 80 |
| Q~1213+093 | 2.52 | 20.10 | 8 | Si ii1304 | 217 | 72 | 0.03 | Si iv1393 | 172 | 0.49 | 20 |
| Q~0913+072 | 2.62 | 20.20 | 8 | Si ii1526 | 20 | … | … | Si iv1393 | 97 | 0.59 | 25 |
| Q~0528–250 | 2.81 | 21.20 | 1 | Fe ii1608 | 400 | 325 | 0.63 | C iv1550 | 445 | 0.21 | 25 |
| Q~1425+606 | 2.83 | 20.30 | 1 | Fe ii1608 | 170 | 30 | 0.00 | C iv1548 | 445 | 0.46 | 225 |
| Q~1946+769 | 2.84 | 20.27 | 1 | Fe ii1608 | 14 | … | … | C iv1548 | 205 | 0.02 | 72 |
| Q~0347–383 | 3.02 | 20.50 | 8 | Fe ii1608 | 115 | 43 | 0.16 | Si iv1393 | 125 | 0.52 | 40 |
| Q~2233+131 | 3.15 | 20.00 | 9 | Fe ii1608 | 235 | … | … | C iv1548 | 300 | 0.53 | 150 |
| Q~0000–263 | 3.39 | 21.41 | 1 | Fe ii1608 | 65 | 30 | 0.00 | C iv1548 | 280 | 0.14 | 50 |
| Q~2212–1626 | 3.66 | 20.20 | 1 | Fe ii1608 | 80 | … | … | C iv1548 | 68 | 0.32 | 17 |
| Q~2237–0608 | 4.08 | 20.48 | 1 | Fe ii1608 | 160 | … | … | C iv1548 | 202 | 0.14 | 35 |
| Q~1202–0725 | 4.38 | 20.60 | 10 | Fe ii1608 | 110 | … | … | C iv1548 | 43 | 1.09 | 25 |
5.1 The Fe ii1608,2586 and Si ii1808 profiles
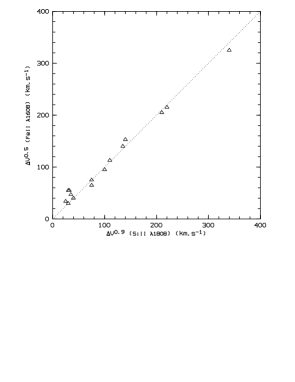
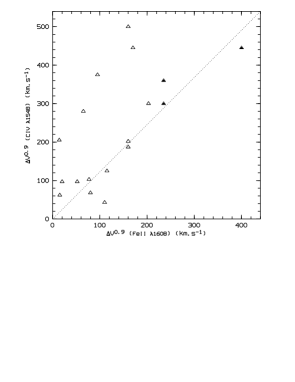
The velocity broadening of the Fe ii1608,2586 (at = 0.5 or 0.7) and Si ii1808 (at = 0.9 or 0.1) line profiles are compared in Fig. 9. It can be seen that they correlate very closely. This implies that we can use the iron velocity interval that is easier to measure because of larger optical depths. The iron lines are observed in a large number of systems and we are able to compare velocities measured with the same ion. Prochaska & Wolfe (1997b ) made used of several transitions because Si ii1808 line is not detected in all the systems.
Since the correlation is very good, it implies that the physical conditions are quite homogeneous in the sample. First we can be confident that the criteria are well choosen to probe the densest regions where iron and silicon are both predominantly singly ionized. If it were not the case we would expect large variations in the (Si ii)/(Fe ii) ratio as Si ii persists much longer than Fe ii when the H i column density decreases. Indeed the (Si ii)/(Fe ii) ratio can be larger than ten for log (H i) 18 cm-2 (see Petitjean et al. peti92 (1992)). It also suggests that large variations of abundance ratios and/or large depletion into dust grains are unlikely. These conclusions are consistent with detailed studies of DLA systems (Lu et al. 1996b , Prochaska & Wolfe proc96 (1996), Pettini et al. 1997b , Vladilo 1998). We can infer from this correlation that, statistically, the local optical depth of Fe ii1608,2586 is approximately seven times larger than the local optical depth of Si ii1808. Hence, using the oscillator strengths given by Savage & Sembach (sava96 (1996)), the Si ii column density is on average three times larger than the Fe ii column density. The solar metallicities of iron and silicon are similar which implies that in these systems and on average, [Si/Fe] 0.5 in the gas phase.
5.2 The Fe ii velocity broadening distribution
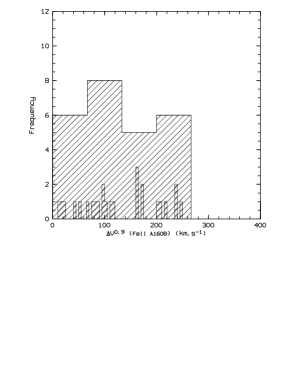
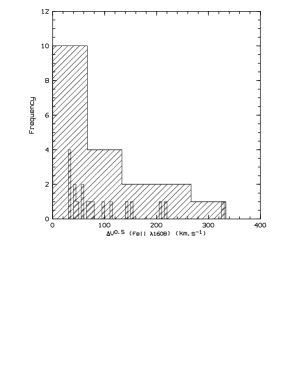
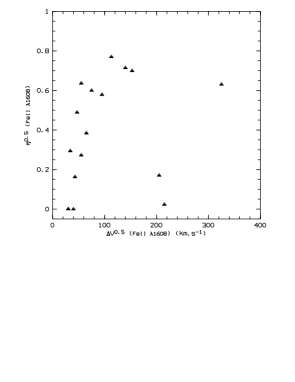

Fig. 10 (upper panels) shows the histograms of the velocity broadening measured from Fe ii at 0.1 (left panel) and 0.7 (right panel). When weak wings are considered ( 0.1), the distribution is nearly uniform from 20 to 250 km s-1. This is what is found by Prochaska & Wolfe (1997b ). However, when only the deepest part of the absorption is considered (and we have given arguments showing that this part should be associated with the neutral phase), the distribution is peaked at small velocity broadenings. Most of the profiles have 100 km s-1, while a few have 150 km s-1. It can be seen in Fig. 10 (lower left panel) that the asymmetry parameter is correlated with the velocity broadening up to 150 km s-1. For larger velocity broadenings however this correlation disappears. This approach complements the edge-leading test of Prochaska & Wolfe (1997b ; Fig. 10) as it takes into account the correlation between asymmetry and velocity broadening that is expected in fast rotating thick-disk models.
Since it is the presence of systems with large velocity
broadenings that mostly rules out the CDM model (see Fig. 10 of Prochaska &
Wolfe 1997b ), we discuss below these systems individually:
Q 0201+365 at = 2.462: If we strictly follow our
procedure and measure the velocity broadening of
Fe ii 1608 at = 0.5, we find 600 km s-1. This large velocity spread is due to a satellite of
the main system, which has a column density
log (H i) 19 cm-2 (Prochaska & Wolfe proc96 (1996)).
In this case, since the velocity separation is quite large, there is
little doubt that we should consider that this satellite
arises in a system that is not associated with the main damped component.
However this case clearly shows that
the presence of satellites (as expected in the case of merging
processes) could bias the discussion on the amount of rotation needed to
explain the profiles.
By restricting our consideration to the main system, the velocity broadening
is 225 km s-1. The system does not show the
edge-leading pattern. Actually the Ly line is fitted with 23
components (Prochaska & Wolfe proc96 (1996)), none of which has
log (H i) 20 cm-2 and four of which have
log (H i) 19 cm-2. This system is definitively atypical.
Q 0201+365 at = 1.955: The Fe ii1608
criterion gives 230 km s-1. Here again there is no
obvious edge-leading pattern. Even the Ly line is poorly fitted by a
damped component and the system resembles much more the LLS system at
= 2.325, where strong Fe ii components are spread over
200 km s-1, whereas the Ly line does not show damped wings (see
Prochaska & Wolfe proc96 (1996)).
Q 0528–250 at = 2.811: The system is at
but is certainly not associated with the quasar
(Warren & Møller warr96 (1996); Srianand & Petitjean sria98 (1998)). It
has = 325 km s-1 and the profile can be
decomposed in two main sub-systems, each with no edge-leading
structure. We follow Prochaska & Wolfe (1997b ) and do not consider
it as a typical damped system.
Q 2233+131 at = 3.151: This system is peculiar for several
reasons. Djorgovski et al. (djor96 (1996)) have detected Ly emission
from this system. The emission is redshifted from the main low-ionization
absorption by about 270 km s-1 (Lu et al. lu97 (1997)). Since the
Fe ii1608 line does not reach = 0.7 at the
resolution of the Keck data and thus
0 km s-1, we could only derive
235 km s-1. Lu et al. (lu97 (1997)) have
argued that this system is a case for which rotation is apparent in the
absorption profile. However it is clear from the O i1302 and
Si ii1526 lines that this system is composed of three well
detached sub-systems spread over 300 km s-1 and centered at 270,
190 and 80 km s-1 from the Ly emission. There is no
edge-leading pattern as those emphasized by Prochaska & Wolfe
(1997b ). Instead the two sub-systems at 270 and 190 km s-1
are equally strong and could both contribute to the H i damping wings.
It is interesting to note as well that the C iv absorption does not
correlate with the low-ionization absorptions. The maximum of the C iv
absorption occurs at 120 km s-1, exactly in the gap between the
low-ionization systems at 190 and 80 km s-1. This pattern is a
clear example of what could be expected from a disturbed object made up of
interacting sub-units. It is qualitatively not different from the pattern seen
in the = 2.8112 system toward Q 0528–250. Rotational motions
may be present in the sub-systems on velocity scales smaller than
100 km s-1.
From these comments, it seems that one has to be very careful when discussing the kinematics of systems with large velocity broadenings. They often show the sub-systems that are expected if the objects are in the process of merging. Therefore the claim that the CDM model should be rejected has to be considered with caution. Indeed using hydro-simulations, Haehnelt et al. (haeh98 (1998)) have reached the same conclusion. Even though these investigations are not yet complete, the overall picture that seems to be emerging favors the idea that DLA systems are aggregates of dense knots with complex kinematics rather than ordered disks. This does not rule out however the possibility that part of the kinematics could be due to rotation. The correlation shown in Fig. 10 (lower left panel) is suggestive of rotational motions in sub-systems on scales smaller than 150 km s-1.
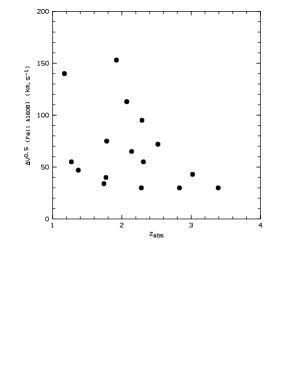
Finally, although the sample is certainly too small to draw any firm conclusion, it is interesting to note that the mean velocity broadening of Fe ii at = 0.7 tends to decrease with redshift (see Fig. 11; upper left panel) if we do not include the peculiar systems mentioned in Sect. 5.2. If we split the sample in two sub-samples containing the same number of systems, the mean velocity broadening is 80 and 50 km s-1 for 2.2 and 2.2 respectively. This behavior is expected in CDM models in which disc galaxies form as gas cools and forms stars at the centres of the dark matter haloes (e.g. Kauffmann kauf96 (1996)).
5.3 The high-ionization phase
The examples of absorption profiles simulated by Haehnelt et al. (haeh98 (1998)) suggest that the comparison of the velocity profiles of high (e.g. C iv) and low (Si ii or Fe ii) ionization species may give clues on the nature of the objects associated with DLA systems. Although Fig. 6 of Haehnelt et al. (haeh98 (1998)) is drawn for illustrative purpose, it is unclear to us whether the simulations are able or not to reproduce observed individual cases. Contrary to what happens for Fe ii at = 0.7, there is no correlation between and at = 0.1 (see Fig. 10; lower right panel). This is expected if the high-ionization phase has a much more disturbed kinematical field than the low-ionization phase (see also Turnshek et al. turn89 (1989)) and indeed, is most of the time larger than . However, there is a trend for and both measured at = 0.1 to be correlated (Fig. 11).
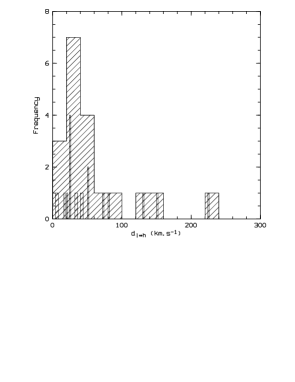
The velocity differences between the maximum of the optical depth in C iv and Fe ii is most often smaller than 60 km s-1 (Fig. 11). Close inspection of the spectra shows that the kinematics of high and low-ionization species are similar. Exceptions are the = 2.827 system toward Q 1425+606, in which the main C iv absorption corresponds to a high velocity sub-component, the = 3.151 system toward Q 2233+131, in which the strongest C iv absorption is located in a gap between two low-ionization sub-components, and the = 1.776 system toward Q 1331+170, in which the C iv profile is much more extended in velocity space than the low-ionization profiles. Such behaviors can be recognized in the simulated spectra of Haehnelt et al. (haeh98 (1998)) but should be investigated in more details.
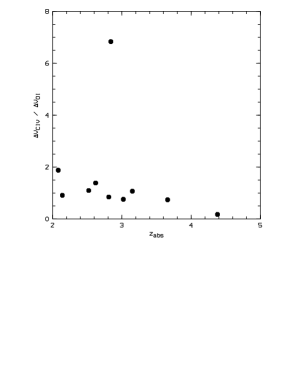
It is interesting to note that the / ratio seems to decrease with increasing redshift (see Fig. 11). A very large value for this ratio is found for the peculiar = 2.844 system toward Q 1946+769 which shows C iv absorptions symmetrically placed on both sides of the low ionization absorption. This general trend is consistent with kinematics to be more disturbed with decreasing redshift.
6 Conclusions
We have presented high resolution data for five DLA systems analyzing the velocity profiles and the column densities. The systems at = 3.0248 toward Q 0347–383 and = 2.5226 toward Q 1213+093 have similar abundance patterns. Especially the nitrogen to silicon relative abundance is smaller than the solar value (which is true also for the system at = 2.6184 toward Q 0913+072). The system at = 2.6184 toward Q 0913+072 is the most metal-deficient DLA system known by now. We find [O/H] 2.7 and [Fe/Si] 0.8. A better limit on iron is needed. Indeed it would be difficult to reconcile this pattern with standard chemical evolution models. It is interesting to note that this system has a metal content similar to that of Ly clouds with log (H i) 15 (Songaila & Cowie song96 (1996)).
From a sample of 26 DLA systems gathered from the literature, we show that the velocity widths of the Si ii 1808 and Fe ii1608 absorptions are closely correlated. This suggests that the physical conditions in the neutral phase are quite homogeneous and that large relative metallicity variations and thus large depletions into dust grains are unlikely. We discuss the systems with Fe ii velocity widths larger than 200 km s-1 and conclude that they are most of the time composed of several sub-systems. We argue, from the distribution of Fe ii velocity widths and the correlation between the asymmetry parameter and the velocity width, that rotation motions may be present in sub-systems on scales smaller than 150 km s-1. The velocity width of the strongest part of the Fe ii absorption decreases with increasing redshift. This suggests that the neutral regions get denser and exhibit faster motions with time.
Acknowledgements.
We thank Max Pettini for sharing information prior to publication and the referee, Giovanni Vladilo, for insightful comments.References
- (1) Boissé P., Le Brun V., Bergeron J., Deharveng J.M., 1998, A&A 333, 841
- (2) Cowie L.L., Songaila A., 1995, ApJ 453, 596
- (3) Cowie L.L., Songaila A., Kim T.-S., Hu E.M., 1995, AJ 109, 1522
- (4) Djorgovski S.G., Pahre M.A., Bechtold J., Elston R., 1996, Nat 382, 234
- (5) Fall S.M., Pei Y.C., 1993, ApJ 402, 479
- (6) Fontana A., Ballester P., 1995, The Messenger 80, 37
- (7) François P., 1987, A&A 176, 294
- (8) Gratton R.G., Sneden C., 1991, A&A 241, 501
- (9) Haehnelt M.G., Steinmetz M., Rauch M., 1998, ApJ 495, 647
- (10) Junkkarinen V., Hewitt A., Burbidge G., 1991, ApJS 77, 203
- (11) Kauffmann G., 1996, MNRAS 281, 475
- (12) Kulkarni V.P., Fall S.M., Truran J.W., 1997, ApJ 484, L7
- (13) Lanzetta K.M., Wolfe A.M., Turnshek D.A., 1995, ApJ 440, 435
- (14) Le Brun V., Bergeron J., Boissé P., Deharveng J.M., 1997, A&A 321, 733
- (15) Levshakov S.A., Varshalovich D.A., 1985, MNRAS 212, 517
- (16) Lipman K., 1995, PhD thesis, Cambridge University
- (17) Lu L., Savage B.D., Tripp T.M., Meyer D.M., 1995, ApJ 447, 597
- (18) Lu L., Sargent W.L.W., Womble D.S., Barlow T.A., 1996a, ApJ 457, L1
- (19) Lu L., Sargent W.L.W., Barlow T.A., Churchill C.W., Vogt S.S., 1996b, ApJS 107, 475
- (20) Lu L., Sargent W.L.W., Barlow T.A., 1997, ApJ 484, 131
- (21) Lu L., Sargent W.L.W., Barlow T.A., 1998, AJ 115, 55
- (22) Matteucci F., Molaro P., Vladilo G., 1997, A&A 321, 45
- (23) Meyer D.M., York D.G., 1987, ApJ 319, L45
- (24) Meyer D.M., Welty D.E., York D.G., 1989, ApJ 343, L37
- (25) Meyer D.M., Lanzetta K.M., Wolfe A.M., 1995, ApJ 451, L13
- (26) Molaro P., Centurion M., Vladilo G., 1998, MNRAS 293, L37
- (27) Morton D.C., 1991, ApJS 77, 119
- (28) Morton D.C., Chen J.-S., Wright A.E., Peterson B.A., Jauncey D.L., 1980, MNRAS 193, 399
- (29) Møller P., Warren S.J., 1993, A&A 270, 43
- (30) Pei Y.C., Fall S.M., Bechtold J., 1991, ApJ 378, 6
- (31) Petitjean P., Bergeron J., Puget J.L., 1992, A&A 265, 375
- (32) Petitjean P., Rauch M., Carswell R.F., 1994, A&A 291, 29
- (33) Pettini M., Smith L.J., Hunstead R.W., King D.L., 1994, ApJ 426, 79
- (34) Pettini M., Lipman K., Hunstead R.W., 1995, ApJ 451, 100
- (35) Pettini M., King D.L., Smith L.J., Hunstead R.W., 1997a, ApJ 478, 536
- (36) Pettini M., Smith L.J., King D.L., Hunstead R.W., 1997b, ApJ 486, 665
- (37) Pierre M., Shaver P.A., Robertson J.G., 1990, A&A 235, 15
- (38) Prochaska J.X., Wolfe A.M., 1996, ApJ 470, 403
- (39) Prochaska J.X., Wolfe A.M., 1997a, ApJ 474, 140
- (40) Prochaska J.X., Wolfe A.M., 1997b, ApJ 487, 73
- (41) Prochaska J.X., Wolfe A.M., 1998, astro-ph/9805293
- (42) Sargent W.L.W., Steidel C.C., Boksenberg A., 1988, ApJS 68, 539
- (43) Savage B.D., Sembach, K.R., 1996, ARA&A 34, 279
- (44) Sembach K.R., Savage B.D., 1996, ApJ 457, 211
- (45) Songaila A., Cowie L.L., 1996, AJ 112, 335
- (46) Srianand R., Petitjean P., 1998, astro-ph/9804036
- (47) Steidel C.C., 1990, ApJS 72, 1
- (48) Storrie-Lombardi L.J., McMahon R.G., Irwin M.J., 1996, MNRAS 283, L79
- (49) Turnshek D.A., Wolfe A.M., Lanzetta K.M., et al., 1989, ApJ 344, 567
- (50) Turnshek D.A., 1997, in Structure and Evolution of the Intergalactic Medium from QSO Absorption Line Systems, eds. P. Petitjean and S. Charlot (Paris: Editions Frontières), 263
- (51) Viegas S.M., 1995, MNRAS 276, 268
- (52) Vladilo G., 1998, ApJ 493, 583
- (53) Vladilo G., Molaro P., Matteucci F., Centurión M., 1997, in The Early Universe with the VLT, ed. J. Bergeron (Berlin: Springer), 430
- (54) Warren S.J., Møller P., 1996, A&A 311, 25
- (55) Williger G.M., Carswell R.F., Webb J.K., Boksenberg A., Smith M.G., 1989, MNRAS 237, 635
- (56) Wolfe A.M., 1995, in QSO Absorption Lines, ed. G. Meylan (Berlin: Springer), 13
- (57) Wolfe A.M., Prochaska J.X., 1998, ApJ 494, L15
- (58) Wolfe A.M., Turnshek D.A., Smith H.E., Cohen R.D., 1986, ApJS 61, 249
- (59) Wolfe A.M., Fan X.-M., Tytler D., et al., 1994, ApJ 435, L101
- (60) Wolfe A.M., Lanzetta K.M., Foltz C.B., Chaffee F.H., 1995, ApJ 454, 698