Does the AGN Continuum Shape Change with Luminosity?
Abstract
We test the general wisdom that AGN continua vary with larger amplitude at shorter wavelengths, through a re-analysis of historical data from the optical and UV (IUE ) monitoring campaign on the Seyfert 1 galaxy NCG 5548 by the AGN Watch Consortium. We assume that the only non-varying component of the optical continuum is the integrated light from the host galaxy, which does not affect the UV continuum. Therefore, we expect any curvature in a linear plot of the UV continuum flux versus the simultaneous optical flux to represent a true change in the spectral index ; the -intercept provides an estimate of the host galaxy contribution in the optical region. We measured the continuum fluxes at 1350 Å (rest frame) from the NEWSIPS-extracted spectra and adopted the optical continuum determinations of Wanders & Peterson (1996).
The data confirm that the curvature in the (5100) – plot is real, and that the spectral index is a function of luminosity. Hence for NGC 5548, the continuum does get harder as it gets brighter. However, the relationship between the optical and UV continuum flux is more complicated than the models we tested would indicate.
1 Introduction
Among the early findings about AGN continua was the trend for larger amplitude variations to be observed at shorter wavelengths, so that the continuum becomes harder as it becomes brighter. This has been repeatedly claimed for NGC 5548 (Wamsteker et al. (1990), Clavel et al. (1991), Peterson (1991), Korista et al. (1995)), NGC 3783 (Reichert et al. (1994)) and NGC 4151 (Crenshaw et al. (1996)). However, Fairall 9, at the high-luminosity end of the monitored sources, has been shown to have a wavelength-independent amplitude of continuum variations (Rodríguez-Pascual et al. (1997); Santos-Lleó et al. (1997)). NGC 4593 has shown the same behaviour (Santos-Lleó et al. (1995)). Hence, we decided to reconsider the issue, especially in light of the ready availability of the NEWSIPS-extracted data from IUE for a large sample of well-monitored objects (now comprising NCG 5548, NCG 3783, NCG 7469, NGC 4151, Fairall 9, 3C390.3, and Mkn 509). We will adopt as a null hypothesis that the UV/optical continuum in NGC 5548 retains its shape as the luminosity varies.
2 Data Samples and Analysis
We formed quasi-simultaneous (to within 3 days) pairs of UV/optical continuum measurements from observations made between 1988 and 1993, the first five years of the International AGN Watch (Alloin et al. (1994)) spectroscopic monitoring campaign on NGC 5548. For the UV continuum determinations we retrieved the International Ultraviolet Explorer Satellite (IUE ) short wavelength prime (SWP) camera spectra taken during the optical campaign, as processed with the new IUE Final Archive software NEWSIPS (Nichols et al. (1993)), which includes corrections for non-linearity that might have affected previous studies. The original data appeared in Clavel et al. (1991), Clavel et al. (1992), and Korista et al. (1995). We determined the flux at 1350 Å (rest frame) as the average flux over a 20 Å wide wavelength range around 1373 Å, and adopted the uncertainties of of the flux values, as suggested by the statistical considerations in Rodríguez-Pascual et al. (1997), i.e., closely spaced determinations are independent measures of the same quantity, and therefore the pixel-based uncertainties from the NEWSIPS software are overestimations.
We adopted the optical continuum determinations by Wanders & Peterson (1996), where the optical continuum is the average over a 10 Å wide wavelength range centered around 5188 Å (5100 Å in the rest frame). The advantage over the previous determinations is that these constitute a more homogeneous subset of the original data (Peterson et al. 1991, 1992; Korista et al. (1995)), re-calibrated using the automatic scaling algorithm developed by van Groningen & Wanders (1992).
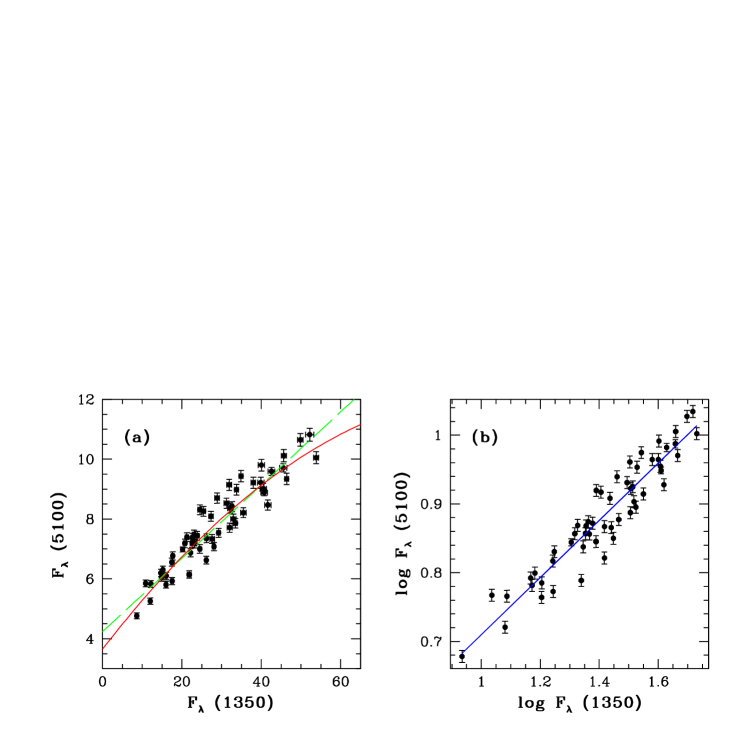
We are implicitly assuming that the only non-varying component of the optical continuum is the integrated light from the host galaxy, which does not affect the UV flux (cf Peterson (1991)). Hence, there is a simple way to test whether the continuum shape changes with luminosity. In a linear plot of the UV continuum flux versus the simultaneous optical flux, any curvature represents a true change in the spectral index , and the -intercept provides an estimate of the host galaxy contribution in the optical region. The first test we performed was for a simple functional form for the dependence of the optical flux on the UV flux, namely, polynomial and power law. Figure 1a shows the best fit, the second-order polynomial F, reduced , ; and the linear fit, , . Fluxes are in units of 10-15 erg s-1 cm-2 Å-1. The -intercept in the second-order polynomial fit is , which is consistent with the value by Romanishin et al. (1995) obtained from directing imaging of the source. However, the best fit is the power law (Figure 1b), log log , .
We then considered the possibility that had been underestimented by Romanishin et al. (1995) thus making a true linear relationship a power law: We sought for a value for the galaxy contribution to the optical that would give a value of consistent with 1. Such a value is , and in that case the fit is: log log , . The upper limit on is given by the condition that the maximum of the galaxy contribution cannot exceed the minimum observed flux, which occurred on JD 2,448,810.
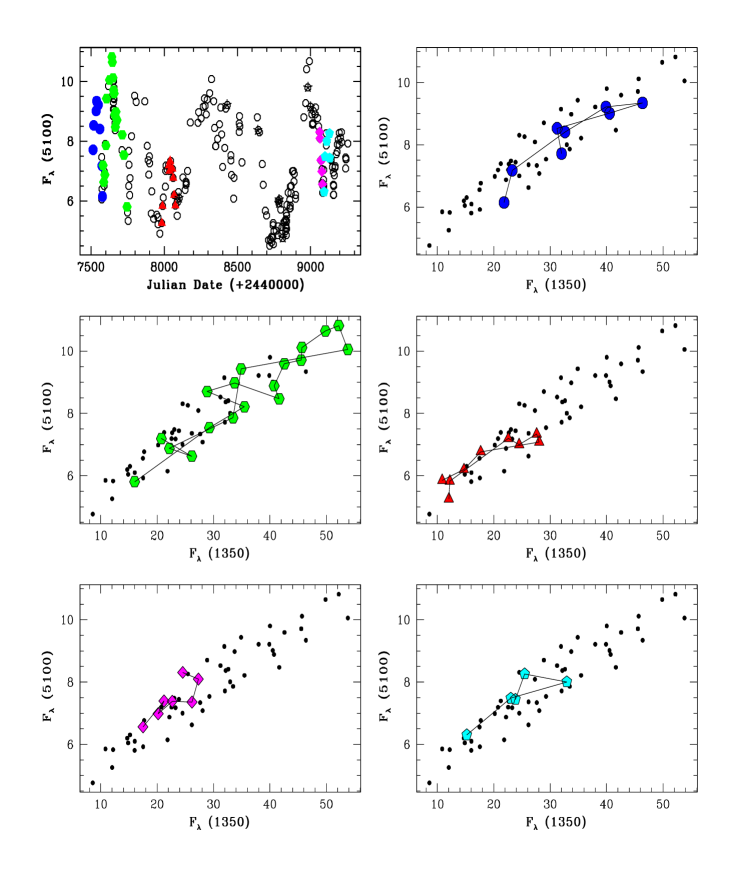
As a last test for linearity, we considered the possibility that the spread observed in the points in Figure 1a and the resulting curvature, might be due to the superposition of subsets of the whole sample, which might be otherwise fit linearly. The natural choice for these subsets is represented by activity events. In the top panel of Figure 2, the empty circles represent the UV light curve, and the filled ones have matching optical points. They have been divided into 5 subsets, according to the Julian Date, and fit individually. In none of the cases is the linear fit the best. Indeed, events 1, 3, and 5 are best fit by a second-order polynomial and events 2 and 4 by power laws.
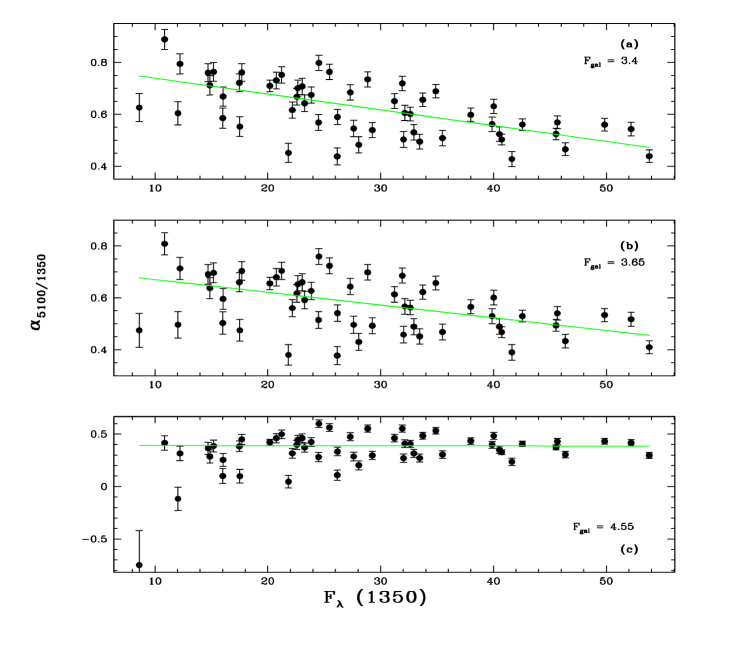
Assuming the power law shape for the continuum, we calculated the spectral index for three values of the galaxy contribution to the optical flux, namely (in units of 10-15 erg s-1 cm-2 Å-1), (a) from Romanishin et al. (1995); (b) from our second-order polynomial fit; and (c) , from the power law fit for . There is a statistically significant slope in all cases (Figure 3): (a) F; b) F; (c) ). This proves that is not constant as the flux varies, that is, is a function of luminosity, so that for NGC 5548, the continuum does get harder as it gets brighter.
3 Conclusions and Summary
We have compared contemporaneous optical and UV data from the first 5 years of the spectroscopic monitoring campaign on NGC 5548, and conclude the amplitude of variation is greater at shorter wavelength, i.e., the continuum does get harder as it gets brighter. We have shown that the curvature in the optical/UV plot is real and that the spectral index depends on luminosity. However, the high values of for each fit imply that the models tested are not adequate in describing our data. Therefore, the relationship between the optical and the UV continuum flux is probably better described by a functional form that is more complicated than either polynomial or power law. The logical next step of the work is the extension to the other well-monitored sources, NCG 3783, NCG 7469, NGC 4151, 3C390.3, Mkn 509, and Fairall 9. In particular this last object that has a wavelength-independent amplitude of continuum variations.
References
- Alloin et al. (1994) Alloin, D., et al. 1994, in Frontiers of Space and Ground-Based Astronomy, Kluwer Acad. Press, ed. W. Wamsteker, M. S. Longair & Y. Kondo, 325
- Clavel et al. (1991) Clavel, J., et al. 1991, ApJ, 366, 64
- Clavel et al. (1992) Clavel, J., et al. 1992, ApJ, 393, 113
- Crenshaw et al. (1996) Crenshaw, D. M., et al. 1996, ApJ, 470, 322
- Korista et al. (1995) Korista, K. T., et al. 1995, ApJS, 97, 285
- Nichols et al. (1993) Nichols, J. S., Garhart, M. P., De la Peña, M. D., & Levay, K. L. 1993, NEWSIPS Information Manual: Low Dispersion Data V1.0, CSC/SD-93/6062
- Peterson (1991) Peterson, B. M. 1991, in Variability of Active Galaxies, ed. W. J. Duschl, S. J. Wagner, & M. Camenzind (Berlin: Springer), 47
- Peterson et al. (1991) Peterson, B. M., et al. 1991, ApJ, 368, 119
- Peterson et al. (1992) Peterson, B. M., et al. 1992, ApJ, 392, 470,
- Reichert et al. (1994) Reichert, G. A., et al. 1994, ApJ, 425, 582
- Rodríguez-Pascual et al. (1997) Rodríguez-Pascual, P. M., et al. 1997, ApJS, 110, 9
- Romanishin et al. (1995) Romanishin, W., et al. 1995, ApJ, 455, 516
- Santos-Lleó et al. (1997) Santos-Lleó, M., et al. 1997, ApJS, 112, 271
- Santos-Lleó et al. (1995) Santos-Lleó, M., et al. 1995, MNRAS, 274, 1
- Wamsteker et al. (1990) Wamsteker, W., et al. 1990, ApJ, 354, 446
- Wanders & Peterson (1996) Wanders, I., & Peterson, B. M. 1996, ApJ, 466, 174
- van Groningen & Wanders (1992) van Groningen, E., & Wanders, I. 1992, PASP, 104, 700