Abstract
Properties of CFRS field galaxies up to z=1 are discussed. Estimations of
the cosmic star formation rate (SFR) lead to serious
problems if they not account for AGN emissions and for light reemitted at
IR wavelengths. Deep ISOCAM and VLA photometries on one CFRS field
have been performed. Multi-wavelength analyses from UV to Mid-IR and hence
to radio allow us to classify sources from their spectral
energy distributions. This provides an estimation of the FIR luminosity
density related to star formation. The deduced SFR density is free
of extinction effects and not contaminated by AGN emissions. About 5520%
of the star formation at z1 is related to FIR emission. If a non
truncated Salpeter IMF is adopted, the derived
stellar mass formed from z=0 to z=1 seems too high when compared to
the present day stellar mass.
An important fraction (30%) of the star formation at z=0.5-1 seems to be
related to the rapidly evolving population of compact/Irr galaxies. Larger
systems found at z=1, show a slower evolution of their star
formation properties.
CFRS follow up with ISO, VLA and HST: the cosmic star formation rate as derived from the FIR luminosity density
1 DAEC, Observatoire de Paris Meudon, 92195 Meudon, France
1 Introduction
The Canada France Redshift Survey (CFRS) has gathered a complete
sample of
600 field galaxies with 22.5 with spectroscopic redshifts. This
sample has been widely used to study galaxies at lookback times up to 10 Gyr.
Evolution of galaxies has been evidenced: at z=0.85 the comoving densities of
2800Å and [OII]3727 were respectively 4.51 and 84 times
larger than today (Lilly et al, 1996; Hammer et al, 1997).
It is beyond doubt that galaxy evolution is mainly associated to a
decrease of the star formation in field galaxies, since epochs of
10 Gyr ago. There were larger amounts of blue galaxies in the past
(Lilly et al, 1995) and the fraction of galaxies showing significant emission
lines ( 15Å ) increases from 13% locally to more than 50% at z0.5 (Hammer et al, 1997).
It has been investigated if AGN can substantially contribute to the
reported evolution.
The fraction of AGN (Seyfert2) is found to be 7.53.5% at z 0.5,
higher than what is found today ( 2%, see Huchra and Burg, 1992).
But it is found nearly constant with the redshift, when calculated relatively
to the population of emission line
galaxies, and so AGNs cannot
be seen as major contributors to the reported luminosity evolution.
40% of the field galaxy spectra show evidences for a significant
population of A stars. This has been
derived from continuum indices which are well correlated with .
It implies that star formation is primarily taking place over long periods
of time (typically 1 Gyr), rather than in short duration, high amplitude
bursts (Hammer et al, 1997).
Having those facts in mind, there are important pending questions:
-
•
how fair is the estimation of the SFR derived from UV ( 2800Å or [OII]3727) luminosities?
-
•
can the extinction affect our view of the galaxy evolution ?
-
•
are z 1 galaxies showing the same Hubble type distribution than those today ?
-
•
does evolution affect all galaxy morphological types in the same way ?
In this paper we summarize recent developments made beyond the bulk of the CFRS study. Recall that the CFRS includes 5 fields of 10’X10’ which probe a surface almost 100 times larger than the HDF, and so it is much more suited for galaxy studies limited in volume to z=1. The CFRS sample is limited by 22.5, which is exactly coincident to the rest-frame -20.5 at z=0.93. It implies that the CFRS is basically a (z1) volume limited sample for -20.5 galaxies. The paper is organised as follows:
-
•
Section 2: calibration of the SFR based on UV luminosities and its deficiencies.
-
•
Section 3: mid-IR and radio luminosities from deep ISOCAM and VLA observations, derivation of FIR luminosities by interpolations and a first estimation of the star formation history which is not affected by the extinction.
-
•
Section 4: morphologies from a deep HST follow up, and the major contributors to the star formation evolution.
2 SFR calibration to z=1 and beyond
Calibration of star formation rate in the optical is limited to z=0.5 when
based on the line. Other SFR indicators are the 2800Å
the [OII]3727 luminosities which could be used up to z=2 and to z=1.5,
respectively. They are more dependent on the metallicity
and on the extinction than the emission.
ISMs in distant field galaxies present different properties than that
of local ones (Hammer et al, 1997). Emission-line ratio of HII regions
in z0.5 galaxies showed
higher ionization parameters than those of local HII galaxies. About
30% of the z0.7 galaxies show clues for
abundances significantly lower than solar values.
The [OII]3727/ luminosity ratio is different on average in CFRS galaxies than in Kennicutt local ones. Indeed, when applied to distant
galaxies, the Kennicutt (1992) calibration of the
SFR from the [OII] luminosity leads to uncomfortably high values of
stellar mass.
More recently
we have got spectra up to 1m for a sub-sample of z0.5 CFRS galaxies.
Figure 1 presents relationships between the different SFR indicators:
while [OII]3727 and 2800Å luminosities correlate fairly well, these SFR
indicators present large dispersions when correlated to luminosities.
This suggests that extinction affects considerably UV luminosities, and
hence the determination of the SFR.

3 FIR luminosity from multiwavelength analysis and SFR density from z=0 to z=1
This section summarizes two papers by Flores et al (1998a and b).
One CFRS field (1415+52) has been deeply imaged with the Infrared
Space Observatory (ISO) using ISOCAM at 6.75m and 15m, with integration times from 1100 to 1200 sec .
Careful data analysis and comparison to deep optical (B, V and I),
near-IR (K) and radio (1.4 and 5 GHz) data have allowed us to generate
a catalog of 78 15m sources with identifications. 22 redshifts of
galaxies with 22.5 are
available in the CFRS database. They have higher
median redshift (Figure 2) and are redder than other field galaxies. Almost all
the star forming galaxies present evidences for an A star population.

Source densities are comparable at 6.75m (1944 S150Jy sources
per square degree, Flores et al, 1998a), 15m (2808 S250Jy
sources per square degree, Flores et al, 1998b) and 5 GHz (1440
S16Jy sources per square degree,
Fomalont et al, 1991). Star-forming objects contribute respectively,
50%, 73% and 26% of the extragalactic counts at 6.75m,
15m and 5 GHz. This suggests that the 60m luminosity
density is strongly dominated by emissions related to star formation.
The fraction of z 1 objects is
found to be 32%, 43% and 40% of the extragalactic counts
at 6.75m, 15m and 5 GHz, respectively.
Using deep photometry in rest-frame UV, visible, near-IR, mid-IR and radio,
we have derived spectral energy distributions (SEDs) which samples
the wavelength range in which most of the energy of field galaxies is
emitted (Figure 3). These have been compared to well-known local galaxy
templates (from Schmitt et al, 1998). All the CFRS 1415+52 have been
spectrally classified using this technics, and their FIR luminosities
derived by interpolation. Our classification
allow us to estimate the AGN contribution, and then to remove it
when deriving the SFR density.

We find that the SFR density derived by FIR fluxes is 2.3 higher
than that
previously estimated from UV fluxes (Figure 4). No apparent changes
with the redshift have been found within the range 0z1. The
corresponding global
extinction is , very similar to the Gallagher et al (1989)
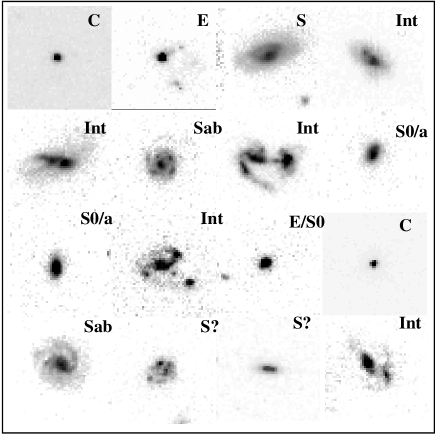
average value for local irregulars. A subsample of sixteen 15m galaxies observed by the HST indicates
that about a third of the star formation hidden by dust is associated with
interacting galaxies (Figure 5). One percent of
the CFRS galaxies are strong and heavily reddened starbursts (Figure 3) with
their SFR ranging from 120 to 330 and they contribute
to 25% of the SFR density up to z=1.

These results provide SFR density values by 3.5 lower than those of
Rowan Robinson (1997) from the small HDF area. On the other hand they are
consistent with the Richards et al (1998) analysis who found only one strong starburst in the HDF. Nevertheless, our derived SFR density seems
too high, because the derived stellar mass formed since z=1 until
now is comparable or higher than the present day stellar mass. An
alternative would be that the most powerful starburst were preferentially
forming high mass stars, i.e. their IMFs are truncated at the low mass end.
Another
possibility would be an underestimate of the local stellar mass density.
Further results for an other CFRS field and spectroscopic follow
up would provide a larger sample in order to test if extinction
properties show redshift evolution as well as to extend the predictions
until z=1.5 near the possible peak of the SFR density. Deep SCUBA
observations of some portions of these fields will be soonly available
(Eales et al and Lilly et al, 1998, in preparation).
4 Morphologies from the HST
4.1 Observations and classifications
During the last three years the CFRS team has merged their efforts with those
of the LDSS team, in order to reach significant amounts of observing time
at the HST. About 250 of the 600 CFRS galaxies have been observed with
the WFPC2/F814W filter with integration times ranging from 4400 to 7400s.
Each galaxy has been analysed through two independent technics, including
systematic fits of the luminosity profile by combination of bulge
( law) and disk (exponential law) models, and a visual inspection
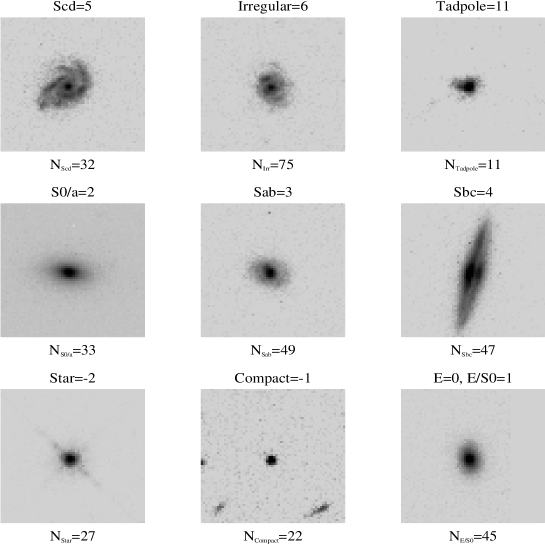
of images by three independent team members (see Schade et al, 1995 and Brinchman et al, 1998). A morphological type has been given to each galaxy following a scheme similar to the Hubble classification (see Figure 6).
Morphological studies should account for the
shift in the rest-frame wavelength of the observation (for example the
F814W filter samples the B band at z=1). This redshift dependent bias can
be very important since galaxies appear much less structured in the UV
than at redder wavelengths, and this can mimic an apparent evolution. By
redshifting the Frei et al (1996) local galaxies it has been estimated
that 24%11% of the true spirals
would have been classified as peculiars at z=0.9 (Brinchman et al, 1998).
All the numbers derived in the following have been computed after
allowing for these biases.
Based on our classification, several subsamples of morphologically selected objects can be drawn. These include disk galaxies (those with bulge/total energy ratio smaller than B/T= 0.5), elliptical galaxies (B/T=1) and compact galaxies. Determination of the scale length (for example the exponential scale length of disks, ) is limited by the pixel size of the HST, and is secure only for disks with kpc. The CFRS sample is well adapted for studying large systems (i.e. large disks and bulges) because it includes all galaxies from z=0.1 to z=1 with -20.5.
4.2 Large systems
Large disks: kpc and B/T0.5
Lilly et al (1998) gathered a subsample of 42 such galaxies from z=0.1 to z=1. Their number densities show no apparent change from z=0 to z=0.75, and are consistent with a small decrease by 30% beyond z=0.75. Based on UV and [OII]3727 fluxes, their star formation rates at z0.85 were 2.5-3 times higher on average than that at z=0. So the large reported evolution is not mainly associated with large disks. An interesting result shown by Lilly et al (1998) is that disk selected galaxies had later type at higher redshift (median type is Sab at z=0.375 compared to Scd at z=0.85).
Large ellipticals: luminosity profile and kpc
30 such galaxies have been identified in the sample by Schade et al (1998, in preparation) from z=0.2 to z=1. Despite of the small number, there are no obvious changes in their number density from the low to the high redshift bins. This result apparently contradicts the Kauffman et al (1996) analysis of the CFRS sample, who found a decrease in the space density of galaxies redder than a rest-frame elliptical template. This contradiction is simply due to the different definitions of ellipticals by the two groups: a significant fraction of the spectrophotometric ellipticals of Kauffman et al (1996) are indeed disk dominated galaxies (50% of them have B/T0.5).
4.3 Irregular galaxies
After allowing for redshift biases, Brinchman et al (1998) found a large redshift increase of the fraction of irregular galaxies (from 9% at z=0.375 to 32% at z=0.85). This results is consistent with the migration of disk galaxies towards late type at higher redshift. At z1, galaxies were less regular than at present day.
4.4 Compact galaxies
It has been claimed that a considerable fraction of the star formation activity seen at high redshift occurs in compact galaxies (Guzman et al, 1997). Compact galaxies in the HDF have been selected as having small half light radius ( 0.5 arcsec). Half light radii have been also computed for the CFRS galaxies, and Lilly et al (1998) found that large changes in the galaxies population are due to systems with kpc (this corresponds to a disk scale kpc). We have also computed a compactness parameter which is based on the ratio of luminosities calculated within two different apertures (5 and 15kpc, respectively), and has been corrected for possible disk inclination (axis ratio b/a):
| (1) |
This parameter correlates very well with the half radius and Figure 7 shows that beyond z=0.5 (and especially beyond z=0.75), a significant number of blue compact galaxies have very large UV luminosities.

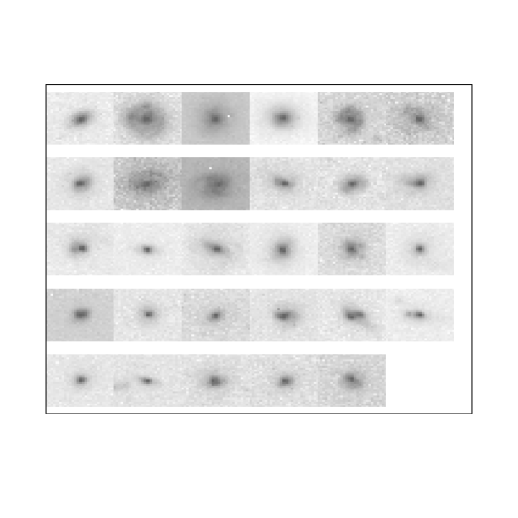
Figure 8 presents the HST/WFPC2/F814W images of the 29 blue compact galaxies. These galaxies are the most rapidly evolving population in the CFRS sample: at z=0.85, their UV luminosity density was 15 times larger than at z=0, and they contribute to as high as 30% of the global UV luminosity density. Of course these results could be modified if extinction is accounted for. This is however a good confirmation of the Guzman et al (1995) result. On the other hand, the CFRS is sampling much brighter galaxies (-20.5) than those selected by Guzman et al in the HDF. This implies that the CFRS compact galaxies at high redshift have sizes comparable to present-day dwarves (i.e. disk scale smaller than 3kpc) while their blue luminosities are 10 to 100 times larger. Converted into star formation rates, these galaxies formed from 2 to 10 , a much higher rate than in present day dwarves. In the highest redshift bin (z0.85), they span the whole range of morphological types.
5 Conclusion
The CFRS probes 10 Gyr lookback times, and the corresponding fields are
the best suited for follow up at other wavelengths. The
calibration of the SFR from UV luminosities is truly uncertain for
individual objects, because of uncontrolled extinction effects. The calculation
of the SFR density is also affected by the AGN contribution to the UV
luminosity density ( 30%). A multiwavelength analysis of
field galaxies from UV to mid IR and hence to radio wavelength allow us to
derive FIR luminosities by interpolation. It provides an estimate of the SFR
which does not sensitively depend on the extinction. The global
correction related to extinction is not as strong as previously reported
by Rowan-Robinson et al (1997),
and reaches factor of 2.3 until z=1. One percent of the CFRS galaxies are
strong and heavily reddened starbursts with SFRs from 120 to 330
and they contribute to 25% of the SFR density. A third of the star formation detected at FIR is related to interacting systems. In
most of the galaxies spanning the whole range of SFRs there are evidences for
an important A star population and hence for star formation occuring during
long periods of time ( 1 Gyr).
The rapidly evolving population of compact/Irr galaxies contributed to 30% of the SFR density at z 0.85. An important problem is the ”devenir” of these systems which produce substantial amount of stars in small volumes (SFR of 2-10 within a radius 3kpc). One would like to know if large disks, still observed at z 1, are stable or formed and then destroyed, knowing that the interaction rate is rapidly increasing with the redshift. Studies of the dynamical formation of galaxies require at an 8m telescope a 2D-spectrograph with high spectral resolutions, i.e. R 10000 to resolve dynamical elements separated by 10.
References
- [1] Brinchman, J., Abraham, R., Schade, D., Tresse, L. et al, 1998, Astrophys. J. 499, 112
- [2] Connolly, A.J., Szalay, A.S., Dickinson, M. et al, 1997, Astrophys. J. 486, L11
- [3] Flores, H., Hammer, F., Desert, F.X., Cesarsky, C., et al.,1998, Astr. Astrophys. submitted,
- [4] Flores, H., Hammer, F. Thuan, T.X., Cesarsky, C. et al.,1998, Astrophys. J. submitted,
- [5] Fomalont, E., Windhorst, R., Kristian, J., Kellerman, K., 1991, Astron. J. 102, 1258
- [6] Franceschini A. , Mazzei P., Zotti G. and Danesse L., 1994, Astrophys. J. 427, 140
- [7] Frei, Z., Guhathakurta, P., Gunn, J.E., 1996, Astron. J. 111, 174
- [8] Gallego, J., Zamorano, J., Aragon-Salamanca, A., Rego, 1995, Astrophys. J. 455, L1
- [9] Guzman, R., Gallego, J., Koo, D.C., Phillips, A.C. et al, 1997, Astrophys. J. 489, 559
- [10] Hammer F., Flores H., Lilly S., Crampton D. et al, 1997, Astrophys. J. 480, 59.
- [11] Gallagher J., Bushouse, H., Hunter, 1989, Astron. J. 97, 700
- [12] Kennicutt, R. 1992, Astrophys. J. 388, 310
- [13] Lilly S., Tresse, L., Hammer, F. et al, 1995, Astrophys. J. 455, 108
- [14] Lilly S., Le Fèvre O., Hammer F., Crampton, D., 1996 , Astrophys. J. 460, L1
- [15] Lilly, S.J., Schade, D., Ellis, R.S. et al, 1998, Astrophys. J. 500, 75
- [16] Madau P., Pozzetti L. and Dickinson M., 1998, Astrophys. J. 498, 106
- [17] Richards, R.I., Kellermann, K.J., Fomalont, E.B., et al, 1998 astro-ph/9803343
- [18] Rowan-Robinson, M., Mann, R., Oliver, S., et al., 1997, MNRAS 289, 490
- [19] Schade, D., Lilly, S.J., Crampton, D., Hammer, F. et al., 1995, Astrophys. J. 451, L1
- [20] Schmitt H., Kinney A., Calzetti D. and Storchi-Bergmann T., 1997, Astron. J. 114, 592