Redshifted 21cm Line Absorption by Intervening Galaxies
Abstract
The present generation of radio telescopes, combined with powerful new spectrometers, is opening a new age of redshifted radio absorption-line studies. Outfitting of arrays of antennas, such as the European VLBI Network and the upgraded VLA, with flexibly tuned receivers, will measure sizes and kinematics of intervening galaxies as a function of cosmic time.
Kapteyn Astronomical Institute, P.O. Box 800, 9700 AV Groningen, The Netherlands
1. The Past
Shortly after the discovery that quasars were highly luminous objects located at cosmological distances, Wagoner (1967), Bahcall & Spitzer (1969), and Gunn & Peterson (1965) recognized the importance of absorption arising in intervening galaxies, extended halos and intergalactic matter, along with use of the 21cm line as a probe of neutral gas (Bahcall and Ekers 1969). Quasar absorption lines have subsequently proven to be a gold mine of information on the evolution of the gaseous content of the Universe. The following subsection is a reminder that the 21cm line techniques can address the epoch during which mass is being most vigorously redistributed and galaxies are being assembled.
1.1. The Distant Past: Comoving Density of Neutral Gas
A detectable 21cm line optical depth, , requires a high column density of neutral gas,
For the ranges of spin temperatures and velocity widths that are typical of quasar absorption line systems (see Lane these proceedings), are of order cm-2 or more. Gas clouds of such high column density seen in absorption against quasars are drawn from the extreme high end of the column density distribution (cf Petitjean et al 1993) identified through absorption in the ultraviolet Lyman- line. The high column densities of cm-2, which are typical of lines of sight through the cool disks of nearby late-type galaxies, are named damped Lyman- systems (DLa’s) after their distinctive absorption profile; these systems form the dominant repositories of neutral gas detected by the absorption-line method (Wolfe et al 1995, Lanzetta et al 1995). The exact nature of these absorption systems remains to be determined, but it is clear that, by tracing the confining gravitational potentials that are necessary keep hydrogen neutral in the face of ionizing background radiation, they can sense the evolution of galaxies as a function of redshift.
Optical spectroscopy has been the most efficient method for identifying the DLa’s, which make interesting targets for 21cm absorption against background radio quasars. This will soon change with the advent of new broadband radio receiving systems and spectrometers. The optical spectroscopy is most efficient for redshifts above for which Lyman- is shifted to wavelengths that can be observed from the ground. This excludes the most recent of the age of the universe from study, except through space based telescopes. The DLa studies must also concentrate on bright optical quasars, which complicate the identification of the intervening absorber and study of its environment, since the bright quasar continuum can overwhelm the intervenor. In the near future, identification of 21cm absorbers in radio spectral surveys will find systems against high redshift radio galaxies with weak optical continua, thus facilitating the optical follow up, as well as providing a greater likelihood that the background radio structures will be extended and allow mapping of the intervenor in absorption using radio interferometers.
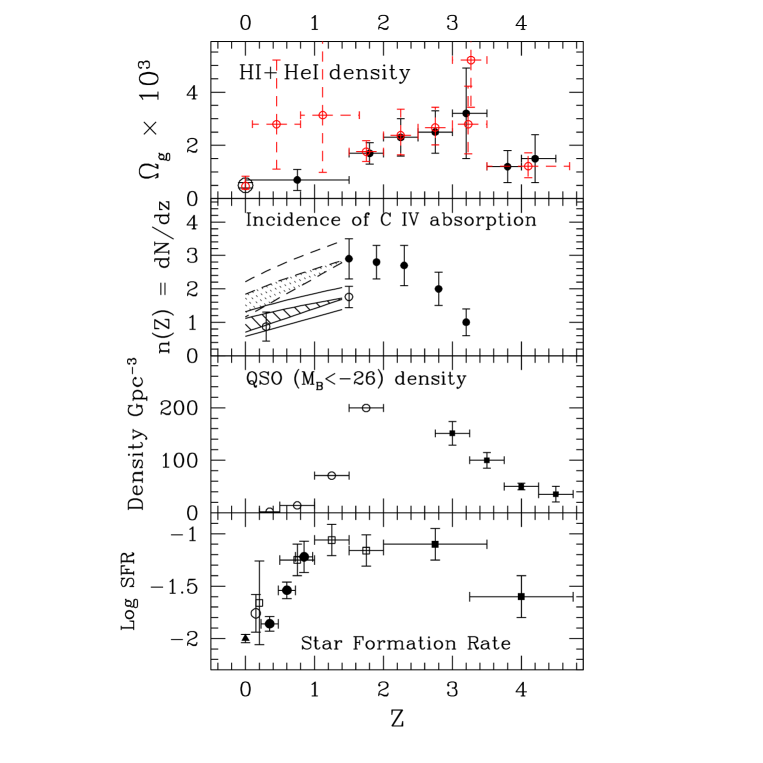
The optical surveys for DLa systems have provided convincing evidence that there was a substantially higher cosmological density of neutral gas, , at redshifts 2.5 to 3.5 than there is at the present. The evidence compiled by Wolfe et al (1995), Lanzetta et al (1995), Storrie-Lombardi et al (1996), and Rao and Turnshek (1998) is presented in Fig. 1, where it can be seen that is poorly constrained for . The radio wavelength instrumentation currently under construction will be especially effective at defining the neutral gas evolution in this intermediate redshift regime (see §3).
A variety of evidence establishes that galaxies undergo substantial evolution during the epoch to 5 that is sensed through quasar absorption lines. Fig. 1 shows that (1) is not only the peak in but also marks the onset of CIV absorption-lines, which are thought to arise in extended, metal-rich, ionized halos around galaxies, (2) redshifts around 2.5 mark the peak in the comoving number density of the most luminous quasars, and (3) the star formation rate in distant galaxies rose from 5 to 1 but has since declined by about a factor of 10 to its current rate. The decline in star formation rate is expected correlate with the decline in neutral gas density, as the reservoir of material available for forming stars is consumed (cf Lanzetta et al 1995, Fall et al 1996). Together, these indicators say that to is a period of vigorous redistribution of mass, as gravitational potentials form and confine hydrogen to drive star formation, metal-rich halos are polluted with the remains of evolved stars, and active nuclei are fueled with maximum effectiveness. 21cm line observations of this epoch will sense kinematics in evolving galactic potentials during times when neutral gas masses exceed the luminous stellar mass.

An interesting comparison can be made between the sizes of the high- star forming galaxies (Giavalisco et al 1996a) and the interception cross-sections for uv absorption by different ions (cf. Steidel 1993). The Lyman-break color-selection technique for identifying the star forming galaxies produces candidates with a density on the sky of arcmin-2 for objects with redshifts predominantly in the range (Steidel et al 1998). The comoving density of galaxy “sites,” computed for this redshift range, amounts to arcmin-2 (for a cosmological model with ). Fig. 2 shows the cross section for absorption lines that every galaxy site would necessarily present, if ordinary galaxies are to explain the observed incidence of absorption lines. Thus, absorption line statistics indicate 3 times the absorption cross sections shown in Fig. 2 for every Lyman-break galaxy. In fact, a few nearby galaxies observed in 21cm emission at present comparable cross sections. The area for NGC628 with column densities above 1020cm-2 shown in the figure are comparable to the DLa cross section, while the more extended emission at levels above compare with the required cross section for the MgII and Lyman-limit selected systems. Tests with the UV image of NGC628 (Chen et al 1992), after simulation of redshifting and and cosmological dimming (Giavalisco et al 1996b), lead to the conclusion that even such a luminous galaxy would not be detected in HST images beyond . The implications for high- is that there is substantial gaseous content, possibly accompanied by stellar emission, that can well go unnoticed in deep optical images. The nature of these invisible absorbers remains a puzzle. Are the statistical cross sections built of small clouds that coalesce steadily since to form the large galaxies at (Khersonsky & Turnshek 1996), or are there already large bound structures, comparable to the cross sections of Fig. 2 at high redshift?
1.2. The Past: Redshifted 21cm Lines
The pioneering observations for redshifted 21cm absorption-lines were done at Green Bank. These studies included “blind” spectral surveys, where relatively narrow spectrometer bands were stepped through frequency to eventually cover large spectral ranges and leading to the discovery of the first line, in 3C286, by Brown & Roberts (1973) and the line in 3C196 (Brown & Mitchell 1983). Selection on metal-line redshifts, such as MgII/MgI absorption, also led to success here in Green Bank (Roberts et al 1976; Brown & Spencer 1979). The success rate of 21cm line detection at MgII selected redshifts led to a statistical argument about the nature of the 21cm lines at , namely, that at a success rate of about one in ten, the 21cm line cross section is roughly consistent with the area presented by the cool disks of spiral galaxies. In this picture, the MgII cross section is inflated by the inclusion of lower column density (but still predominantly neutral) gas in an extended halo. It can be seen in Fig. 2, that the “approximately one in ten” statistic also holds for the DLa to MgII ratio.
A more reliable predictor of the detectability of the 21cm line is the presence of strong DLa lines, since the necessary high column density of HI is then clearly present (Wolfe and Davis 1979, Wolfe, Briggs & Jauncey 1981, Wolfe et al 1985, de Bruyn, O’Dea, & Baum 1996), although it also has become clear that high mean spin temperatures probably play a role in lowering the observed 21cm optical depths (Taramopoulos et al 1995, Carilli et al 1996, Taramopoulos et al 1996, Briggs, Brinks & Wolfe 1997, Kanekar & Chengalur 1997) relative to the values measured for narrow lines on lines of sight through the Milky Way and LMC (Dickey et al 1994).
New selection techniques have been successful, by, for example, observing redshifts of known intervening gravitational lensing galaxies (Carilli, Rupen, & Yanny 1993) and more recently by identifying highly reddened objects with possible or likely gravitational lenses (Carilli et al 1998). For the highly reddened objects, it is not entirely clear in all cases whether the reddening occurs in an intervening object or in the background quasar host itself. In general, the full identification of complete samples of radio sources argues against intervening extinction causing us to be missing vast populations of background quasars (Shaver et al 1996).
At low redshifts, several 21cm absorption systems have been detected in the outskirts of nearby galaxies, sometimes selected by “proximity” of the galaxy and quasar in the sky and sometimes through the presence of metal line absorption, such as Ca H,K, against the quasar (Haschick & Burke 1975, Carilli & van Gorkom 1992). This work is complemented by strenuous observational programs at optical and uv wavelengths to measure absorption in extended disks, ionized halos, and LSB dwarf companions of nearby galaxies against background objects (Womble 1993, Bowen et al 1995).
Although the 21cm absorption line systems have been relatively few in number in comparison to the number of optical and uv lines, they have attracted a vigorous follow up effort, both in ground based spectroscopy and imaging, as well as with HST (Meyer & York 1992, Lanzetta & Bowen 1992, Cohen et al 1994, Cohen et al 1996, Burbidge et al 1996, Le Brun et al 1997); since Lyman- is not shifted to wavelength accessible from the ground until , the low- 21cm absorbers were the most accessible “nearby” examples of the DLa class of absorber. More recently, ultraviolet spectroscopic surveys of bright quasars with HST are producing low DLa systems (Lanzetta et al 1997, Turnshek 1997), which in turn make interesting source lists for 21cm follow up.
A number of VLBI experiments have been attempted in the redshifted line with the goal of measuring transverse structure and kinematics in the intervening absorbers (Wolfe et al 1976, Johnston et al 1979, Brown et al 1988, Briggs et al 1989). Since these experiments required receiving systems for the specific sky frequencies of the redshifted line, there have seldom been more than two stations participating in each experiment, and typically, one of the stations was Arecibo, which has a limited tracking range, with the net result that only very sparse uv coverage was obtained. In principle, even this limited coverage can be of use, since it does serve to resolve away extended structure and isolate the absorption against the core component, thus selecting the same line of sight as probed by the optical/UV spectroscopy. In this way, a fairer estimate of spin temperature can be obtained by comparing the Lyman- and 21cm line optical depths.
2. The Present
Progress in observing redshifted lines has been limited in the past by the frequency coverage available at the large fully-steerable telescopes and by radio interference. Recent installation of wide-band receiving systems at the Westerbork Synthesis Radio Telescope (WSRT) has led to a surge in the discovery of redshifted 21cm and OH lines, as well as providing a fresh look at some old favorites. Interferometers are relatively invulnerable to moderate levels of interference, and the new observations are showing that the new absorption systems are there, awaiting discovery.
New classes of redshifted 21cm absorber have been turned up during the last two years. The study of compact symmetric radio sources (CSOs) by Vermeulen (this workshop) has shown that these sources as a rule do have associated 21cm absorption, apparently closely tied to the nuclear region of the source. De Vries, O’Dea and colleagues are finding absorption associated with gigaHertz peaked radio sources. Lane (poster this workshop, Lane et al 1998), using MgII absorption to select redshifts for observation, is finding new 21cm lines in roughly the expected proportion.
2.1. PKS 1229-021 revisited
The quasar PKS 1229-02 presents an interesting case study of the intervening galaxy class of 21cm line absorber (Brown & Spencer 1979). As one of the earliest identified absorption systems (Kinman & Burbidge 1967) through its strong MgII doublet at , it has received much attention (Peterson & Strittmatter 1978, Brown & Spencer 1979, Briggs & Wolfe 1983), becoming a prototype of the DL systems with asymmetric metal lines (Briggs et al 1985, Prochaska & Wolfe 1997) and the focus of a detailed VLA polarization study by Kronberg, Perry & Zukowski (1992), since the radio continuum extent of in the background quasar permits mapping the Faraday rotation along a cut through the disk of the intervening absorber.
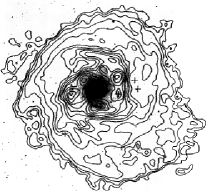
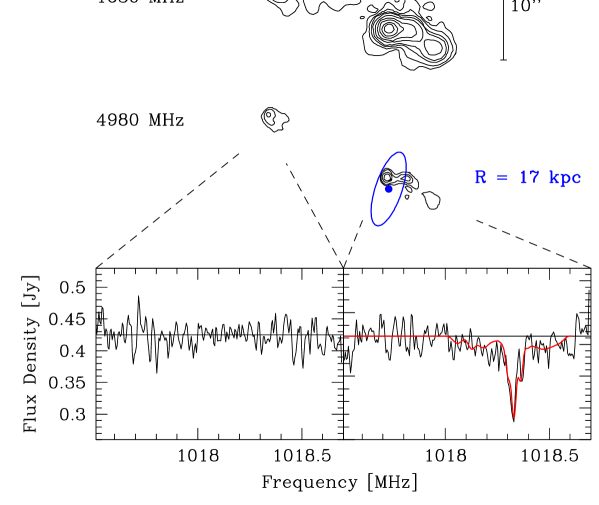
The radio source is marginally resolved by the Westerbork synthesized beam at 1018 Mhz, allowing the data to be decomposed to obtain spectra against the two main components as shown in Fig. 3. The absorption appears to be concentrated on the SW structure, and no absorption is detected against the NE extended lobe. In addition to the narrow 21cm absorption that has been known for some time (Brown & Spencer 1979), the new WSRT data show broad, low level absorption in the 21cm profile at frequencies both above and below the narrow line.
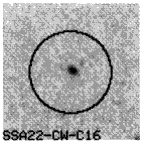
Ground-based (Steidel et al 1994) and HST imaging (Le Brun et al 1997) have identified the absorber with a galaxy of optical luminosity . HST spectroscopy has measured the HI column density in the DLa line, which permits estimation of the spin temperature (see also Lane this workshop). Comparison of the angular size of the radio structure with the angular size subtended by a moderately bright disk galaxy at this redshift (see Figs. 4 and 3) shows that the quasar nucleus must be close to the disk center and that the radio jet extends on galactic scales behind the intervening disk galaxy.
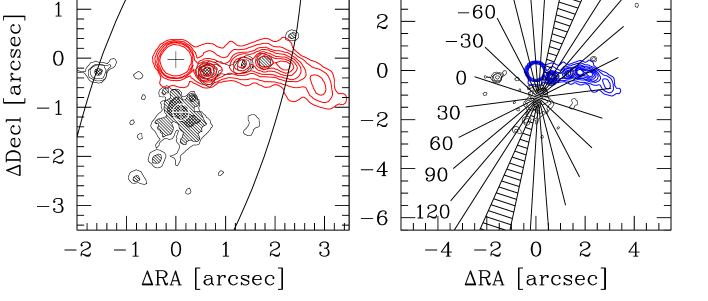
Tests of a range of differentially rotating disk models describing gas-rich disk galaxies show that an inclined disk with a flat rotation curve and a gradually declining optical depth with radius mimics very well both the narrow feature and broad wings in the absorption profile. The optical depth against the quasar core is , and parameters for inclination and position angle of the major axis are surprisingly (see Fig. 4) well constrained for such a model. The natural next step is to map the absorption with a moderate resolution interferometer system operating at 1018 MHz.
3. Future
The broadband spectrometers coming on line over the next year will enable radio spectral surveys for absorption against large samples of high sources. It is clear that the low redshift regime of Fig. 1 will benefit from radio surveys to find DLa systems, free from bias by dust and Lyman limits, and without need to resort to HST. Furthermore, selection on 21cm absorption permits use of optically dim, high- radio galaxies as the background sources, with the advantage that optical follow up to identify the intervening DLa absorber and study its environment will be simpler, since there are less stringent requirements on precise subtraction of the quasar point-spread function. Selection on 21cm can detect heavy absorption against extended radio components in quasars for which the optical nucleus is uncovered and shows no DLa line; in this sense, the largest high- radio sources provide multiple lines of sight, increasing the effiency of observing the high end of the absorption-line distribution.


High spatial resolution observations will define the extent and fine-scale kinematics in intervening absorbers as well as measuring the local 21cm optical depth against the background nucleus for comparison with DLa lines and refinement of spin temperatures. To this end, a number of EVN telescopes are being equipped with UHF receivers, and test observations are showing that this kind of work can be done despite levels of rfi that would be intolerable in single-dish spectroscopy.
As an example of how very, limited u-v coverage can provide kinematic information, Fig. 5 shows a simple model for PKS1229-021, made by adjusting the flux densities of the knots seen in Fig. 4 to 1018 MHz, while keeping the positions and shapes fixed. Fig. 6 illustrates the response of a single Westerbork-Bonn baseline to the continuum model, along with models where selected components attenuated, to simulate localized, frequency dependent absorption. The complex visibility is modeled as the sum of the visibilities of the individual components with a phase factor to account for each component’s position () in the sky:
Each component appears in the sum with a distinctive signature (pseudo-periodicity) defined by the source model. Absorption only changes the strength of a component in the sum (), so by fitting the visibilities to find the relative strengths at every frequency, a spectrum for each component can be constructed.
A variety of follow-up observations are possible for the growing sample of 21cm lines. Faraday rotation (cf Kronberg et al 1992) and Zeeman splitting in very narrow and deep lines will soon be specifying magnetic fields in the absorbers. The time has come to re-examine the idea of Davis & May (1978) that precise measurements of narrow radio absorption lines (in HI or molecules) could determine fundamental constants ( and ) by observing the deacceleration of the Universe as a function of in observations spaced over a few decades.
References
Bahcall, J.N., & Spitzer, L. 1969, ApJ, 156, L63
Bahcall, J.N., & Ekers, R. 1969, ApJ, 157, 1055
Bowen, D.V., Blades, J.C., & Pettini, M. 1995, ApJ, 448, 634
Briggs, F.H., & Wolfe, A.M., 1983, ApJ, 268, 76
Briggs, F.H., Turnshek, D.A., Schaeffer, J., & Wolfe, A.M. 1985, ApJ, 293, 387
Briggs, F.H., Wolfe, A.M., Liszt, H.S., Davis, M.M., & Turner, K.L. 1989, ApJ, 341, 650
Briggs, F.H., Brinks, E., & Wolfe, A.M. 1997, AJ, 113, 467
Briggs, F.H., Lane, W., and de Bruyn, A.G. 1998, in prep
Brown, R.L., & Roberts, M.S. 1973, ApJ, 184, L7
Brown, R.L., & Spencer, R.E. 1979, ApJ, 230, L1
Brown, R.L., & Mitchell, K.J. 1983, ApJ, 264, 87
Brown, R.L., Broderick, J.J., Johnston, K.J., Benson, J.M., Mitchell, K.J., & Waltman, E.B. 1988, ApJ, 329, 138
de Bruyn, A.G., O’Dea, C.P., & Baum, S.A. 1996, A&A, 305, 450
Burbidge, E.M., Beaver, E.A., Cohen, R.D., Junkkarinen, V.T., & Lyons, R.W. 1996, AJ, 112, 2533
Carilli, C.L., & van Gorkom, J.H. 1992, ApJ, 399, 373
Carilli, C.L., Rupen, M.P., & Yanny, B. 1993, ApJ, 412, 59
Carilli, C.L., Lane, W., de Bruyn, A.G., Braun, R., & Miley, G.K. 1996, AJ, 111, 1830
Carilli, C.L., Menten, K.M., Reid, M.J., Rupen, M.P., & Yun, M.S. 1998, ApJ, 494, 175
Chen, P.C. et al 1992, ApJ, 395, L41
Cohen, R.D., Barlow, T.A., Beaver, E.A., Junkkarinen, V.T., Lyons, R.W. & Smith, H.E. 1994, ApJ, 421, 453
Cohen, R.D., Beaver, E.A., Diplas, A., Junkkarinen, V.T., Barlow, T.A., & Lyons, R.W. 1996, ApJ, 456, 132
Davis, M.M., & May, L.S. 1978, ApJ, 219, 1
Dickey, J.M., Mebold, U., Marx, M., Amy, S., Haynes, R.F., & Wilson, W. 1994, A&A, 289, 357
Fall, S.M., Charlot, S., & Pei, Y.C. 1996, ApJ, 464, L43
Giavalisco, M., Steidel, C.C., & Macchetto, F.D. 1996a, ApJ, 470, 189
Giavalisco, M., Livio, M., Bohlin, r.C., Macchetto, F.D., & Stecher, T.P. 1996b, AJ, 112, 369
Hewett, P.C., Foltz, C.B., & Chaffee, F.H. 1993, Ap.J., 406, L43
Johnston, K.J., Broderick, J.J., Condon, J.J., Wolfe, A.M., Weiler, K., Genzel, R., Witzel, A., Booth, R. 1979, ApJ, 234, 466
Kamphuis, J., & Briggs, F.H. 1993, A&A, 253, 335
Kanekar, N., & Chengalur, J.N. 1997, MNRAS, 292, 831
Khersonsky, V.K., & Turnshek, D.A. 1996, ApJ, 471, 657
Kinman, T.D., & Burbidge, E.M. 1967, ApJ, 148, L59
Kronberg, P.P., Perry, J.J., Zukowski, E.L.H., 1992, ApJ, 387, 528
Lane, W., Smette, A., Briggs, F.H., Rao, S., Turnshek, D.A., & Meylan, G. 1968, AJ, 116, in press
Lanzetta, K.L, & Bowen, D.V. 1992, ApJ, 391, 48
Lanzetta, K.L., Wolfe, A.M., & Turnshek, D.A. 1995, ApJ, 440, 435
Le Brun, V., Bergeron, J., Boisse, P., Deharveng, J.M. 1997, A&A, 321, 733
Madau, P. 1998, in The Hubble Deep Field, eds. M. Livio, S.M. Fall, & P. Madau, STScI Symposium Series, in press, astro-ph/9709147
Meyer, D.M., & York, D.G. 1992, ApJ, 399, L121
Peterson, B.M., & Strittmatter, P.A. 1978, ApJ, 226, 21
Petitjean, P., Webb, J.K., Rauch, M., Carswell, R.F., & Lanzetta, K.M. 1993, MNRAS, 262, 499
Prochaska, J.X., & Wolfe, A.M. 1997, ApJ, 487, 73
Roberts, M.S., Brown, R.L., Brundage, W.D., Rots, A.H., Haynes, M.P., & Wolfe, A.M. 1976, AJ, 81, 293
Rao, S., Turnshek, D.A., & Briggs, F.H. 1995, ApJ, 449, 488
Rao, S., & Turnshek, D.A. 1998, in preparation
Schmidt, M. Schneider, D.P., & Gunn, J.E. 1994, AJ, 107, 1245
Shaver, P.A., Wall, J.V., Kellerman, K.I., Jackson, C.A., & Hawkins, M.R.S. 1996, Nature, 384, 439
Steidel, C.C. 1990, ApJS, 72, 1
Steidel, C.C. 1993, in The Environment and Evolution of Galaxies, eds. J.M. Shull & H.A. Thronson, Kluwer Academic Publ., p. 263
Steidel, C.C., Pettini, M., Dickinson, M., & Persson, S.E. 1994, AJ, 108, 2046
Steidel, C.C., Adelberger, K., Giavalisco, M., Dickinson, M., Pettini, M, & Kellogg, M. 1998, in The Young Universe, eds. d’Odorico, Fontana, and Giallongo, ASP Conference Series. (astro-ph/9804237)
Storrie-Lombardi, L.J., McMahon, R.G., & Irwin, M.J. 1996, MNRAS, 283, L79
Taramopoulos, A., Briggs, F.H., & Turnshek, D.A. 1994, AJ, 107, 1937
Taramopoulos, A., Garwood, R., Briggs, F.H., & Wolfe, A.M 1995, AJ, 109, 480
Turnshek, D.A. 1997, in Structure and Evolution of the Intergalactic Medium from QSO Absorption Line Systems, eds. Petitjean, P., & Charlot, S., p. 263
Wagoner, R. 1967, ApJ, 149, 465
Wolfe, A.M., & Davis, M.M. 1979, AJ, 84, 699
Wolfe, A.M., Briggs, F.H., & Jauncey, D.L 1981, ApJ, 248, 460
Wolfe, A.M., Broderick, J.J., Johnston, K.J., & Condon, J.J. 1976, ApJ, 208, L47
Wolfe, A.M., Briggs, F.H., Turnshek, D.A., Davis, M.M., Smith, H.E., Cohen, R.D. 1985, ApJ, 294, L67
Wolfe, A.M., Lanzetta, K.M., Foltz, c.B., Chaffee, F.H. 1995, ApJ, 454, 698
Womble, D.S. 1993, PASP, 105, 691