The luminosity function of white dwarfs and M dwarfs ††thanks: Based on observations collected at the European Southern Observatory (ESO), La Silla, Chile and at the Nordic Optical Telescope (NOT), La Palma
Abstract
By using dark nebulae as opaque outer screens, the luminosity function of white dwarfs and M dwarfs has been studied. High-extinction areas towards the Orion A, Serpens and Oph cloud complexes were observed, covering a volume corresponding to 464 pc3 in the solar neighbourhood, complete to . Foreground stars were selected by photometry and photometric parallaxes.
The resulting foreground sample consists of 21 M dwarfs and 7 white dwarfs. The derived M-dwarf luminosity function is consistent with previous studies, showing no substantial upturn beyond . The 7 white dwarfs imply a local density of 0.013 () M☉ pc-3 (15 % of the dynamical mass in the solar neighbourhood) supporting other recent results but obtained with a completely different method.
For the clouds, foreground-star data were used to derive independent cloud distances, while the background stars and a simple model of the Milky Way gave reliable cloud extinctions.
Key Words.:
Stars: late-type - low-mass, brown dwarfs - luminosity function, mass function - white dwarfs - Galaxy: solar neighbourhood - stellar content1 Introduction
The dark matter affects astronomy on all distance scales, single galaxies, groups of galaxies and the Universe as a whole. The dynamical mass in the solar vicinity has recently been determined from Hipparcos data to M☉ pc-3 (Crézé et al. creze97 (1997)), leaving little space for local dark matter, since the visible matter in form of stellar-like objects and the interstellar medium comprise Mpc-3.
The stellar contribution to the local mass density derived by Jahreiss & Wielen (jahreiss97 (1997)) is 0.039 M☉ pc-3, which agrees within errors with most other recent figures (e.g. in Méra et al. (mera96 (1996)), in Kroupa et al. (kroupa93 (1993)) and in Gould et al. (gould96 (1996))). Similar amounts of matter have been suggested to reside in the interstellar medium, M☉ pc-3 (Haywood et al. haywood97 (1997); Crézé et al. creze97 (1997); Bahcall et al. bahcall92 (1992) and references therein). However, present estimates of the local surface density of the interstellar medium range from 6 to 13 M☉ pc-2, indicating a substantial uncertainty also in the space density.
The photometric surveys by Gould et al. (gould96 (1996)) and Kirkpatrick et al. (kirkpatrick94 (1994)) give 0.011 M☉ pc-3 for M dwarfs in the mass interval 0.1–0.5 M☉. For the nearby stars the corresponding numbers are 0.013 and 0.015 M☉ pc-3 respectively for Reid & Gizis (reid97 (1997)) (hereafter RG97) and Jahreiss & Wielen (jahreiss97 (1997)). The discrepancy between the photometric and the nearby samples is significant and has been suggested to arise from unresolved binarity (Kroupa kroupa95 (1995)) and structure in the vs relation that has not been taken into account (RG97). For the white dwarf (WD) mass density, the 0.003 WDs pc-3 ( 0.002 M☉ pc-3) given in Liebert et al. (liebert88 (1988)) (hereafter LDM88), is less than 3 % of the local dynamical mass. There are, however, recent investigations that point to a much higher mass hidden in WDs. Ruiz & Takamiya (ruiz95a (1995)) (hereafter RT95) derived, from a large proper motion survey, a factor three higher space density than in LDM88. A similar value was obtained by Oswalt et al. (oswalt96 (1996)) from WDs in binaries. This revision of the WD space density (supported also by this paper) indicates that as much as 15 % of the local dynamical mass can be hidden in WDs.
Thus, although the bulk of the local mass seems to be identified, the role of the late M dwarfs and WDs in this context is still not clear and remains a question to discuss.
In this paper the subject is addressed in a survey of opaque nebulae, obtaining volume limited and dynamically unbiassed samples of foreground M dwarfs and WDs. This method was first proposed by Herbst & Dickman (herbst83 (1983)) and has previously been used by Jarrett (jarrett92 (1992),jarrett95 (1995)) and Jarrett et al. (jarrett94 (1994)) (hereafter JDH94), whose results will be discussed in Sect. 8.1. The present survey covers a volume corresponding to 464 pc-3 in the solar neighbourhood and is complete to . The completeness limit is 2 magnitudes deeper than the previous surveys by Jarrett and the volume twice as large.
In § 2 the selection of the target clouds is described. § 3 outlines the observations and reduction procedures. The extinctions of the clouds are derived in § 4. The selection of foreground stars, including colour-colour analysis and photometric parallaxes is decribed in § 5. Constraints on our foreground sample obtained from other sources are given in § 6. The M-dwarf luminosity function (LF) and WD space densities, including corrections for multiplicity and galactic density gradients are derived in § 7. In § 8 the results of this paper are compared to other recent findings, with special emphasis on the dark cloud survey described in JDH94. The conclusions and some ideas for the future are given in § 9.
2 Selecting target clouds
A suitable target cloud should fulfill certain criteria. Its distance has to be known in order to match integration times to the faintest stars at the cloud’s edge. It has to be sufficiently opaque ( mag) to screen out the vast majority of background stars and galaxies. The high extinction areas must be large enough to provide a reasonable number of foreground stars. It is also desirable to avoid the immediate neighbourhood of star-forming regions, since young overluminous stars within, or just in front of, the cloud may be mistaken as nearby older field M dwarfs.
The final selection includes the following cloud complexes, Orion A (southern part of L1641, 480 pc, , ), Serpens ( south from the Serpens cloud core, 200–250 pc, , ) and two separate areas in Oph (L1688 and L1689, 160 pc, , ). Cloud distances for the original selection were taken from Hilton & Lahulla (hilton95 (1995)).
2.1 Cloud distances
The photometric distances and the total number of M dwarfs in front of Orion A indicate a distance of 400 rather than 480 pc. This result is consistent with the 390 pc in Anthony–Twarog (anthonytwarog82 (1982)), derived from a subsample in the Warren & Hesser (warren78 (1978)) catalogue of stars associated with the Orion complex. In order to confirm this finding, the Hipparcos catalogue (ESA hipparcos (1997)) was searched, resulting in parallaxes with standard errors less than 1 mas for 92 of the Warren stars, showing a well-defined peak at pc.
For Serpens, Straizys et al. (straizys96 (1996)) gave a mean distance of 259 pc for 18 stars associated to the cloud. Their total sample consists of 99 stars, foreground, embedded and background. The low-extinction part of their sample indicates an extinction wall at 255 pc. Of the 99 stars, 13 were measured by Hipparcos, revealing a few cases of misclassified luminosity classes, but basically confirming a distance of 260 pc.
Eleven of the stars that were assigned a high probability to be associated with the Oph complex by Elias (elias78 (1978)) were identified in the Hipparcos catalogue and show a sharp peak at 150 pc.
The distances finally adopted in this paper are 400, 255 and 150 pc respectively to the Orion A, Serpens and Oph complexes. Note that these clouds are extended irregular objects far from being sheet-like or spherical. The distances above were derived from observations of optically visible stars, and therefore mainly probe the front edge of the cloud, which though is sufficient for the purpose of this paper. The errors in the cloud distances are expected to be on the order of 10 %, giving a corresponding volume uncertainty of 30%.
3 Observations and reductions
The main body of data consists of photometry and was collected at the ESO NTT 3.55 m telescope at La Silla, Chile. The Serpens and Oph areas were observed in Jun28–Jul01, 1995 and cover 536 and 816 arcmin2 respectively. The Orion A field, observed in Jan24–26 1996, covers 158 arcmin2. The same instrumental setup was used in both runs, EMMI RED with CCD #36, TEK2048, each pixel corresponding to 0.27″. The unvignetted field of view was 8.6’ x 9.15’. Bias and flatfield corrections were done in a standard way with IRAF 111IRAF (Image Reduction and Analysis Facility) is distributed by National Optical Astronomy Observatories (NOAO), which is operated by the Association of Universities for Research in Astronomy, Inc., under contract with the National Science Foundation..
The transformations to the Johnson and Kron-Cousins systems were based on standard stars selected from Landolt (landolt92 (1992)). Since the observations were aimed at M dwarfs in the first place, care was taken to include the reddest dwarf stars in this list, G45-20 (), G156-31 (), G12-43 (), G10-50 () and G44-40 (). The transformation to the standard system includes corrections for extinction, zero-point offsets and linear colour terms. The rms of the standard star residuals across the whole fitted colour range () is 0.02 mag in and 0.03 mag in .
3.1 Complementary NOT observations
For Orion A, part of the photometric candidates were measured in using ARNICA, a NICMOS3 near-IR array at the Nordic Optical Telescope (NOT), La Palma, in Sep 1996. The calibrations were made via standard stars provided by the ARNICA team (Hunt et al. hunt95 (1995)). The Hunt transformation was adopted: zero-point offset. The final error in the calibration of the magnitudes is 0.07 mag.
Low-resolution spectra of the two brightest WD candidates were obtained at the NOT in Nov 1997, using the ALFOSC, a low-resolution spectrograph/focal reducer combination instrument. Standard reductions were carried out with IRAF. It was not possible to apply a meaningful flux calibration, since the targets were always at airmasses between 2 and 3.5, leading to a substantial loss of light in the blue end of the spectra.
Since this survey was designed for detecting M dwarfs, the original exposure times were set rather short. The discovered WDs are bluer than the M dwarfs, resulting in uncertain magnitudes in the original data. The WD photometry was improved by ALFOSC observations at the NOT in Nov 1997. Again standard methods were used in the reductions.
All instrumental magnitudes were extracted by an empirical growth-curve method outlined in Festin (festin97a (1997)).
The completeness limit of the survey was set by the data, as the magnitude at which the mean of the internal magnitude errors in a field equals 0.12 mag. This limit was justified by a star-count analysis in a previous study of the Pleiades (Festin festin98a (1998)). Table 1 gives completeness limits and positions for all the observed fields.
| field id | field centres | completeness limits | |||||||
|---|---|---|---|---|---|---|---|---|---|
| RA (2000) | DEC (2000) | ||||||||
| Serpens A | 18:27:29.1 | -3:42:21 | 26.8931 | 3.6223 | 22.1 | 23.2 | 24.2 | 17.2 | |
| Serpens B | 18:28:04.4 | -3:42:21 | 26.9610 | 3.4921 | 22.0 | 23.3 | 24.4 | 17.4 | |
| Serpens C | 18:28:03.3 | -3:49:57 | 26.8463 | 3.4377 | 20.4 | 22.3 | 23.9 | 16.9 | |
| Serpens F | 18:27:52.4 | -3:34:16 | 27.0576 | 3.5986 | 21.3 | 22.5 | 23.7 | 16.7 | |
| Serpens J | 18:28:23.2 | -3:34:18 | 27.1164 | 3.4847 | 21.3 | 22.9 | 23.4 | 16.4 | |
| Serpens K | 18:28:39.4 | -3:45:28 | 26.9821 | 3.3390 | 21.5 | 22.9 | 24.3 | 17.3 | |
| Serpens L | 18:29:13.7 | -3:45:28 | 27.0480 | 3.2125 | 22.2 | 23.6 | 24.5 | 17.5 | |
| Oph E E | 16:31:56.7 | -24:27:53 | 353.8780 | 15.9224 | 21.5 | 22.6 | 23.5 | 17.6 | |
| Oph E F | 16:32:49.3 | -24:29:24 | 353.9928 | 15.7544 | 21.4 | 22.7 | 23.7 | 17.8 | |
| Oph E G | 16:32:48.2 | -24:38:01 | 353.8765 | 15.6643 | 21.5 | 22.6 | 23.5 | 17.6 | |
| Oph E H | 16:33:22.5 | -24:40:14 | 353.9349 | 15.5415 | 21.5 | 22.7 | 23.7 | 17.8 | |
| Oph E I | 16:33:24.6 | -24:32:29 | 354.0423 | 15.6192 | 21.5 | 22.5 | 23.6 | 17.7 | |
| Oph E J | 16:33:23.3 | -24:25:16 | 354.1341 | 15.7009 | 21.4 | 22.6 | 23.6 | 17.7 | |
| Oph W B | 16:28:00.1 | -24:36:09 | 353.1580 | 16.5100 | 21.4 | 22.4 | 23.5 | 17.6 | |
| Oph W D | 16:27:42.4 | -24:43:33 | 353.0152 | 16.4791 | 20.3 | 21.0 | 22.4 | 16.5 | |
| Oph W D’ | 16:27:42.3 | -24:28:45 | 353.2084 | 16.6420 | 21.3 | 22.5 | 23.4 | 17.6 | |
| Oph W E | 16:27:27.7 | -24:36:09 | 353.0736 | 16.6023 | 20.9 | 22.6 | 23.5 | 17.7 | |
| Oph W G | 16:27:09.1 | -24:27:49 | 353.1339 | 16.7469 | 20.0 | 21.5 | 22.6 | 16.7 | |
| Orion A F1 | 5:41:22.6 | -8:34:35 | 212.7511 | -19.4421 | 21.5 | 23.4 | 24.5 | 16.5 | |
| Orion A F2 | 5:41:22.6 | -8:25:57 | 212.6138 | -19.3793 | 21.5 | 23.4 | 24.5 | 16.5 | |
4 Star counts and cloud extinctions
The extinction offsets relative to a reference field were derived for each field by the method of star counts (Dickman dickman78 (1978)). Since there are more background stars present in the fields than in or , the band was used for the star counts. The derived extinction in is transformed to by the relation in Winkler (winkler97 (1997)), .
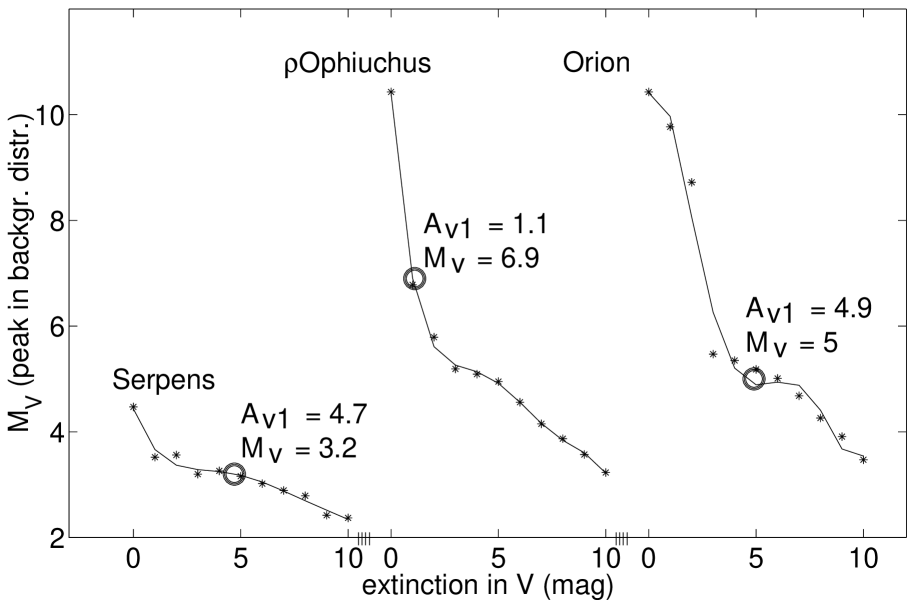
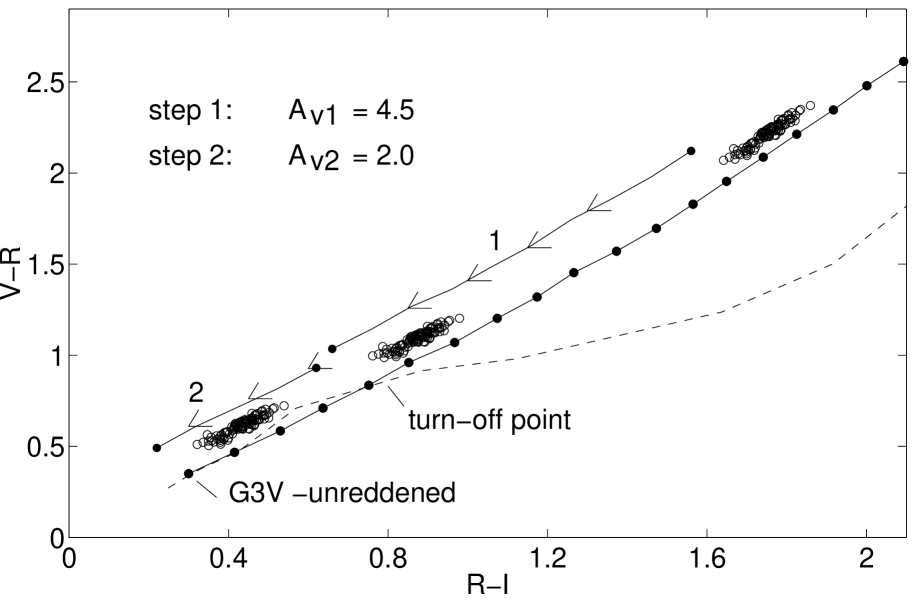
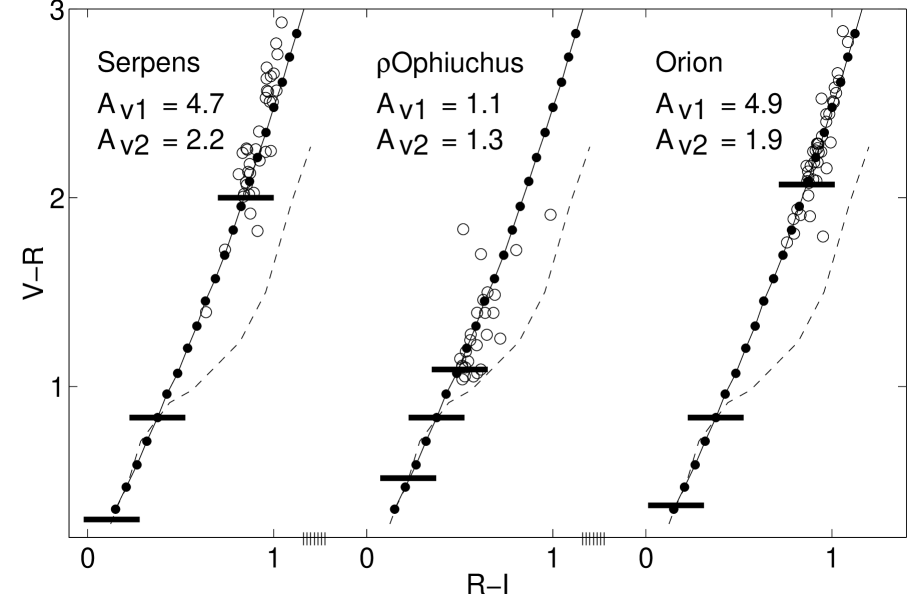
In order to estimate absolute extinctions in the reference fields, a two-step method was used. A first estimate is obtained by shifting the blue edge of the bulk of the background stars along the reddening curve to the turn-off point (step 1 in Fig. 2). Since the majority of the background stars are reddened beyond the selected blue edge and their intrinsic colours are significantly bluer than the turn-off point (M0V), the corresponding extinction offset is a crude lower limit of the real value. Although this lower limit is sufficient for most cases, it can be further refined (step 2 in Fig. 2) by using knowledge of the galactic structure and the LF. The Galaxy model of Bahcall & Soneira (bahcall80 (1980)) was used together with the LFs in Gould et al. (gould96 (1996)) () and Scalo (scalo86 (1986)) () to derive the distribution of background stars as a function of cloud extinction. Figure 1 shows at the peak in the distribution of through-shining stars as a function of . The observed fields are at a low galactic latitude and suffer from high extinction. The background stars are therefore dominated by the thin-disk population, which makes the single-component disk of Bahcall appropriate to use. Uncertainties inherent in the model would mainly arise from systematic errors in the scale height vs spectral type relation. Such effects are small enough to be dominated by the variation in the LF of the background stars. Errors in step 2 that may arise from uncertainties in the LF are expected to be small, since the visible background stars predominantly consist of dwarfs between F and early K, i.e. stars for which the LF is well defined. Steps 1 & 2 are shown for the three reference fields in Fig. 3. Note that step 1 is a lower limit of the extinction derived independently from any assumptions of galactic structure or the LF. The error in step 2 is estimated to be 0.5 mag. The derived extinction of the reference field, , is still only a lower limit, since we may now use the better estimate instead of in step 2, and iterate further. However, we restrict ourselves to two steps and regard the derived value to be a conservative lower limit with an error of 0.5 mag in .
4.1 Orion A
4.2 Serpens and Oph
The fields were divided into overlapping squares of 1′ x 1′, separated by 15″. The number of stars within each square was summed in 0.1 mag bins, providing the extinction relative to the reference field.
The results for Serpens and Oph respectively are and . The same reference field was used for both areas in Oph, since they are separated by only .
The extinctions at the centres of the two areas in Oph were estimated from 13CO column densities in Loren (loren89 (1989)). Using the same –13CO relation as in the Orion case, was deduced. The present survey gives a lower limit of . For the reference field, the 13CO gave , whereas this survey gives a lower limit of .
For both Orion A and Oph, the lower limits from the present survey are in good agreement with independent values derived from 13CO data. This shows that reliable lower limits on the extinction can be obtained directly from the data. The Serpens extinction, derived using the same method as for Orion and Oph, is therefore likely to be a reliable lower limit as well.
5 Selecting foreground stars
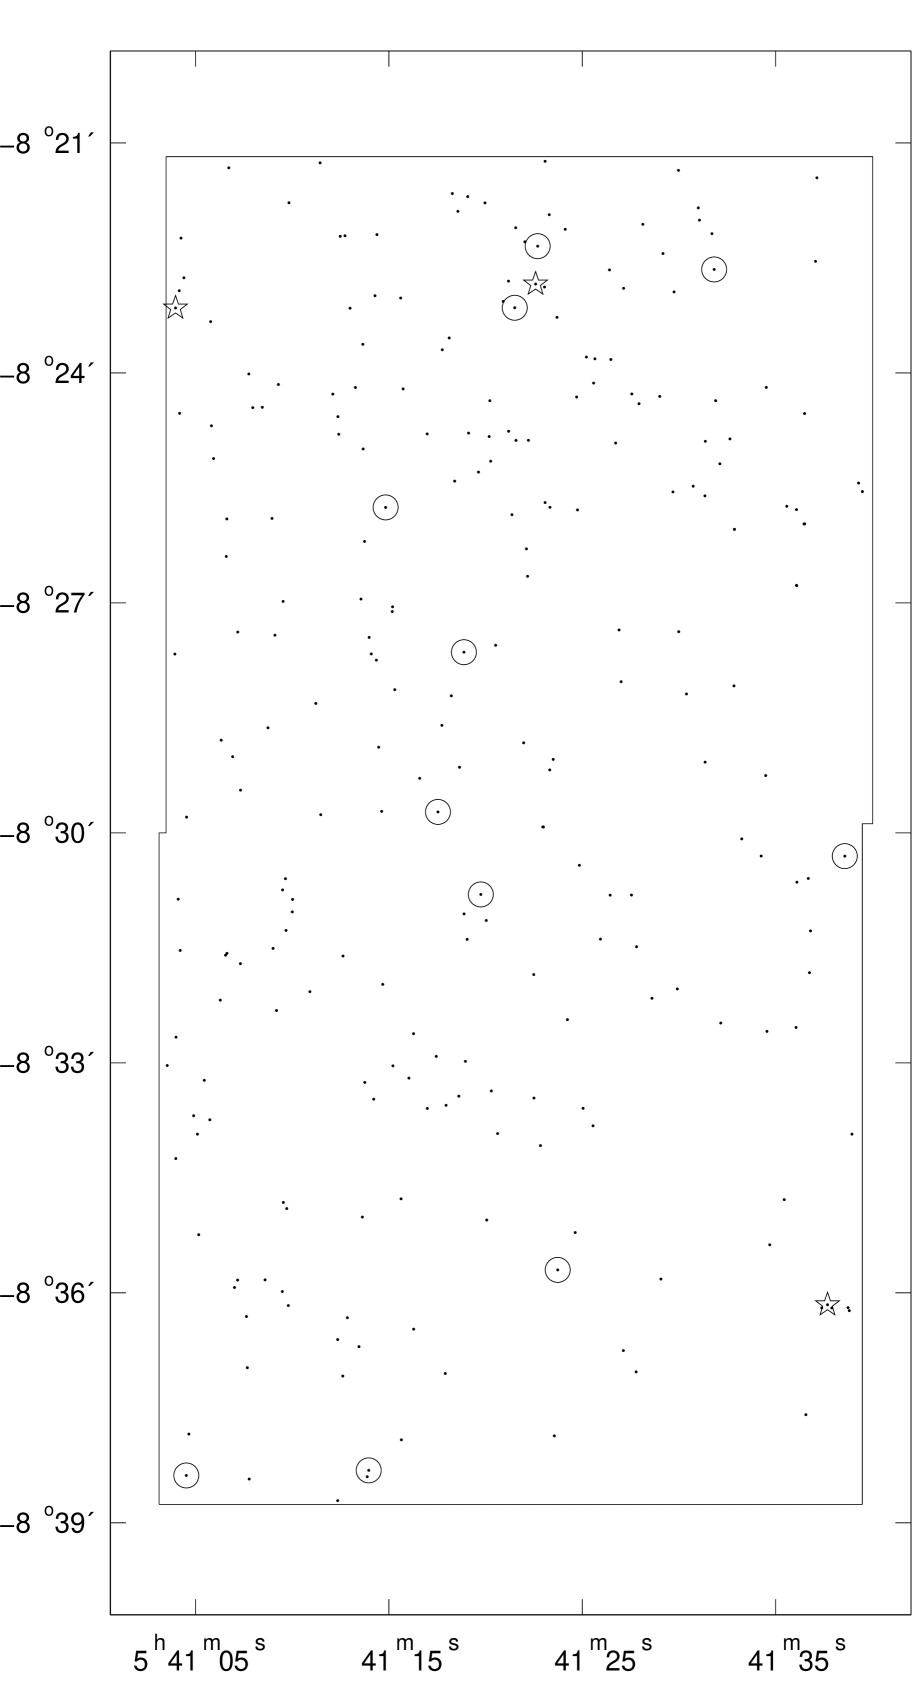
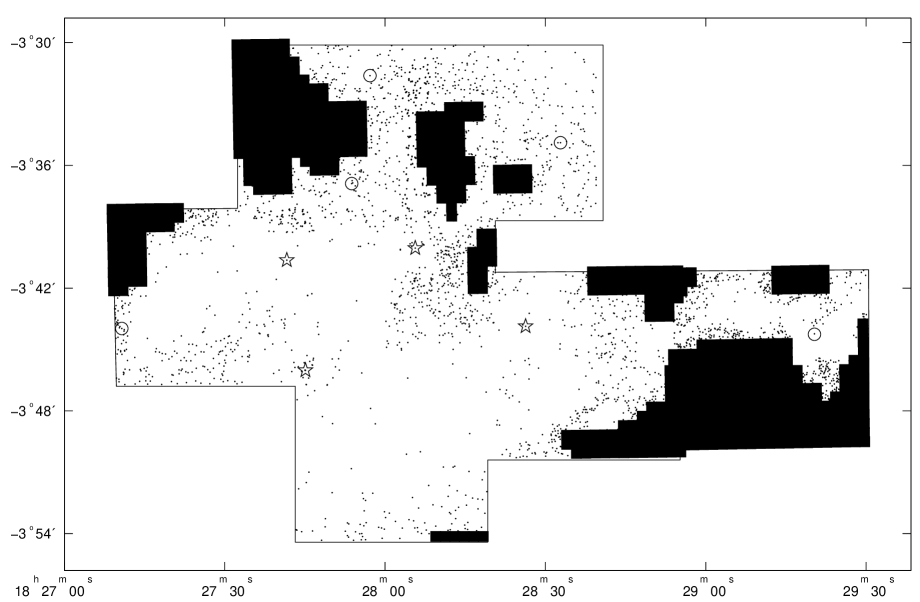
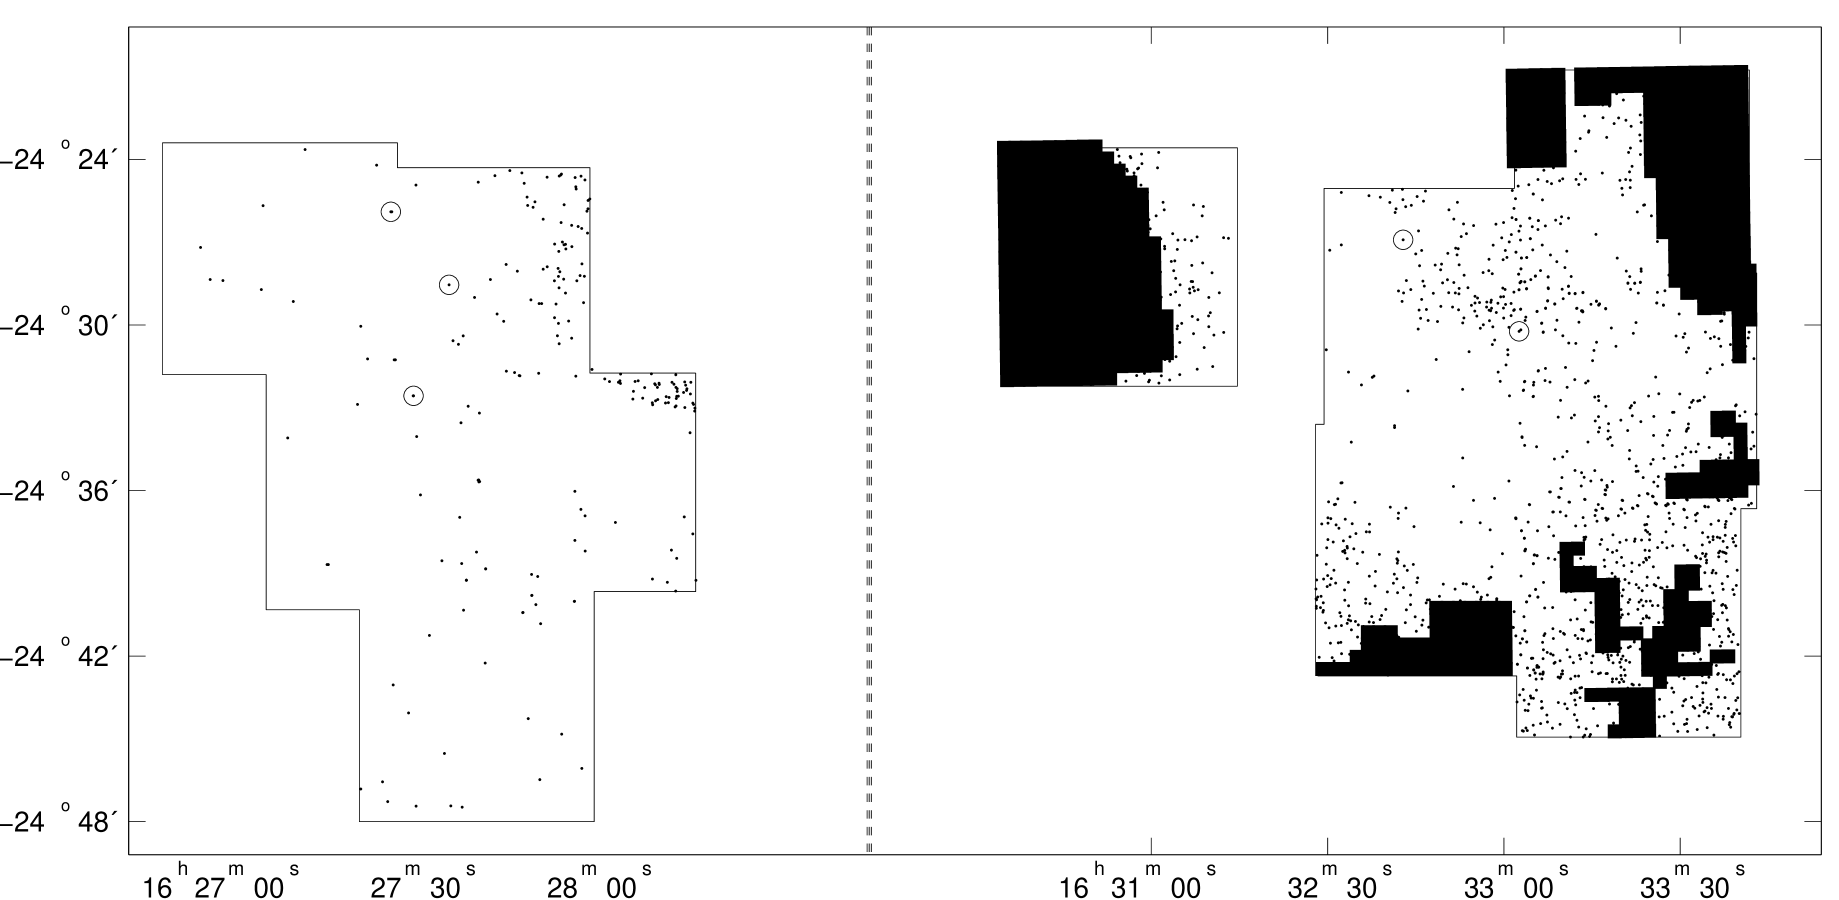
To really make use of the clouds as screens, crowded regions must be avoided. A conservative upper limit on the average surface density of stars brighter than the completeness limits was set at 4 per arcmin2. The remaining areas are for Oph 689 arcmin2 and for Serpens 412 arcmin2, 84 and 77 % of the respective original fields. For Orion A the entire field (158 arcmin2) is sufficiently sparse.
Figures of the target areas, including selected foreground stars and excluded regions are shown in App. A.
5.1 Colour-colour analysis
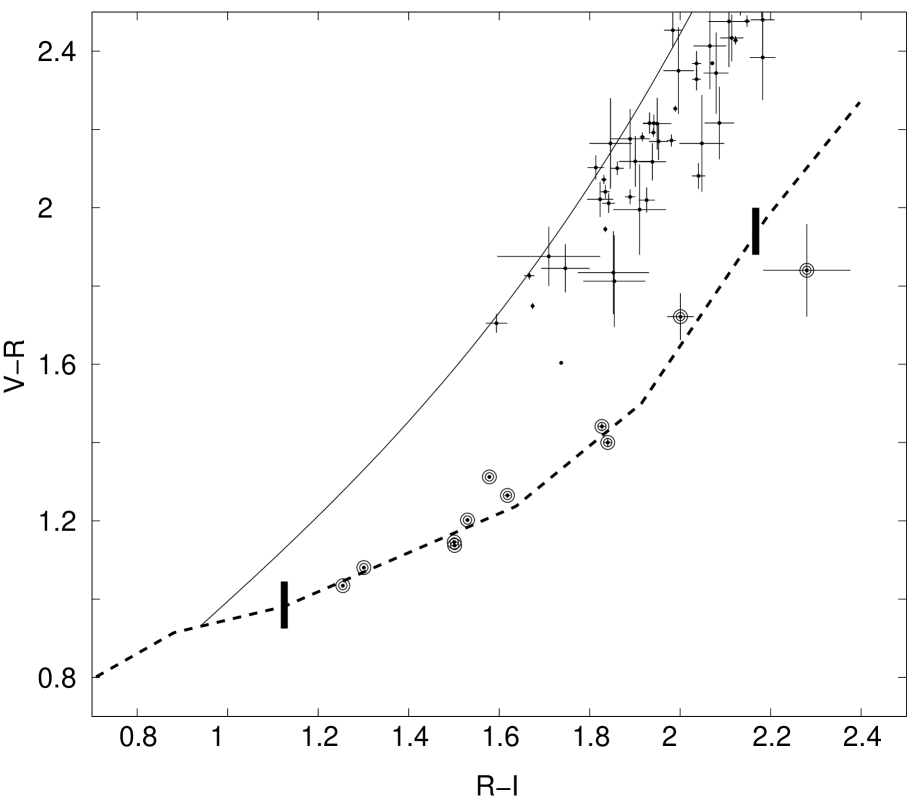
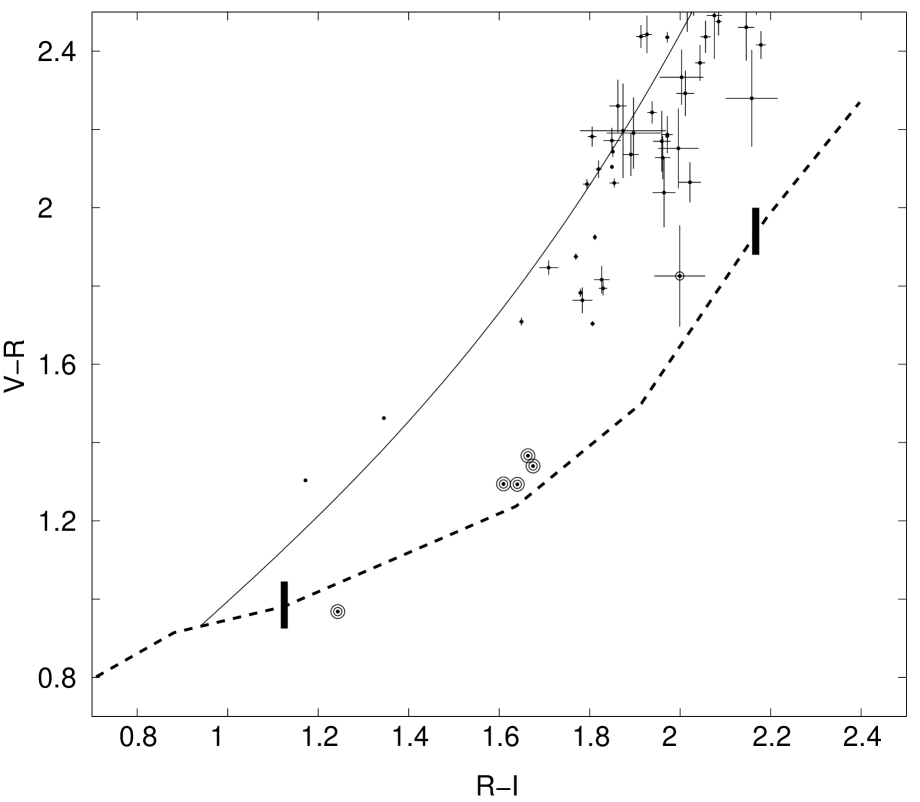
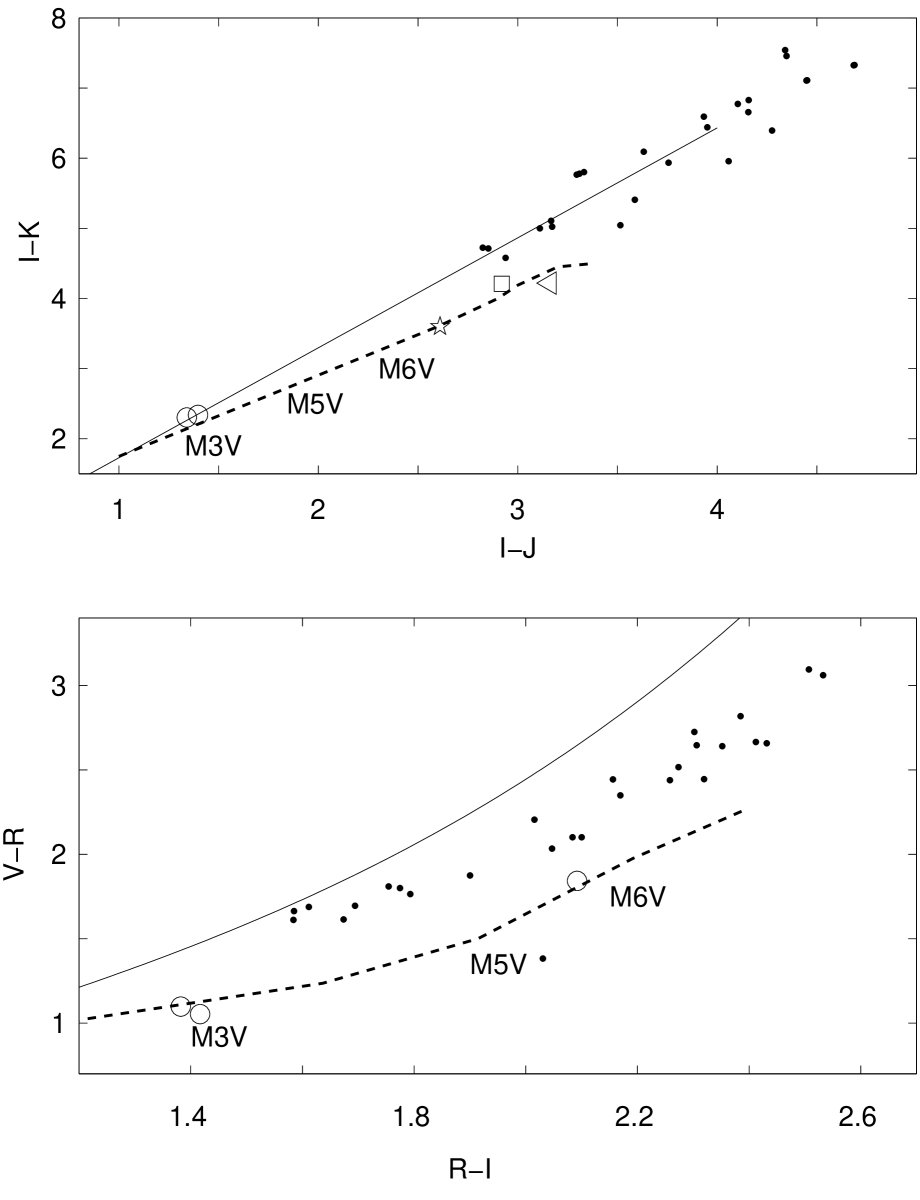
The reddened background stars separate from the foreground main sequence at (M0V), resulting in two parallell sequences separated by 0.5 mag in (Fig. 4). All stars within 0.15 mag of the empirical main sequence were considered as foreground candidates by colour and had their photometric parallaxes measured (see Sect. below). The resulting foreground M-dwarf sample is shown in Figs. 4 - 6 together with all reddened background stars brighter than the completeness limit.
In Oph a number of bright stars fall inbetween the main sequence and the reddened background stars. This is not a result of systematic photometric errors, since in the same field there are many stars lying perfectly on the reddening sequence. These objects are preferably found in Oph W. Since they are absent from the Serpens area at a lower galactic latitude, reddened M giants are not a likely explanation. Most probably they are recently formed stars, still embedded in the nebula (see also Sect. 6 and Fig. 10).
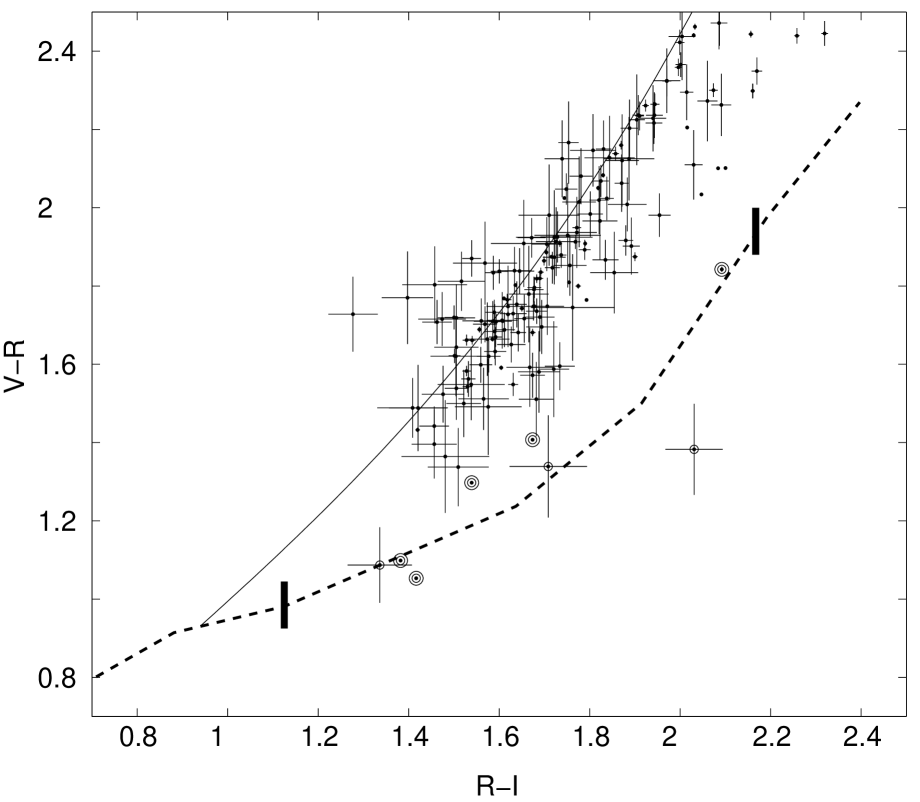
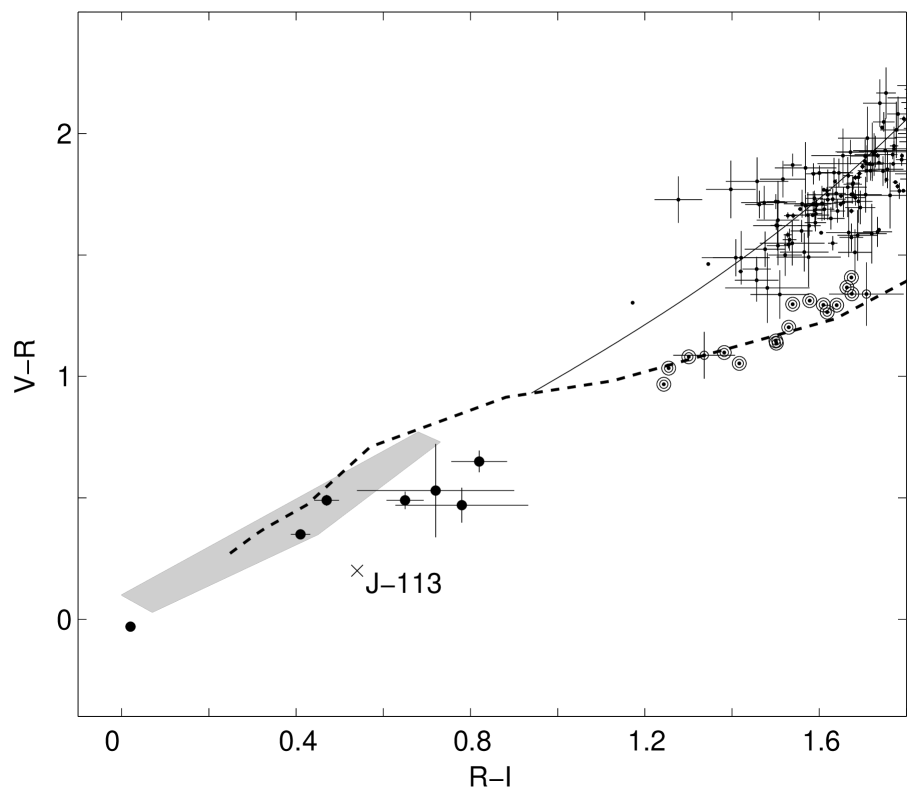
As photometric WD candidates those objects lying approximately in the region of the WDs in Bergeron et al. (bergeron97 (1997)) were considered (Fig. 7). These objects are distinctly separated from other stars and form a well-defined isolated group. Note that the reddest WDs systematically fall below the empirical sequence. This is probably caused by the increasingly different spectra in WDs as compared to the standard stars towards cooler temperatures.
5.2 Photometric parallaxes
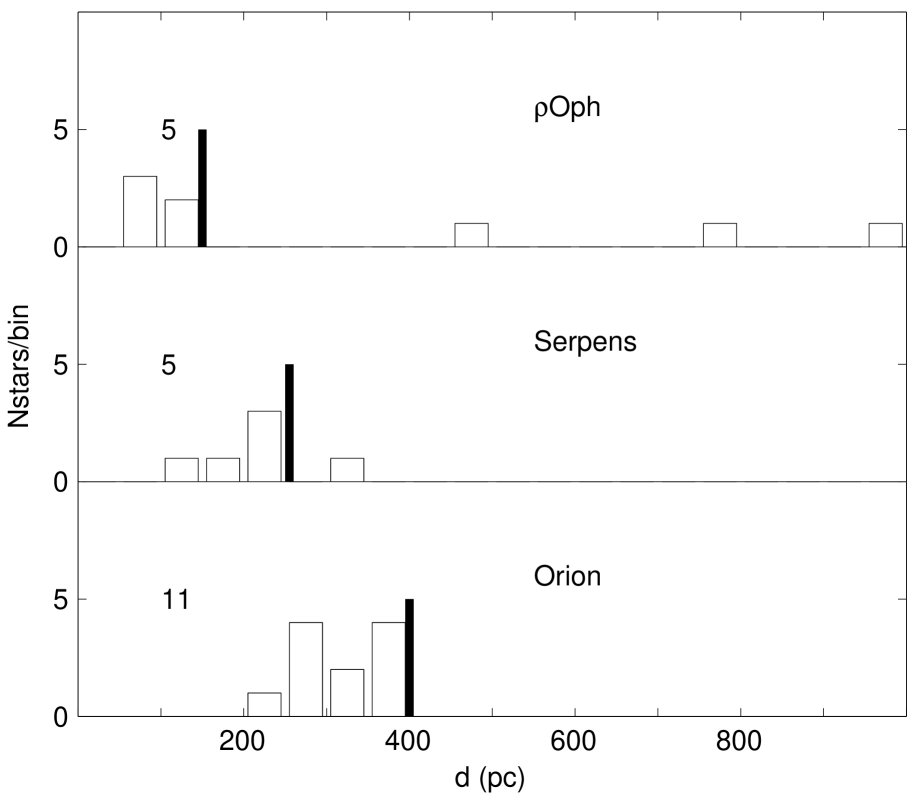
Photometric distances, although suffering from a large spread in the vs relation, are used here as an additional tool for cleaning out background stars. As a bonus, cloud distances get independent consistency checks. Note the lack of stars between 400 and 500 pc for Orion A in Fig. 8, clearly indicating that pc is an overestimate of the distance.
To check possible foreground extinction, stars within from the target areas were selected from the UBV catalogue Mermilliod (mermilliod87 (1987)) via SIMBAD. was determined by the Q method for stars earlier than A0 (see e.g. Mihalas & Binney (mihalas81 (1981))). Later stars with known spectral types were also used. For all three areas it was concluded that foreground extinction is too small to affect the results of this paper.
5.2.1 M dwarfs
Each object was assigned a mean, min and max distance. The mean distance is derived from the composed vs relation in RG97. Min and max values come from their corresponding spread . A histogram of the mean distances to the colour-colour foreground candidates marked in Figs. 4- 6 is shown in Fig. 8. Stars consistent with being foreground objects are distinctly sorted out. The final sample of probable foreground M dwarfs consists of 21 stars (Table 2).
5.2.2 White dwarfs
Photometric distances were estimated via a linear least-square fit of vs of the WDs in Bergeron et al. (bergeron97 (1997)) with parallax errors less than 30 % :
This functional form provides only a rough estimate of the WD absolute magnitude. One should keep in mind that there are WDs like ESO439-26 (Ruiz et al. ruiz95b (1995)) that do not follow this relation in the least.
It is possible, although unlikely, that these WD candidates are reddened background stars. Since the background extinction at the position of the WD candidates in all cases is estimated to exceed 6.8 mag in (Table 2), a through-shining star of the same colour as our reddest WD candidate () would have an unreddened colour . There are no such stars. Suppose that they are indeed early-type stars shining through low-extinction windows. A B1V star behind OrionA would then have to be at a distance of about 0.5 Mpc to fit the observed magnitudes, i.e 160 kpc above the galactic plane, which is unrealistic. The simplest answer is that these objects are indeed foreground WDs.
5.2.3 Spectroscopic confirmation of white dwarfs
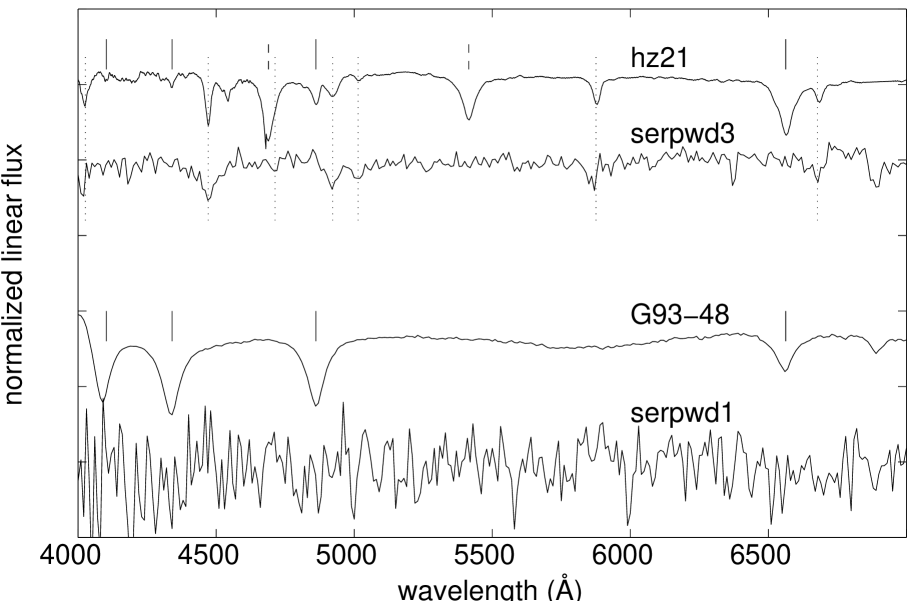
In Fig. 9, spectra taken at the NOT of the two brightest WDs are compared with two spectrophotometric standard stars. Hz21 is a He-rich WD of type DO, while G93-48 is of type DA. The serpwd3 spectrum is classified as type DB, since it only shows HeI lines (Dreizler & Werner dreizler96 (1996)). The second WD is serpwd1, showing a rather noisy spectrum due to its faint magnitude. However, the absence of prominent spectral features in combination with its magnitude and colour makes it a very likely WD.
| id | RA (2000) | DEC (2000) | w.ct. | ||||||||
| omd 1 | 5:41:22.7 | -8:22:21 | 15.77 0.01 | 1.50 0.01 | 2.64 0.01 | 11.6 | 230 | 195 | 270 | 6.8 | 1.32 |
| omd 2 | 5:41:38.6 | -8:30:18 | 15.95 0.01 | 1.26 0.01 | 2.29 0.01 | 10.6 | 346 | 295 | 407 | 6.8 | 1.32 |
| omd 3 | 5:41:14.0 | -8:38:19 | 15.99 0.01 | 1.30 0.01 | 2.38 0.01 | 10.8 | 324 | 276 | 381 | 6.8 | 1.32 |
| omd 4 | 5:41:17.5 | -8:29:44 | 16.10 0.01 | 1.50 0.01 | 2.65 0.01 | 11.7 | 267 | 228 | 314 | 6.8 | 1.32 |
| omd 5 | 5:41:04.5 | -8:38:23 | 17.26 0.01 | 1.53 0.01 | 2.74 0.01 | 12.2 | 381 | 308 | 471 | 6.8 | 1.32 |
| omd 6 | 5:41:14.8 | -8:25:45 | 17.34 0.01 | 1.58 0.01 | 2.89 0.01 | 13.0 | 290 | 235 | 358 | 6.8 | 1.32 |
| omd 7 | 5:41:19.8 | -8:30:48 | 17.87 0.01 | 1.62 0.01 | 2.89 0.01 | 13.0 | 370 | 300 | 458 | 6.8 | 1.32 |
| omd 8 | 5:41:31.8 | -8:22:39 | 18.09 0.01 | 1.83 0.01 | 3.27 0.01 | 14.3 | 262 | 232 | 295 | 6.8 | 1.32 |
| omd 9 | 5:41:23.7 | -8:35:42 | 18.35 0.01 | 1.81 0.01 | 3.21 0.01 | 14.2 | 300 | 266 | 338 | 6.8 | 1.32 |
| omd10222 (0.06) | 5:41:21.5 | -8:23:09 | 19.63 0.02 | 2.00 0.02 | 3.72 0.06 | 15.5 | 382 | 339 | 430 | 6.8 | 1.32 |
| omd11333 (0.07) | 5:41:18.9 | -8:27:39 | 20.12 0.01 | 2.33 0.04 | 4.17 0.11 | 16.6 | 358 | 317 | 403 | 6.8 | 1.32 |
| serpmd1 | 18:27:10.8 | -3:43:59 | 16.66 0.01 | 1.64 0.01 | 2.94 0.01 | 13.2 | 186 | 151 | 230 | 7.6 | 1.03 |
| serpmd2 | 18:27:57.2 | -3:31:37 | 15.02 0.01 | 1.25 0.01 | 2.21 0.01 | 10.3 | 241 | 205 | 283 | 11.3 | 1.03 |
| serpmd3 | 18:27:53.8 | -3:36:53 | 16.10 0.01 | 1.68 0.01 | 3.02 0.01 | 13.6 | 125 | 110 | 140 | 8.9 | 1.03 |
| serpmd4 | 18:28:32.8 | -3:34:53 | 16.81 0.01 | 1.61 0.01 | 2.91 0.01 | 13.1 | 212 | 171 | 262 | 9.9 | 1.03 |
| serpmd5 | 18:29:20.3 | -3:44:15 | 17.29 0.01 | 1.66 0.01 | 3.03 0.01 | 13.7 | 212 | 189 | 240 | 12.1 | 1.03 |
| ophmd1 | 16:33:02.6 | -24:30:14 | 14.60 0.01 | 1.54 0.01 | 2.84 0.01 | 12.7 | 88 | 71 | 108 | 4.8 | 1.09 |
| ophmd2 | 16:32:42.8 | -24:26:55 | 15.93 0.01 | 1.67 0.01 | 3.08 0.01 | 13.8 | 109 | 97 | 123 | 6.6 | 1.09 |
| ophmd3 | 16:27:30.4 | -24:32:34 | 14.43 0.01 | 1.38 0.01 | 2.48 0.01 | 11.1 | 143 | 122 | 168 | 7.8 | 1.09 |
| ophmd4 | 16:27:36.5 | -24:28:33 | 13.46 0.01 | 1.42 0.01 | 2.47 0.01 | 11.1 | 92 | 78 | 108 | 7.8 | 1.09 |
| ophmd5 | 16:27:26.6 | -24:25:54 | 15.99 0.01 | 2.09 0.01 | 3.93 0.01 | 16.0 | 60 | 53 | 68 | 7.8 | 1.09 |
| owd 1 | 5:41:37.7 | -8:36:09 | 22.00 0.14 | 22.78 0.06 | 23.25 0.04 | 15.8 | 313 | 269 | 365 | 6.8 | 1.32 |
| owd 2 | 5:41:04.0 | -8:23:09 | 21.24 0.03 | 21.89 0.03 | 22.38 0.02 | 15.5 | 238 | 207 | 273 | 6.8 | 1.32 |
| owd 3 | 5:41:22.6 | -8:22:50 | 22.83 0.10 | 23.55 0.15 | 24.08 0.12 | 15.8 | 459 | 393 | 537 | 6.8 | 1.32 |
| serpwd1 | 18:28:05.6 | -3:40:02 | 20.38 0.02 | 20.79 0.01 | 21.14 0.01 | 14.6 | 208 | 181 | 239 | 9.6 | 1.03 |
| serpwd2 | 18:27:45.0 | -3:46:01 | 20.51 0.02 | 20.98 0.02 | 21.47 0.01 | 15.0 | 192 | 167 | 221 | 9.9 | 1.03 |
| serpwd3 | 18:27:41.6 | -3:40:38 | 17.88 0.01 | 17.90 0.01 | 17.87 0.01 | 12.6 | 111 | 96 | 127 | 12.6 | 1.03 |
| serpwd4 | 18:28:26.3 | -3:43:52 | 21.14 0.05 | 21.96 0.04 | 22.61 0.02 | 16.3 | 181 | 157 | 208 | 11.6 | 1.03 |
6 Constraints on foreground candidates from other surveys
The Orion A area (L1641) has been extensively surveyed in the infrared (Strom et al. (strom89 (1989), strom93 (1993)); Ali & Depoy ali95 (1995)). In Strom et al. (strom89 (1989)) there is one overlapping object, however not a foreground one. The other two surveys are deeper but unfortunately do not overlap.
In Oph, the western area was entirely covered in in a survey by Barsony et al. (barsony97 (1997)). There are 30 overlapping sources brighter than our completeness limits, including all three foreground candidates in this area (ophmd3–5 in Table 2). In Fig. 10 the appearance of the overlapping sample in is compared to . Ophmd3 and 4 are confirmed as foreground by the additional data. For ophmd5, the three independent measurements are not consistent, implying either variability or a problem in the photometry. The fact that ophmd5 does not keep its position relative to the bulk of the background stars between and supports it being a foreground star of spectral type about M6V.
The Oph E area was covered in by Jarrett (JDH94 + thesis). Both our candidates in this area (ophmd1–2) have magnitudes consistent with theirs, and are considered as possible foreground stars in Jarrett (jarrett92 (1992)). Ophmd2, though, was rejected from the foreground candidates in JDH94. Both stars are slightly redder than the main sequence in (Fig. 6), but are still regarded as foreground stars. See Sect. 8.1 for a thorough comparison to Jarrett’s results.
In our Serpens field, no complementary photometric data could be found.
7 The luminosity function
A simplified version of the method (Felten felten76 (1976)), outlined below, was used to derive the LF. In a photometric survey each star has a maximum distance, , at which it still can be detected. The corresponding maximum volume, , is defined by the survey area and . Each star’s contribution to the LF is then . In order to compensate for galactic density gradients and reduce the derived LF to the solar neighbourhood, must be replaced by , a generalized volume (Tinney tinney93a (1993)):
where denotes the angular area of the field, the disk scale height and the galactic latitude. The distances involved here are small enough to neglect the radial density gradient in the Galaxy. Both the M-dwarf and WD distribution was approximated by the old disk population, with a scale height pc (Bahcall & Soneira bahcall80 (1980)).
Deriving is a trivial operation in a dark cloud survey, since for all stars brighter than the completeness limit (in absolute magnitude) . This is an important point of this paper, the survey volume not being derived through a colour-magnitude relation having a large cosmic spread. Table 3 gives the physical and generalized values of the foreground volumes. The last column in Table 2 shows the weighted count for each foreground star deduced as . Errors in the distances to the clouds are expected to be on the order of 10 %, implying volume uncertainies of 30 %. This uncertinty has not been included in the further analysis.
| area | ||
|---|---|---|
| Orion A | 285 | 216 |
| Serpens | 193 | 188 |
| Oph | 66 | 60 |
| total | 544 | 464 |
7.1 M dwarfs, main sequence
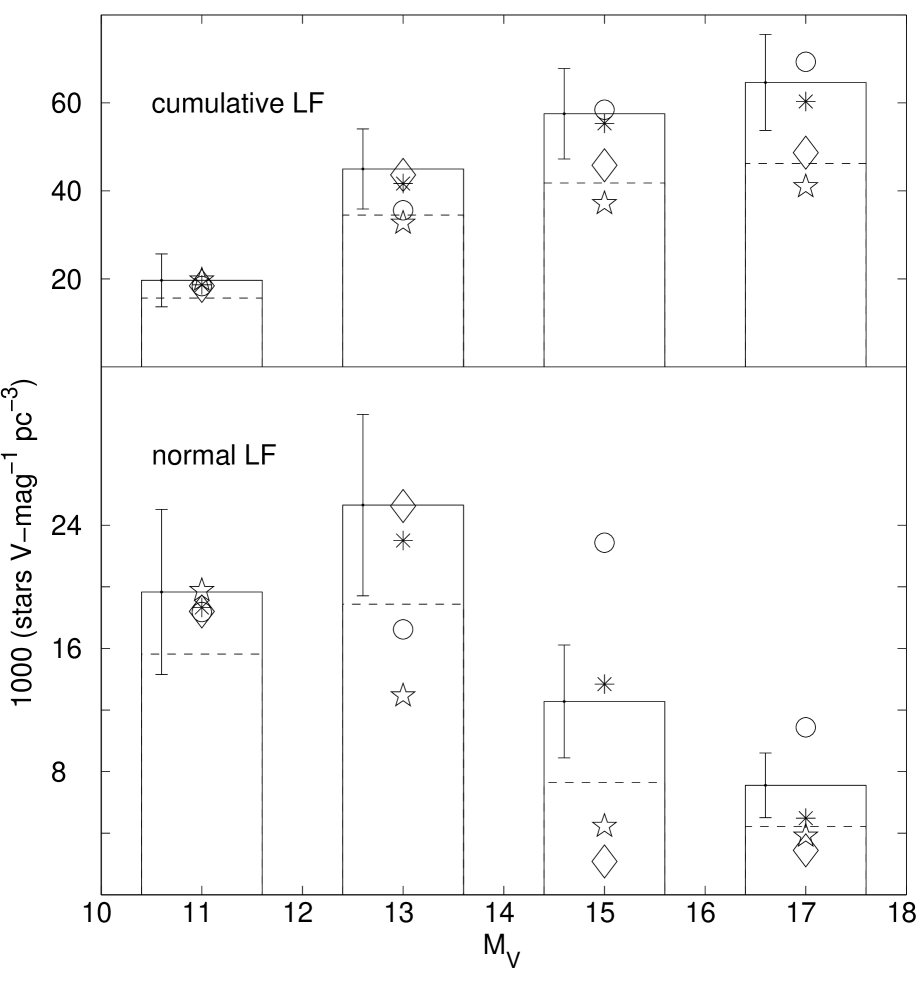
The majority of foreground stars are early-type M dwarfs, , reflecting the well-known peak in the LF. The low number of M dwarfs (21) implied a rather coarse binning in the LF. Table 4 gives the LF in 1-mag bins, while in Fig. 11 2-mag bins were chosen. The agreement with previously determined LFs is satisfactory.
For stars brighter than ( M1V) the number that is lost due to saturation starts to become significant. These stars are therefore not considered further.
The large spread in the faint bins in Fig. 11 illustrates the present uncertainty in the stellar LF. The Poissonian 1 uncertainties in Jahreiss & Wielen (jahreiss97 (1997)) and RG97 are about 30 % in the last two bins.
| bin | systems | binary corrected | ||||
|---|---|---|---|---|---|---|
| cum | cum | |||||
| 10-11 | 3 | 3.67 | 3.67 | 4.49 | 4.49 | |
| 11-12 | 4 | 4.82 | 8.49 | 6.19 | 10.68 | |
| 12-13 | 2 | 2.41 | 10.90 | 4.46 | 15.14 | |
| 13-14 | 7 | 7.85 | 18.75 | 9.30 | 24.45 | |
| 14-15 | 2 | 2.64 | 21.39 | 4.20 | 28.65 | |
| 15-16 | 1 | 1.32 | 22.71 | 2.62 | 31.27 | |
| 16-17 | 2 | 2.41 | 25.12 | 3.06 | 34.33 | |
| 17-18 | 0 | 0 | 25.12 | 0.80 | 35.13 | |
7.1.1 Lost companions
RG97 found that the number of lost unresolved companions approximately is compensated for by distant stars spread into a magnitude limited sample via Malmquist bias. This will not be the case in this survey, since the foreground sample is strictly volume limited and there is a dark cloud preventing distant stars from interfering. The number of lost companions was estimated from the binary distribution in the nearby stars in RG97. After applying the correction for galactic structure 10 companions were expected to have been lost. These were distributed as the lost binary companions in Fig. 12 of RG97 and added to our system LF. The resulting companion-corrected LF is shown in Fig. 11 and Table 4.
7.2 White dwarfs
The sample of WDs is too small to derive any details in the WD LF. Seven WDs were found, 0.015 () pc-3 (Poissonian errors), which is a significantly higher number than expected from LDM88 (0.003 pc-3), but in better agreement with RT95 and Oswalt et al. (oswalt96 (1996)), who both give pc-3. These numbers will be dicussed in more detail in Sect. 8.2.
8 Dicussion, comparison to other works
For the M-dwarf part, the agreement with other photometric surveys is satisfactory (Fig. 11). It is clear that any contamination of the M-dwarf sample from background stars and/or stars associated with the clouds must be small and that the opaque-nebula method works reliably also in a purely photometric version, provided that the photometry is sufficiently accurate.
The main advantage in comparison to other methods is that the survey volume does not rely on photometric parallaxes. Even though the individual absolute magnitudes do suffer from cosmic spread in the colour-magnitude relation, each star’s contribution to the space density does not.
If the distance to the cloud is not known a priori, it can either be estimated from the photometric distances of the foreground objects or by their integrated number in a well-known part of the LF. In this context it would be useful to obtain more data for foreground stars brightwards of the peak in the LF at .
The derived samples are volume limited and unaffected by dynamical bias. Finally, the dark clouds effectively screen background galaxies and giant stars from the foreground population.
Among the drawbacks are that the selected foreground objects in general will be too distant for binaries to be resolved and therefore the derived LF must be corrected for by an a priori known binary distribution function. The dark clouds are not evenly spread across the sky, which means that the available areas are restricted. On the other hand, they do provide a tool for probing areas near the Milky Way plane.
8.1 The Jarrett paper
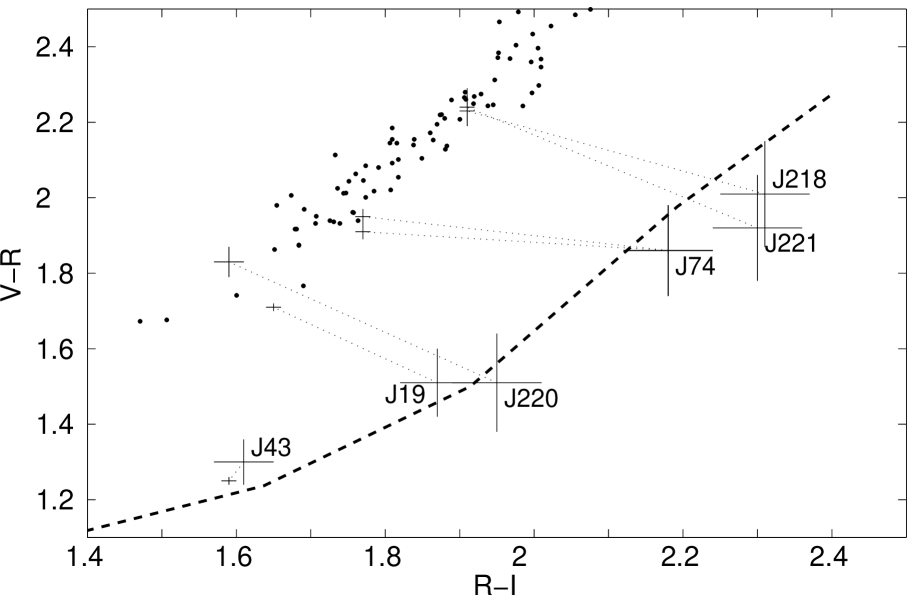
We compare our result with that of JDH94. The generalized volume sampled in that paper is 52 pc3 ( Oph) + 101 pc3 (Taurus), totally 153 pc3. A striking difference as compared to our survey is their excess of late foreground candidates, seen also in the Barnard 5 survey (Jarrett jarrett95 (1995)). The comparison here was made in Oph E, where part of our surveys overlap. Five of their six foreground candidates that were cross identified lie perfectly on the reddening sequence in our data and are definitely not foreground objects (Fig. 12). Since our data for the bright J43 are consistent, the photometric calibration is likely to be correct. A possible explanation of the colour discrepancy is that these sources were spread into the JDH94 foreground sample as a result of their lower signal-to-noise ratio. Our data reach 2 magnitudes deeper than JDH94. It may also be that the JDH94 photometry is subject to systematically discrepant corrections for atmospheric correction, since their data were acquired at high air masses (, Jarrett, priv comm.). The tendency that very faint stars, barely measurable, scatter into the M-dwarf zone is seen also in our data, and was the main reason for including objects only to the completeness limit and not all the way down to the detection limit of the survey, about 1 mag fainter.
8.2 White dwarfs
A local number density of 0.015 () WDs pc-3 was derived from the 7 WDs discovered in this survey. This is a factor 5 more than predicted from LDM88. RT95 found 0.008 () WDs pc-3 in a proper motion survey, consistent with our result, but as in our case the numbers are small. An interesting result is that Ruiz et al. (ruiz93 (1993)) found a factor 2 more stars with yr-1 than present in LHS (Luyten luyten76 (1976)) for overlapping areas. The LDM88 sample was drawn from LHS and would also be affected by this proposed incompleteness, a fact that may explain the discrepancy in the LDM88 WD density as compared to more recent results.
Oswalt et al. (oswalt96 (1996)) used yet another approach and arrived at WDs pc-3 for WDs in wide binaries. They added the single-WD LF in LDM88 (0.0023 WDs pc-3) and concluded that the total space density of WDs in the solar neighbourhood is WDs pc-3. Our results and RT95 show that the LDM88 sample is likely to suffer from a rather large incompleteness, suggesting that adding 0.0023 WDs pc-3 to the binary part results in a substantial underestimation of the total WD space density.
Our sample of WDs includes neither wide nor narrow binaries, except possible double WDs. If we add our WD density to the Oswalt binaries the result is 0.02 () WDs pc-3, corresponding to 0.013 () M☉ pc-3 if we assume a mean mass of 0.65 M☉ per WD. The WD fraction of the dynamical mass would then be 17 () %. Objects like ESO 439-20 (RT95) and WD 0346+246 (Hambly et al. hambly97 (1997)) suggest that the WD density may be even larger.
The results of the MACHO micro lensing experiment (Alcock et al. alcock97 (1997)) have given a mean mass of the lensing objects of 0.5 M☉, although strongly model dependent. The MACHO mass density in the solar neighbourhood is on the order of 0.005 M☉ pc-3, which in fact is consistent with the proposed increase of the WD space density. However, more definite results will have to await a larger volume limited sample of WDs.
9 Conclusions and future prospects
The space density of M dwarfs and WDs has been studied as volume limited samples in front of dark high extinction nebulae, a method that efficiently reduces the impact of Malmquist bias, since the survey is volume limited and the LF not dependening on individual photometric distance estimates. Areas towards the molecular cloud complexes Oph, Serpens and Orion A were observed. The survey covers a volume corresponding to 464 pc3 in the solar neighbourhood, complete to . In total 21 M dwarfs and 7 WDs were identified as foreground objects.
Although details are hard to resolve due to the limited sample, our M-dwarf LF is consistent with previous photometric results, and after binary correction also with the nearby stars. Our survey does not show any signs of the reported upturn in the faintest magnitude bins in the previous dark cloud surveys (Jarrett jarrett92 (1992),jarrett95 (1995); Jarrett et al. jarrett94 (1994)), and we conclude that their excess of faint M dwarfs is probably caused by their larger photometric errors.
The unexpected appearance of as many as 7 WDs compared to the 1.4 estimated from the WD space density in LDM88 is perhaps the most interesting result of this paper. The derived space density is 0.015 () WDs pc-3. By combining our sample with the binary WDs in Oswalt et al. (oswalt96 (1996)) the final estimate is 0.02 () WDs pc-3, implying a mass density of 0.013 () M☉ pc-3. This means that the WDs may contribute by as much as 15–20 % to the local dynamical mass.
No doubt this subject is not yet settled and deserves further investigation.
The method of opaque nebulae has indeed proved to be efficient in identifying foreground M dwarfs and WDs. Concerning the latter, any nebula that provides a colour excess () ensures that also the bluest main sequence stars get a reddened colour beyond the reddest known WDs (). Already for Orion A the available area is times larger than our field, enclosing a volume that would host 150 WDs and 550 M dwarfs, numbers that certainly are sufficient for a more detailed analysis of the corresponding LFs. The increased availability of large field CCDs and CCD mosaics provides the ideal tools for this kind of survey. We have also shown that the distance to the clouds and the cloud extinction may be reliably derived from the data alone, an important point if a future large-scale survey of this kind is to be carried out.
Acknowledgements.
I wish to thank the ESO OPC for allocating observing time for this exciting project. This work was supported by the Nordic Optical Telescope Scientific Association and the Swedish Natural Science Research Council (NFR). This research has made use of the Simbad database, operated at CDS, Strasbourg, FranceReferences
- (1) Alcock C., Allsman R. A., Alves D., et al. 1997, ApJ 486, 697
- (2) Ali B., DePoy D. L. 1995, AJ 109, 709
- (3) Anthony-Twarog B. J. 1982, AJ 87, 1213
- (4) Bahcall J. N., Soneira R. M. 1980, ApJS 44, 73
- (5) Bahcall J. N., Flynn C., Gould A. 1992, ApJ 389, 234
- (6) Bally J., Langer W. D., Liu W. 1991, ApJ 383, 645
- (7) Barsony M., Kenyon S. J., Lada E. A., Teuben P. J. 1997, ApJS 112, 109
- (8) Bergeron P., Ruiz M. T., Leggett S. K. 1997, ApJS 108, 339
- (9) Crézé M., Chereul E., Bienayme O., Pichon C. 1997, in: B. Battrick (ed.), Hipparcos Venice ’97, p. 669, ESA SP-402
- (10) Dickman R. L. 1978, AJ 83, 363
- (11) Dreizler S., Werner K. 1996, A&A 314, 217
- (12) Elias J. H. 1978, ApJ 224, 857
- (13) ESA 1997, The Hipparcos and Tycho Catalogues, ESA SP-1200
- (14) Felten J.E. 1976, ApJ 207, 700
- (15) Festin L. 1997, A&A 322, 455
- (16) Festin L. 1998, A&A 333, 497
- (17) Fukui Y., Mizuno A. 1991, in: E. Falgarone, F. Boulanger, G. Duvert (eds.), Fragmentation of Molecular Clouds and Star Formation: IAU Symp. 147, p. 275
- (18) Gould A., Bahcall J. N., Flynn C. 1996, ApJ 465, 759
- (19) Greene T. P., Young E. T. 1992, ApJ 395, 516
- (20) Hambly N. C., Smartt S. J., Hodgkin S. T. 1997, ApJ 489, L157
- (21) Haywood M., Robin A. C., Crézé M. 1997, A&A 320, 440
- (22) Herbst W., Dickman R. L. 1983, in: A. G. Davis Philip, A. R. Upgren (eds.), The Nearby Stars and the Stellar Luminosity Function: IAU Coll. 76, p. 187
- (23) Hilton J. & Lahulla J. F. 1995, A&AS 113, 325
- (24) Hunt L. K., Migliorini S., Testi L., et al. 1995, AJ, submitted
- (25) Jahreiss H., Wielen R. 1997, in: B. Battrick (ed.), Hipparcos Venice ’97, p. 675, ESA SP-402
- (26) Jarrett T. H. 1992, Ph.D. thesis, Massachusetts Univ., Amherst.
- (27) Jarrett T. H., Dickman R. L., Herbst W. 1994, ApJ 424, 852
- (28) Jarrett T. H. 1995, in: C. G. Tinney (ed.), The bottom of the main sequence -and beyond, Springer, Berlin, p. 187
- (29) Kirkpatrick J. D., McGraw J. T., Hess T. R., Liebert J., McCarthy Jr. D. W. 1994, ApJS 94, 749
- (30) Kroupa P. 1995, ApJ 453, 358
- (31) Kroupa P., Tout C., Gilmore G. 1993, MNRAS 262, 545
- (32) Landolt A. U. 1992, AJ 104, 340
- (33) Liebert J., Dahn C. C., Monet D. G. 1988, ApJ 332, 891
- (34) Loren R. B. 1989, ApJ 338, 902
- (35) Luyten W. J. 1976, The LHS Catalogue, University of Minnesota
- (36) Méra D., Chabrier G., Baraffe I. 1996, ApJ 459, L87
- (37) Mermilliod J. C. 1987, A&AS 71, 119
- (38) Mihalas D. & Binney J. 1981, in: Galactic astronomy: Structure and kinematics /2nd edition/, W. H. Freeman and Co., San Francisco
- (39) Oswalt T. D., Smith J. A., Wood M. A., Hintzen P. 1996, Nat 382, 692
- (40) Reid I. N., Gizis J. E. 1997, AJ 113, 2246
- (41) Ruiz M. T., Takamiya M. Y. 1995, AJ 109, 2817
- (42) Ruiz M. T., Bergeron P., Leggett S. K., Anguita C. 1995, ApJ 455, L159
- (43) Ruiz M. T., Takamiya M. Y., Méndez R., Maza J., Wishnjewsky M. 1993, AJ 106, 2575
- (44) Scalo J. M. 1986, Fund. Cosm. Phys. 11, 1
- (45) Straizys V., Cernis K., Bartasiute S. 1996, Baltic Astronomy 5, 125
- (46) Strom K. M., Kepner J., Strom S. E. 1995, ApJ 438, 813
- (47) Strom K. M., Newton G., Strom S. E., et al. 1989, ApJS 71, 183
- (48) Strom K. M., Strom S. E., Merrill K. M. 1993, ApJ 412, 233
- (49) Tinney C. G. 1993, ApJ 414, 254
- (50) Warren W. H., Hesser J. E. 1978, ApJS 36, 497
- (51) Winkler, H., 1997, MNRAS 287, 481
Appendix A The observed areas