The First Stars and Quasars
ABSTRACT
The first star clusters and quasars resulted directly from the growth of linear density fluctuations in the early Universe. Since they emerged from a well-defined set of initial conditions, the interplay between observational data from the Next Generation Space Telescope (NGST) and theoretical modeling will advance the current understanding of star and quasar formation. The first objects had a substantial impact on the thermal and chemical state of the rest of the Universe as they reionized the intergalactic medium and enriched it with metals.
1. INTRODUCTION
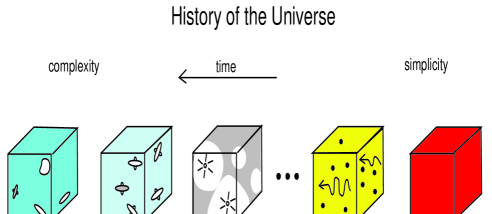
The Universe followed the arrow of time in pedagogical order. It started with the simplest initial state of almost perfect homogeneity and isotropy and ended up with systems as complex as intelligent organisms at present (Fig. 1). So far, standard textbooks are unable to fully follow this pedagogical track because of the lack of observational data about the Universe in the redshift interval . The COBE satellite probed the microwave anisotropies which are remnant from the recombination epoch at (Bennett et al. 1996), and existing telescopes are limited in their range to redshifts . The Next Generation Space Telescope (NGST) will bridge the above gap in our knowledge and image the first sources of light that had formed in the Universe. With its exceptional nJy sensitivity in the 1–3.5m infrared regime, NGST is ideally suited for probing optical-UV emission from sources at redshifts , just when popular Cold Dark Matter models for structure formation predict the first baryonic objects to have collapsed (Fig. 2).
The first sources are a direct consequence of the growth of linear density fluctuations. As such, they emerge from a well-defined set of initial conditions and the physics of their formation can in principle be coded to the form of a precise computer simulation. The cosmic initial conditions for star formation are much simpler and better defined than those in the local interstellar medium; they include a prescription for the primordial power spectrum of Gaussian density fluctuations, the mean temperature and density of the gas, the light element abundances according to Big-Bang nucleosynthesis, and the lack of dynamically-significant magnetic fields.
The initial mass function of the first stars is determined by this set of initial conditions (while subsequent stellar generations are affected by photoionization heating and metal enrichment feedbacks). Although the early evolution of the seed density fluctuations can be fully described analytically, the collapse and fragmentation of nonlinear structure must be simulated numerically. The first baryonic objects connect the simple initial state of the Universe to its complex current state, and their study offers the key to advancing our knowledge on the formation physics of stars and massive black holes.
2. THE REIONIZATION EPOCH
The collapse redshifts of baryonic objects in a standard CDM cosmology is shown in Figure 2. As seen from this figure, more than a tenth of all baryons could have assembled into virialized objects by a redhift . Since nuclear fusion yields MeV per baryon and black hole accretion might provide even more energy, and since hydrogen ionization requires 13.6 eV, it follows that even the collapse of only a negligible fraction () of all baryons into stars or black holes could ionize the rest of the Universe. A detailed calculation of the expected star and quasar populations in the popular -CDM cosmology, implies that the Universe is typically reionized at (Haiman & Loeb 1998a).

Reionization is defined as the time when the volume filling factor of ionized hydrogen (HII) approached a value close to unity. The transition to this state was
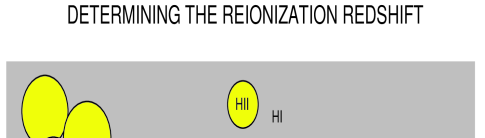
almost sudden, because the ionizing sources were typically separated by a distance which is much smaller than the Hubble length so that the HII regions they had produced overlaped on a timescale much shorter than the Hubble time. Is it possible to identify the reionization redshift, , from the spectrum of high redshift sources? The most distinct feature in the spectrum of a source at would be the Gunn-Peterson absorption trough due to the neutral intergalactic medium that fills the Universe prior to reionization. Figure 3 provides a sketch of the spectrum of a source with which contains some transmitted flux between the Gunn-Peterson troughs due to Ly and Ly absorption. This transmitted flux is suppressed by the residual Ly forest in the post-reionization era. The possibility of identifying from the damping wing of the Gunn-Peterson trough (Miralda-Escudé 1997) suffers from potential confusion with damped Ly absorption along the line of sight and from ambiguities due to peculiar velocities and the proximity effect. An alternative method makes use of the superposition of the spectra of many sources (Haiman & Loeb 1998b). In the absence of the Ly forest this superposition should result in the sawtooth template spectrum shown in Figure 4 [with the horizontal axis redshifted by to the observer’s frame]. The cumulative radiation produced by the first sources might also get reprocessed through intergalactic dust and appear as a diffuse infrared background (Haiman & Loeb 1998a).
The first stars have also enriched the intergalactic medium with metals. The observed disparity (Lu et al. 1998) between the metallicity of the Ly forest () systems and the damped Ly absorbers () indicates that some of the metals are retained within the potential wells in which they are produced. Nevertheless, the nonzero metalicity found in the intergalactic gas implies that winds driven by supernovae, massive stars, gamma-ray bursts (Loeb & Perna 1998), or merger events (Gnedin & Ostriker 1997) expelled some of the enriched gas out of galaxies. A typical Type II supernova releases eV in thermal energy per in metals. The virial temperature of an object of total mass which formed at a redshift is . Hence, gas could be expelled out a potential well only if its metallicity exceeds the minimum value of . Moreover, in order for mixing to occur accross the Hubble velocity difference between star clusters, one needs to supply the gas with a kinetic energy of , where is the average distance between neighboring star clusters. Since objects of mass collect their mass from a radius and since at high redshifts , considerable mixing will occur only if the metallicity inside the objects is increased well above the level of . The early stars are expected to behave as collisionless particles

and eventually populate the halos of present-day massive galaxies. Therefore, direct observations of the abundance patterns in the halo stellar population of the Milky-Way could uncover the early enrichment history of the first star clusters and the intergalactic medium.
3. DETECTION WITH NGST
How many sources will NGST see? Figure 5 shows the predicted number of quasars and star clusters expected per field of view of NGST (Haiman & Loeb 1998b). In this calculation, the star formation efficiency was calibrated based on the inferred metallicity range of the Ly forest (Songaila & Cowie 1996; Tytler et al. 1995) while the characteristic quasar lightcurve was calibrated in Eddington units so as to fit the observed luminosity function of bright quasars at –4. Both populations of sources were extrapolated to high redshifts and low luminosities using the Press-Schechter formalism (for more details, see Haiman & Loeb 1998a). Typically, there are of order tens of sources at redshifts per field of view of NGST. The lack of point source detection in the Hubble Deep Field is consistent with a low-mass cutoff for luminous matter in halos with circular velocities –75, due to photoionization heating (Haiman, Madau, & Loeb 1998). The redshift of early sources can be easily identified photometrically based on their Ly trough. Figure 5 demonstrates that NGST will play a dominant role in exploring the reionization epoch and in bridging between the initial and current states of the Universe.

ACKNOWLEDGEMENTS
I thank my former student, Zoltan Haiman, for educating me on much of the material covered by this review, and Sarah Jaffe for assistance with the artwork. This work was supported in part by the NASA ATP grant NAG5-3085 and the Harvard Milton fund.
REFERENCES
Bennett, C. L. et al. 1996, ApJ, 464, L1 Gnedin, N. Y., & Ostriker, J. P. 1997, ApJ, 486, 581 Haiman, Z., & Loeb, A. 1997, ApJ, 483, 21 ———–. 1998a, ApJ, in press, astro-ph/9710208 ———–. 1998b, ApJ, to be submitted Haiman, Z., Madau, P., & Loeb, A. 1998, ApJ, submitted, astro-ph/9805258 Haiman, Z., Rees, M. J., & Loeb, A. 1997, ApJ, 476, 458 Loeb, A., & Perna, R. 1998, ApJL, in press, astro-ph/9805139 Lu, L., Sargent, W. L. W., Barlow, T. A., & Rauch, M. 1998, AJ, submitted, astro-ph/9802189 Miralda-Escudé J. 1997, ApJ, submitted, astro-ph/9708253 Songaila, A., & Cowie, L. L. 1996, AJ, 112, 335 Tytler, D. et al. 1995, in QSO Absorption Lines, ESO Astroph. Symposia, ed. G. Meylan (Heidelberg: Springer), p. 289