HST and ground-based eclipse observations of V2051 Ophiuchi: Binary parameters††thanks: Based on observations with the NASA/ESA Hubble Space Telescope, obtained at the Space Telescope Science Institute, which is operated by the Association of Universities for Research in Astronomy, Inc., under NASA contract NAS 5-2655, and on observations made at Laboratório Nacional de Astrofísica/CNPq, Brazil..
Abstract
We report on high-speed eclipse photometry of the dwarf nova V2051 Oph while it was in a low brightness state, at mag. In comparison to the average IUE spectra, the ultraviolet continuum and emission lines appear reduced by factors of, respectively, and . Flickering activity is mostly suppressed and the lightcurve shows the eclipse of a compact white dwarf at disc centre which contributes per cent of the total light at 3900–4300 Å.
We use measurements of contact phases in the eclipse lightcurve to derive the binary geometry and to estimate masses and relevant dimensions. We find a mass ratio of and an inclination of degrees. The masses of the component stars are and . Our photometric model predicts km s-1 and km s-1. The predicted value of K1 is in accordance with the velocity amplitude obtained from the emission lines after a correction for asymmetric line emission in the disc is made (Watts et al. 1986).
The secondary of V2051 Oph is significantly more massive than the secondaries of the other ultra-short period dwarf novae. V2051 Oph is probably a relatively young system, whose secondary star had not enough time to evolve out of thermal equilibrium.
keywords:
binaries: close – novae, cataclysmic variables – eclipses – stars: individual: (V2051 Ophiuchi).1 Introduction
Cataclysmic Variables (CVs) are close binary systems in which mass transfer occurs from a late-type star filling its Roche lobe to a companion white dwarf via an accretion disc or column (Warner 1996). The subclass of the dwarf novae comprises systems in which the white dwarf is non-magnetic (B G) and which are mostly known for their recurrent, large amplitude outbursts ( mag, typical duration of 5-10 days). These outbursts reflects a change in the structure of their discs – from a cool, optically thin, low viscosity state to a hot, optically thick, high viscosity state – and which are usually parameterized as a large change in the mass accretion rate ( Ṁ. See, e.g. Pringle, Verbunt & Wade 1986). In quiescence, when the accretion disc is faint, the white dwarf and the bright spot (where the stream of transferred matter hits the edge of the accretion disc) dominate the optical and ultraviolet light from the system, and can be seen as sharp changes in the slope of the lightcurve in eclipsing systems. From the timings of these features, a precise determination of the binary parameters can be obtained.
V2051 Oph is an eclipsing dwarf nova with an orbital period of 90 minutes. High speed photometry by Warner (1983) and Cook & Brunt (1983) shows that the orbital lightcurve is characterized by deep eclipses ( mag) and large amplitude flickering ( per cent), responsible for a variety of eclipse morphologies. Significant ( per cent) brightness changes occur on timescales shorter than the orbital period but no stable orbital hump (associated to anisotropic emission from a bright spot) precedes the eclipse. Unlike most dwarf novae, which usually display an orbital hump with maximum at phase , in V2051 Oph the humps apparently occur at any orbital phase (Berriman, Kenyon & Bailey 1986). The compact source usually seen at disc centre is variable both in brightness and in the duration of its immergence and emergence (from to 80 s), and was interpreted by Warner & Cropper (1983) to be the inner region of the disc and not the white dwarf. Only one relatively short outburst of V2051 Oph has been reported since its discovery, in which it reached mag (Warner & O’Donoghue 1987). The analysis of optical and infrared lightcurves led Berriman et al. (1986) to suggest that the accretion disc in V2051 Oph consists largely of optically thin material, in accordance with the observed color changes during eclipse (Cook & Brunt 1983). V2051 Oph was proposed to be a low field polar system by Warner & O’Donoghue (1987) – a possibility first mentioned by Bond & Wagner (1977) – based on the interpretation of their eclipse maps and on the observation of a 42 s oscillation in the optical during outburst, reminiscent of the rapid oscillations seen in polars. However, in quiescence the emission lines are double peaked and exhibit the classical rotational disturbance effect during eclipse, suggesting the existence of a prograde accretion disc (Cook & Brunt 1983; Watts et al. 1986). Watts et al. (1986) combined the measured value with velocity-dependent eclipse data of the emission lines to derive a dynamical solution for the binary, obtaining , and a radius . They also fit the ultraviolet to optical spectrum with a steady-state optically thick disc model to find Ṁ and a distance to the system between 90 and 150 pc.
V2051 Oph belongs to a small group of ultra-short period eclipsing dwarf nova together with Z Cha, OY Car and HT Cas. Binary parameters for those other systems have been determined with high precision using the method described by Cook & Warner (1984) to derive the mass ratio, inclination and white dwarf radius from the white dwarf and bright spot eclipse phases. In V2051 Oph, the absence of a well defined bright spot and the uncertainty in associating the compact central source with the white dwarf (due to its variability both in width and brightness) has, until now, precluded the use of this method to derive its binary parameters.
In this paper we present and discuss Hubble Space Telescope and ground-based eclipse observations while V2051 Oph was in an occasional low brightness state. The data are described in section 2. In section 3 we use contact phases of the white dwarf and bright spot to develop a purely photometric model for the binary, deriving masses and radii of both stars, the binary inclination and the orbital separation. Section 4 discusses possible systematic effects affecting the derived binary parameters, possible causes for the observed low brightness, the secondary star and the evolutionary stage of V2051 Oph. Our results are summarized in section 5.
2 Observations
2.1 HST/FOS high-speed spectroscopy
The Faint Object Spectrograph (FOS) onboard the Hubble Space Telescope (HST) was used to obtain time-resolved spectroscopy of two consecutive eclipses of the dwarf nova V2051 Oph on 1996 January 29. The observations, summarized in Table 1, consist of two series of exposures in the RAPID readout mode at a time resolution of 3.38 s and a dead-time between exposures of 0.1 s. During data acquisition, the spectrum was shifted electronically by 1/2 of a diode along the 516 diode Digicon array (‘1/2 sub-stepping’) resulting in a 1032-pixel spectrum with a net exposure time of 1.64 s pixel-1. The first run (H1) was carried out using a circular aperture and the G400H grating (spectral resolution Å pixel-1) and covered the egress of the first eclipse. The second run (H2) was performed using a square aperture and the G160L grating ( Å pixel-1) and covered the following eclipse. The spectral range covered by the HST observations is, respectively for the G160L and the G400H data, Å and Å.
The observations were reduced using procedures similar to the standard STSDAS pipeline, and included flat-field and geomagnetically induced motion (‘GIMP’) corrections, background and scattered light subtraction, wavelength and absolute flux calibrations. The absolute photometric accuracy of these observations should be about 4 per cent.
For the G160L observations, the undispersed order-zero light is also recorded on the diode array, providing a broad-band UV-optical photometric measurement that is simultaneous with each of the ultraviolet spectra. The order-zero light has a passband with a FWHM of 1900 Å and a pivot wavelength of 3400 Å. To convert counts to flux densities we used the predicted post-COSTAR response of 950 counts s-1 mJy-1 of Eracleous & Horne (1994), which has un uncertainty of 50 per cent.
| date | run | Start | No. of | Spectral | Phase range | Instrument | |
|---|---|---|---|---|---|---|---|
| (1996) | (UT) | (s) | exposures | range | (cycles) | ||
| Jan 29 | H1 | 19:03 | 3.38 | 113 | 3226-4781 Å | HST/FOS/BL | |
| Jan 29 | H2 | 20:24 | 3.38 | 693 | 1150-2507 Å | HST/FOS/BL | |
| Jun 15 | L1 | 22:21 | 5.0 | 547 | B-band | FOTRAP | |
| Jun 16 | L2 | 22:24 | 5.0 | 398 | white light | FOTRAP | |
| Jun 16 | L3 | 23:45 | 5.0 | 516 | white light | FOTRAP | |
| Jun 17 | L4 | 22:19 | 5.0 | 432 | white light | FOTRAP |
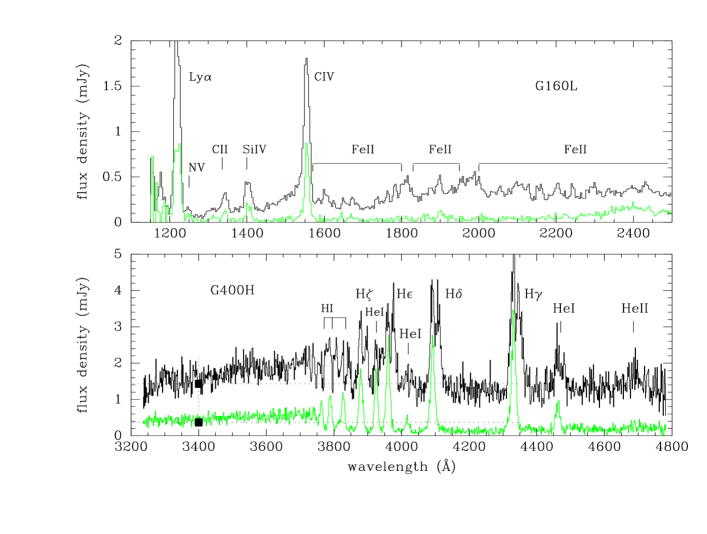
Average out-of-eclipse and mid-eclipse spectra of the G160L data are shown in the upper panel of Fig. 1. The most prominent lines and bands are labeled. The comparison of the G160L out-of-eclipse spectrum with the average IUE spectrum of Watts et al. (1986) reveals that V2051 Oph was considerably fainter than usual at the time of the HST observations. The flux in the continuum and the emission lines have been reduced by factors of, respectively, and . The lower panel of Fig 1 shows average out-of-eclipse and mid-eclipse spectra of the G400H data. The G160L order-zero passband overlaps the spectral coverage of the G400H data. Filled squares show the fluxes of the G160L order zero light computed at the same orbital phase ranges as the G400H average spectra. This comparison indicates that V2051 Oph remained at roughly the same brightness level during the HST observations.
2.2 high-speed photometry
High-speed photometry of V2051 Oph was obtained with the 1.6 m telescope of Laboratório Nacional de Astrofísica (LNA/CNPq), in southern Brazil, on 1996 June 15-17. Four eclipses were collected, one in the B-band and the remaining in white light (W). These observations are detailed in Table 1.
The observations were performed with the one-channel FOTRAP photometer in its single-filter mode at a time resolution of 5 s, using a 11.3” diaphragm. A Hamamatsu R943-02 PMT was employed. Sky measurements were taken at intervals of 15-20 min at a position 20” to the north of the variable, except during eclipse. The sky measurements were fitted by a low-order polynomial and then subtracted from the raw data. A close comparison star was also regularly observed to check for the presence of clouds and sky transparency variations. From these observations, we confirmed that all 4 runs were performed under good sky conditions. Coefficients of extinction and of transformation to the UBVRI standard system were derived from observations of E-regions stars of Graham (1982) and blue spectrophotometric standards of Stone & Baldwin (1983). The reader is referred to Jablonski et al. (1994) for a detailed study of the reliability of the transformations from FOTRAP’s natural to the standard UBVRI system, in particular for objects of peculiar spectra such as CVs. We used the relation of Lamla (1981), , to transform magnitudes to flux density units. The absolute calibration of the B-band observations is accurate to better than 4 per cent.
2.3 New eclipse timings
Mid-eclipse times of V2051 Oph were measured by employing the bissected chord method and by computing the mid-point of the phases of maximum and minimum derivative in the lightcurves (section 3). These methods yield values which are consistent with each other under the uncertainties, and therefore we adopted the mean as the mid-eclipse time. The new heliocentric (HJD) as well as baricentric (BJED) timings of V2051 Oph are listed in Table 2 with corresponding cycle number and uncertainties (quoted in parenthesis). Also shown are the (O–C) values with respect to the revised linear ephemeris of Baptista, Tripplet & Bond (1998),
| (1) |
The measured (O–C) values are in accordance with the cyclical variations in the orbital period of V2051 Oph observed by Baptista, Tripplet & Bond (1998).
| Cycle | HJD | BJED | (OC) 111Observed minus calculated times with respect to the ephemeris of eq.1. |
|---|---|---|---|
| (2,450,000+) | (2,450,000+) | (cycles) | |
| 109 988 | 112.29277 | 112.29273(4) | |
| 109 989 | 112.35517 | 112.35513(4) | |
| 112 201 | 250.44558 | 250.44555(2) | |
| 112 217 | 251.44443 | 251.44440(1) | |
| 112 218 | 251.50688 | 251.50685(1) | |
| 112 233 | 252.44331 | 252.44328(2) |
2.4 Eclipse lightcurves
We adopted the following convention regarding the phases: conjunction occurs at phase zero, the phases are negative before conjunction and positive afterwards. The lightcurves were phased according to the linear ephemeris of eq. 1. A phase correction of +0.0087 cycles was further applied to the data to make the centre of the white dwarf eclipse coincident with phase zero (see section 3).
V2051 Oph was particularly faint at the time of both the HST and the ground-based observations. From the B-band lightcurve, we estimate a magnitude of mag, while the G400H data yield 16.2 mag. This is considerably fainter than the mag range previously reported in the literature (Warner & Cropper 1983; Cook & Brunt 1983; Wenzel 1984; Berriman et al. 1986; and Watts et al. 1986). We will thereafter refer to this as the ‘low’ or ‘minimum’ brightness state of V2051 Oph to differentiate it from the normal, quiescent state. Thus, our data yield a rare (and lucky) opportunity to cleanly see the white dwarf and bright spot in V2051 Oph, with reduced contributions from the accretion disc and boundary layer to the total light.
Figure 2 shows HST lightcurves at selected passbands, wavelength range increasing upwards. The eclipse shape is reminiscent of those of the dwarf novae OY Car and Z Cha in quiescence (e.g., Wood et al. 1986, 1989), with two compact sources being eclipsed in sequence. Sharp steps corresponding to the egress of the white dwarf and bright spot are clearly seen in the G400H lightcurves. A substantial fraction of the emitted light comes from the white dwarf, which contributes per cent of the total light at 3900–4300 Å. The G160L order zero lightcurve shows the sequence of ingress of two compact sources. The phases of ingress of the first eclipsed source are coincident with those of the white dwarf as estimated from the ground-based data (Fig 3). Hence, we can unambiguously associate the first compact source with the white dwarf and, therefore, the source which is eclipsed later is the bright spot. Egress features of both sources can also be easily identified in the order zero lightcurve. The flux of the bright spot is larger at ingress than at egress. This is consistent with the overall decrease in brightness along the run and is usually understood in terms of anisotropic emission due to the foreshortening of a spot ‘painted’ at the edge of an optically thick accretion disc. White dwarf and bright spot features are less well defined in the other, lower signal-to-noise ratio G160L lightcurves. Flickering activity – usually higher in the ultraviolet than at optical wavelengths in CVs – is considerably less impressive than observed in quiescence (e.g, Warner & O’Donoghue 1987), probably reflecting the lower brightness state of the system at the epoch of our observations.
The HST dataset gives a clear and simultaneous measurement of the white dwarf and bright spot eclipse phases, which will allow us to estimate the binary mass ratio in section 3.
Figure 3 display the ground-based observations. These lightcurves clearly show the total eclipse of a compact source at disc centre, the white dwarf, and reveal that the white dwarf contributes 80–90 per cent of the light at that epoch, with very little evidence of an accretion disc or bright spot. Flickering activity is mostly suppressed, which is possibly an indication that mass transfer was substantially reduced at that epoch. The duration of the ingress/egress feature ( s or 0.006 cycles, see section 3) is shorter than that in quiescence (Warner & Cropper 1983; Berriman et al. 1986; Watts et al. 1986) by a factor of two, possibly an indication that, at those epochs, one was seeing a bright (and larger) boundary layer around the white dwarf instead of the white dwarf itself. This possibility was previously mentioned by Warner & Cropper (1983).
The ground-based dataset yields an unambiguous measurement of the total width of the eclipse of the white dwarf as well as of the duration of its ingress/egress feature and will be crucial for our derivation of the binary parameters in section 3.
3 The binary parameters
In this section we use measurements of the contact phases of the white dwarf and of the bright spot to develop a model for the binary in V2051 Oph based solely on quantities obtained from the photometry.
3.1 Measuring contact phases
The ingress/egress phases of the occultation of the white dwarf (hereafter WD) and of the bright spot (BS) by the secondary star provide information about the geometry of the binary system and the relative sizes of these components (Wood et al. 1986, 1989). The contact phases can be identified as rapid changes in the slope of the lightcurve, visible in the lightcurves shown in Figs. 2 and 3. We follow the notation of Baptista et al. (1989), taking as those phases during which WD disappears behind the secondary star and as the phases corresponding to the reappearance of WD from eclipse. We similarly define a set of phases for BS.
The contact phases were measured with the aid of a cursor on a graphic display of a median filtered version of the lightcurve. The estimated error for this procedure is 0.0006 cycles. Mid-ingress (egress) phases for WD and BS ( and ) were computed as the mid point of the ingress (egress) feature and also as the phase at which half of the compact source light is eclipsed.
We also employed the technique described by Wood, Irwin & Pringle (1985) to measure the contact points and to estimate the phases of mid-ingress (egress), here defined as the points of minimum (maximum) derivative in the lightcurve. Figure 4 illustrates the procedure for the G160L order zero lightcurve. The original lightcurve [Fig. 4(a)] is smoothed with a median filter of width 0.0019 cycles (3 data points) [Fig. 4(b)] and its numerical derivative is calculated. The amount of filtering used at this point is a compromise between the aim to suppress noise in the lightcurve as much as possible and the need to preserve any real structures in the eclipse shape. The ingress/egress of WD and BS can be seen as those intervals for which the derivative curve is significantly different from zero. The width at half-peak intensity of these features yields a preliminary estimate of their duration. A spline function is fitted to the remaining regions in the derivative curve to remove the contribution from the extended and slowly varying eclipse of the disc. The spline-subtracted derivative curve [Fig. 4(c)] is then analyzed by an algorithm which identifies the points of extrema (the mid-ingress / egress phases) and the points where the derivative starts to depart from the zero-constant level (the contact points). A median filter of equal width to that used in the first part of the reduction is applied to the derivative curve to aid in the detection. A similar sequence is used to measure the contact points and mid phases of BS.
Table 3 collects the measured contact phases, mid-ingress and mid-egress phases of WD. Quoted values are the average of the determinations from all methods described above. Uncertain measurements are marked by a colon. Fig. 5 depicts the median contact phases of WD listed in Table 3 in an enlarged view of the combined W+B lightcurve and its derivative curve.
| run | spectral range | ||||||
| H1 | 3236-3600 Å | – | – | +0.0312 | +0.0369 | – | +0.0339 |
| 3900-4300 Å | – | – | +0.0303 | +0.0365 | – | +0.0335 | |
| 4400-4781 Å | – | – | +0.0309 | +0.0363 | – | +0.0337 | |
| 3236-4781 Å | – | – | +0.0306 | +0.0361 | – | +0.0337 | |
| H2 | 1400-1800 Å | : | +0.0285 | +0.0347 | +0.0331 | ||
| 1802-2303 Å | +0.0279 | +0.0361 | +0.0325 | ||||
| 1152-2506 Å | +0.0280 | +0.0341 | +0.0334 | ||||
| order zero | +0.0305 | +0.0355 | +0.0330 | ||||
| L1 | B | +0.0307 | +0.0367 | +0.0332 | |||
| L2 | W | +0.0308 | +0.0369 | +0.0336 | |||
| L3 | W | +0.0302 | +0.0367 | +0.0334 | |||
| L4 | W | +0.0304 | +0.0369 | +0.0332 | |||
| combined W+B | +0.0306 | +0.0372 | +0.0334 | ||||
| median | +0.0304 | +0.0364 | +0.0334 | ||||
| error |
Integrating the flux in the derivative curve Fig. 4(c) between the first and second (third and fourth) contact phases we obtain estimates of the WD flux at ingress (egress). The lightcurve of the WD is then reconstructed by assuming that the flux is zero between ingress and egress and that it is constant outside eclipse. The reconstructed WD lightcurve can be seen in Fig. 4(d), and the lightcurve after removal of the WD component is shown in Fig. 4(e).
For the HST order zero lightcurve (fig. 4), the estimated WD flux at ingress is mJy, larger than the flux of mJy obtained from the egress feature. This could be due to a phase dependent absorption of the WD light, the absorption being more pronounced at egress phases. The analysis of Catalán et al. (1998) suggests that the WD in V2051 Oph is veiled by a large number of blended Fe II lines (the so called Fe II curtain). This effect is reminiscent of that observed previously in OY Car (Horne et al. 1994) and has been attributed to absorption by circumstellar material, possibly in the outer disc. The observed difference in WD flux at ingress and at egress could be associated with this effect if the absorption by the Fe II curtain is more pronounced along the line of sight at egress phases. This seems to be the case in the novalike UX UMa, whose ultraviolet eclipse mapping reveals that the absorption by the Fe II curtain in the disc side closest to the secondary star is more pronounced in the leading quadrant than in the trailing quadrant (which contains the bright spot and gas stream) and that this effect is probably responsible for a substantial reduction in flux level from before to after eclipse (Baptista et al. 1998b).
Measured BS contact phases, mid-ingress and mid-egress phases are listed in Table 4. As before, quoted values are the average of the determinations from all methods described above. For run H2, only values for the order zero lightcurve are listed since the lightcurves at the other passbands (Fig. 2) do not yield reliable measurements of BS phases. The ingress phases , and were measured from the WD subtrated lightcurve (Fig. 4(e)), which provides an unblended, clean view of the BS ingress feature. The short run H1 gives only the egress phase of the BS, which occurs perceptibly earlier than at run H2. Warner & Cropper (1983) and Warner & O’Donoghue (1987) have shown that the eclipse shape of V2051 Oph (and therefore its disc structure) is very variable and that significant changes occur on the timescale of one orbit. One expects that similar changes in disc radius and BS position do occur in the same timescale. We have thus been cautious not to combine egress phases from different cycles and, therefore, for our procedure to determine the mass ratio (section 3.2) we will use only the pair of mid-ingress/egress phases of BS measured from run H2. The measurements of mid-ingress/egress phases from the three different methods have dispersions of 0.0005 cycles. However, since only one light curve was used to estimate these values, we adopted more conservative error bars of 0.001 cycles for the mid-ingress phase and 0.002 cycles for the mid-egress phase.
| run | spectral range | ||||||
| H1 | 3236-3600 | – | – | +0.0811 | +0.0855 | – | +0.0831 |
| 3900-4300 | – | – | +0.0804 | +0.0848 | – | +0.0822 | |
| 4400-4781 | – | – | +0.0811 | +0.0836 | – | +0.0825 | |
| 3236-4781 | – | – | +0.0809 | +0.0831 | – | +0.0821 | |
| H2 | order zero | +0.0841 | +0.0892 | +0.0866 |
The duration of the WD eclipse is defined as
| (2) |
and the centre of the WD eclipse (the inferior conjunction of the binary) is written as
| (3) |
These quantities are collected in Table 5. The median of the measurements from all lightcurves yields cycles, where the quoted error is the median of the absolute deviations with respect to the median. Similarly, we have cycles, which indicates that the centre of the WD eclipse corresponds to phase zero.
The difference between the first and second (third and fourth) WD contact phases yield the phase width of the WD ingress (egress), (). These quantities are also listed in Table 5. A median from all values of and yields cycles, where again the error is the median of the absolute deviations with respect to the median.
| run | spectral range | ||||
| H1 | 3236-3600 | 0.0057 | |||
| 3900-4300 | 0.0062 | ||||
| 4400-4781 | 0.0054 | ||||
| 3236-4781 | 0.0056 | ||||
| H2 | 1400-1800 | 0.0663 | 0.0032: | 0.0062 | |
| 1802-2303 | 0.0655 | 0.0063 | 0.0082 | ||
| 901-2506 | 0.0662 | +0.0003 | 0.0056 | 0.0061 | |
| order zero | 0.0664 | 0.0057 | 0.0050 | ||
| L1 | B | 0.0664 | +0.0000 | 0.0065 | 0.0060 |
| L2 | W | 0.0658 | +0.0007 | 0.0074 | 0.0061 |
| L3 | W | 0.0667 | +0.0000 | 0.0056 | 0.0065 |
| L4 | W | 0.0660 | +0.0002 | 0.0051 | 0.0065 |
| combined W+B | 0.0662 | +0.0003 | 0.0057 | 0.0066 | |
| median | 0.0662 | +0.0000 | 0.0057 | 0.0061 | |
| error |
3.2 Mass ratio, inclination and disc radius
Making the usual assumption that the secondary star fills its Roche lobe and given the duration of the eclipse of the central parts of the disc, , there is a unique relation between the mass ratio and the binary inclination (Bailey 1979; Horne 1985). From Table 5, the width of the eclipse in V2051 Oph is . This gives the constraint , with if .
When combined with the measured contact phases of the WD and BS, this relation gives a unique solution for , , and , where is the distance from disc centre to the BS (usually taken to be the disc radius) and is the distance from disc centre to the inner lagrangian point L1. The following assumptions are made: (i) the infalling gas stream leaving the L1 point describes a balistic trajectory in the primary lobe (Lubow & Shu 1975), and (ii) the bright spot is located at the position at which the stream hits the edge of the disc. The theoretical trajectories described by a test particle in the primary lobe are solely determined by the mass ratio of the binary. For increasing values the trajectories are closer to the line joining both stars, as the angular momentum of the infalling gas stream after leaving the L1 point is progressively smaller. The correct mass ratio, and hence inclination, are those for which the calculated stream trajectory passes through the observed position of the bright spot. This method was first developed by Smak (1971) and has since then been applied to various CVs (e.g., Fabian et al. 1978; Cook & Warner 1984; Wood et al. 1986, 1989; Baptista, Steiner & Cieslinski 1994).
Figure 6 illustrates the determination of , and from the eclipse phases. Fig. 6(a) shows a diagram of ingress versus egress phases for the measurements of the WD and BS in Tables 3 and 4. Measurements of the WD ingress and egress are shown as the cluster of small crosses around phases () in the lower portion of the diagram. The small box in the upper left corner marks the 1- range of the mid-ingress and mid-egress phases of the BS. Theoretical gas stream trajectories corresponding to a set of pairs are also shown. The trajectories were computed by solving the equations of motion in a coordinate system synchronously rotating with the binary, using a 4th order Runge-Kutta algorithm (Press et al. 1986) and conserving the Jacobi integral constant to one part in .
The theoretical trajectory that passes through the position of the BS has and , where the uncertainties are taken from the standard deviation of the points about the trajectory of best fit. Fig. 6(b) shows the geometry of the binary system for . For this mass ratio, the relative size of the primary Roche lobe is , where is the orbital separation.
The squashed circle in Fig. 6(a) represents the accretion disc whose edge passes through the position of BS for the adopted mass ratio. This corresponds to a disc radius of . A circle with this radius is depicted in Fig. 6(b). The calculated radius is half way between the radius expected for zero-viscosity discs, (Flannery 1975), and that expected for pressureless discs, (Paczyński 1977).
3.3 Masses and radii of the component stars
The duration of the ingress / egress of WD yields an estimate of the relative size of the white dwarf. This information can be used together with the calculated mass ratio to constraint the masses and radii of the component stars. We use the approximate relations of Ritter (1980),
| (4) |
and
| (5) |
where and are the radii of the WD and of the secondary star, and is the relative distance from disc centre to the point tangent to the surface of the secondary that marks the beginning/end of the eclipse of WD (Baptista et al. 1989). The value of is a by-product of the inclination-determination routine (section 3.2) and is usually close to unity. In our case, for we have . The error introduced by the use of these expressions is of order of and for the parameters listed in Table 3 is smaller than 0.5 per cent.
Combining Eq. (4) with Kepler’s third law we can write an expression relating the mass and the radius of the white dwarf for V2051 Oph,
| (6) |
where is the Chandrasekhar mass limit and . Another relation between and can be obtained from Nauenberg’s (1972) analytical approximation to the mass-radius relation for cool degenerate white dwarfs of Hamada & Salpeter (1961),
| (7) |
Combining Eqs. (6) and (7) one can solve for and the remaining system parameters.
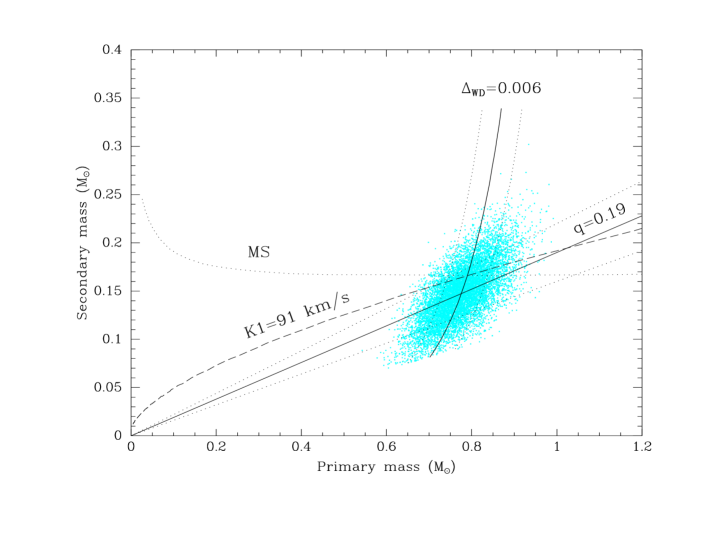
The primary-secondary mass diagram for V2051 Oph can be seen in Fig. 7. A Monte Carlo propagation code was used to estimate the errors in the calculated parameters. The values of the input parameters and are independently varied according to Gaussian distributions with standard deviation equal to the corresponding uncertainties. The results, together with their 1- errors, are listed in Table 6. The cloud of points in Fig. 7 was obtained from a set of trials using this code. The highest concentration of points indicates the region of most probable solutions.
| /R⊙ | |||
| R | |||
| M1/M⊙ | Rbs/RL1 | ||
| R1/R⊙ | |||
| M2/M⊙ | K1 (km/s) | ||
| R2/R⊙ | K2 (km/s) |
4 Discussion
4.1 The reliability of the photometric model
Our photometric model is based on the inferred and values. Here we discuss systematic errors which may affect these quantities and their influence on the derived parameters of V2051 Oph, and compare the derived parameters with those obtained by other authors.
Errors in are related to errors in measuring mid-ingress/egress phases, in particular the BS phases. WD eclipse phases were precisely measured in the ground-based lightcurves, where the BS and the accretion disc give negligible contribution to the total light. These phases helped us to identify the WD eclipse features in run H2 without ambiguities. The lightcurve after the subtraction of the WD contribution (fig. 4(d)) clearly shows the asymmetric eclipse of the compact BS and yielded accurate measurements of its mid-ingress/egress phases. The measured BS phases map into a small region in the ingress/egress phases diagram from which a precise value of was obtained. Therefore, the mass ratio seems well constrained.
The remaining binary parameters were derived under the assumption that the duration of the ingress/egress of the central object, , gives a direct measure of the radius of the white dwarf. This supposition may not always be correct.
It may be possible that the observed compact object of Fig. 5 is a hot and opaque boundary layer involving the white dwarf, in which case the true white dwarf would be smaller than assumed (Wood & Crawford 1986). In this case, the primary mass found is a lower limit. However, notice that increasing the white dwarf mass along the line in Fig 7 results in a secondary star which is overmassive in comparison to a main sequence star of same radius. This would be in marked contrast with the other short-period eclipsing CVs, where the results seem to point in the opposite direction, i.e., secondary stars which are undermassive in comparison to main sequence stars of same radius (Wood et al. 1986, 1989; Horne, Wood & Stiening 1991). Other effects that may result in an overestimated white dwarf radius include the questionable application of a mass-radius relation for cool white dwarfs to a relatively hot object (Horne, Wood & Stiening 1991), and a possible spherical distortion for a white dwarf rotating close to breakup velocity (Wood & Horne 1990). However, the corrections in the derived parameters implied by these effects ( per cent) are smaller than the uncertainty in the value of and were not taken into consideration.
Alternatively, could the white dwarf be larger than inferred from our value of ? We now address two possibilities in this regard.
Previous eclipse photometry of V2051 Oph indicate a duration of the ingress/egress of the compact central source of (Warner & Cropper 1983; Cook & Brunt 1983; Watts et al. 1986), substantially larger than measured from our observations. However, the variability and the clear correlation between brightness and duration of ingress/egress of this source led Warner & Cropper (1983) to suggest that it might be a bright (and variable) boundary layer around the white dwarf and not the white dwarf itself. This scenario is supported by our observations at minimum light, when mass accretion has probably been substantially reduced and the boundary layer has accordingly dimmed, leaving a bare, fainter, and much smaller white dwarf as the only light source at disc centre.
Warner & O’Donoghue (1987) suggested that V2051 Oph could be a low field polar. Following their suggestion, we explored the possibility that the observed compact source at disc centre is in fact a bright spot at the surface of the white dwarf, corresponding to the pole of an accretion column. If the white dwarf rotates synchronously with the binary, one would expect the lightcurves to show a strong orbital modulation due to the self occultation of the accretion column. For example, at phase about half of the accretion column would have disappeared behind the white dwarf resulting in a reduction of per cent in flux of the lightcurve. On the other hand, if the white dwarf is non synchronously rotating, one would expect to see two conspicuous effects in the lightcurves: (1) large amplitude ( per cent) pulsations with the rotation period of the white dwarf, and (2) measurable wanderings of the ingress/egress phases and eclipse width of the compact source at disc centre as the accretion column is seen at different aspects. Our observations clearly exclude both possibilities: there is no sign of strong orbital modulation, no sign of pulsations, and no detected changes in eclipse phases. Therefore, we are left with the conclusion that the compact source at disc centre of our observations is indeed the white dwarf.
It is worth mentioning that our observations do not discard the possibility that V2051 Oph possess a magnetic white dwarf. If the observed minimum brightness state corresponds to a phase of reduced mass transfer and negligible or no mass accretion, then no emission would be produced in the accretion column, which could therefore remain undetected.
We now turn to the comparison of our derived parameters with those obtained by Watts et al. (1986). Their dynamical model of V2051 Oph is based on spectroscopy of the accretion disc’s emission lines. Radial velocity for the H and H lines yields a and a phase lag of cycles with respect to the photometric phase. Phase lags of cycles between photometric and spectroscopic conjunction are seen in many of the CVs for which emission lines radial velocity curves were measured. Asymmetries in the line intensity distribution (which displace the light centroid from disc centre) or the existence of a non-circular component to the velocity of the emitting gas (as it may happen in the presence of a disc wind) lead to systematic errors in the amplitude and phase of the measured . They show that the observed phase lag of V2051 Oph can be explained if the accretion disc is asymmetric in the emission lines, with the trailing lune being per cent brighter than the leading lune. The measured will be overestimated by per cent in this case. The correction of their value by this effect eliminates the phase lag and brings their measurement to , into good accordance to our prediction in Table 3.
Watts et al. (1986) used the double peaked Balmer line profiles and their behaviour during eclipse to constrain the mass ratio of the binary. Their model predicts a larger mass ratio () and a much smaller white dwarf mass () than ours. We note that their fit to the line behaviour during eclipse seems of rather poor quality. The larger spectroscopic mass ratio predicts that the bright spot eclipse occurs earlier than observed, with a phase difference at the 2- level. The spectroscopic model also predicts a duration of the ingress and egress of the white dwarf of , which clearly conflicts with the observed duration of .
It would be useful to have another observational constraint on the binary parameters. The best way of checking the reliability of the above assumptions in calculating binary parameters is to measure the radial velocity of the secondary star, .
4.2 The low brightness state: reduced mass transfer rate?
At the time of our observations V2051 Oph was in a much lower brightness state than at quiescence, when it has mag. Since it was observed to be in this lower brightness state both in 1996 January and in 1996 June, it may be possible that this is a relatively prolonged minimum state of duration a few months. Recovery of photometric observations of V2051 Oph during this period would be important to clarify this point.
The system has been observed to go into outburst once, where it increased in brightness to reach (Warner & O’Donoghue 1987). If the outburst is caused by the disc instability mechanism, than the disc is already in a state of low viscosity, low mass accretion rate when the system is at mag. Therefore, it is hard to explain the observed low brightness state in terms of disc instability. The simplest way to understand the reduced brightness level of V2051 Oph is to consider it the consequence of a significant reduction in the mass transfer rate.
4.3 The secondary star mass and its evolutionary consequences
Our photometric model indicates that V2051 Oph has a larger mass ratio and a more massive white dwarf than the other eclipsing dwarf novae of similar period. Probably more relevant, it has a secondary star which is significantly more massive than those of Z Cha, OY Car and HT Cas. Since the inferred size of the secondary in these systems is similar, , this means that the secondary star of V2051 oph obeys a mass-radius relationship which predicts significantly denser stars for a given mass.
Theoretical evolutionary models of CVs predict that the long term, continuous mass loss brings the secondary stars out of thermal equilibrium and make these stars larger than a main sequence star of same mass (Rappaport, Joss & Webbink 1982). Hence, the fact that the secondary stars in Z Cha, OY Car and HT Cas are oversized in comparison to main sequence stars of same mass suggests that these systems are relatively old cataclysmic variables, for which mass transfer (and loss from the secondary) has been occurring for some years. On the other hand, the fact that the secondary star of V2051 Oph obeys a typical main sequence mass-radius relationship suggests that V2051 Oph is a relatively young system, for which mass loss has not occurred for long enough time to bring the secondary star out of thermal equilibrium. Further support to this suggestion comes from the following argument. If we assume that CVs evolve by loosing mass in recurrent nova outbursts (at a rate of at every years), than V2051 Oph will need about years to reduce its total mass of about to the typical total mass of of the other, older dwarf novae of similar orbital period.
5 Conclusions
The analysis of HST/FOS and ground-based eclipse observations of the dwarf novae V2051 Oph yielded the following results:
-
1.
V2051 Oph was observed in a low brightness state, at mag. In comparison to the average IUE spectra, the ultraviolet continuum and emission lines appear reduced by factors of, respectively, and . Flickering activity is mostly suppressed and the lightcurve shows the eclipse of a compact white dwarf at disc centre which contributes per cent of the total light at 3900–4300 Å. In 1996 January, the bright spot is clearly seen in the lightcurve, allowing a precise measurement of its eclipse phases. In 1996 June only the white dwarf is seen in the lightcurve and its radius can be estimated from accurate measurement of the width of its ingress/egress. It is suggested that this state is the consequence of a substantial reduction in mass transfer rate.
-
2.
We developed a purely photometric model for the binary from the eclipse phases of the white dwarf and bright spot. For the gas stream trajectory to pass through the position of the bright spot a mass ratio is required. The corresponding inclination is .
-
3.
The duration of the ingress/egress of the white dwarf combined with the Hamada-Salpeter mass-radius relationship and the obtained mass ratio give and . Calculated parameters are summarized in Table 6.
-
4.
The secondary of V2051 Oph is significantly more massive than the secondaries of the other ultra-short period dwarf novae and seems to obey a ZAMS mass-radius relationship. V2051 Oph is probably a relatively young system, whose secondary star had not enough time to evolve out of thermal equilibrium.
-
5.
Our photometric model predicts km s-1, which is in accordance with the velocity amplitude obtained from the emission lines after a correction for asymmetric line emission in the disc is made (Watts et al. 1986).
Acknowledgments
We thank Andrew King and an anonymous referee for valuable comments and suggestions on an earlier version of the manuscript. RB acknowledges financial support from CNPq/Brazil through grant no. 300 354/96-7.
References
- [1] Bailey J., 1979, MNRAS, 187, 645
- [2] Baptista R., Jablonski F.J., Steiner J.E., 1989, MNRAS, 241, 631
- [3] Baptista R., Steiner J. E., Cieslinski D., 1994, ApJ, 433, 332
- [4] Baptista R., Tripplet L., Bond H., 1998a, in preparation
- [5] Baptista R., Horne K., Wade R., Hubeny I., Long K., Rutten R.G.M., 1998b, MNRAS, in press
- [6] Berriman G., Kenyon S., Bailey J., 1986, MNRAS, 222, 871
- [7] Bond H., Wagner R.L., 1977, IAU Circular 3049
- [8] Bruch A., 1983, IBVS, 2287
- [9] Catalán M.S., Horne K., Cheng F.-H., Marsh T., Hubeny I., 1998, preprint
- [10] Cook M.C., Brunt C.C., 1983, MNRAS, 205, 465
- [11] Cook M.C., Warner B., 1984, MNRAS, 207, 705
- [12] Eracleous M., Horne K., 1994, ApJ, 433, 313
- [13] Fabian A.C., Lin D.N.C., Papaloizou J., Pringle J.E., Whelan J.A.J., 1978, MNRAS, 184, 835
- [14] Flannery B.P., 1975, MNRAS, 170, 325
- [15] Hamada T., Salpeter E.E., 1961, ApJ, 134, 683
- [16] Horne K., 1985, MNRAS, 213, 129
- [17] Horne K., Marsh T.R., Cheng F.-H., Hubeny I., Lanz T., 1994, ApJ, 426, 294
- [18] Horne K., Wood J.H., Stiening R.F., 1991, ApJ, 378, 271
- [19] Graham J.A., 1982, PASP, 94, 244
- [20] Jablonski F.J., Baptista R., Barroso Jr. J., Gneiding C., Rodrigues F., Campos R.P., 1994, PASP, 106, 1172
- [21] Lamla E., 1981, Landolt-Börnstein - Numerical Data and Functional Relationships in Science and Technology, Vol. 2, eds. K. Schaifers & H.H. Voigt, Springer-Verlag
- [22] Lubow S.H., Shu F.H., 1975, ApJ, 198, 383
- [23] Nauenberg M., 1972, ApJ, 175, 417
- [24] Paczyński B., 1977, ApJ, 216, 822
- [25] Press W.H., Flannery B.P., Teukolsky S.A., Vetterling W.T., 1986, Numerical Recipes, Cambridge University Press
- [26] Pringle J. E., Verbunt F., Wade R. A., 1986, MNRAS, 221, 169
- [27] Rappaport S., Joss P.C., Webbink R.F., 1982, ApJ, 254, 616
- [28] Robinson E.R., 1992, Viña del Mar Workshop on Cataclysmic Variable Stars, ASP Conference Series Vol. 29, Ed. N. Vogt, Astron. Soc. Pac., San Francisco, p.3
- [29] Ritter H., 1980, A&A, 86, 204
- [30] Sanduleak N., 1972, IBVS, 663
- [31] Smak J., 1971, Acta Astr., 21, 15
- [32] Stone R.P.S., Baldwin J.A., 1983, MNRAS, 204, 347
- [33] Vogt N., 1983, A&AS, 53, 21
- [34] Warner B., 1996, Cataclysmic Variable Stars, Cambridge Astrophysics Series 28, Cambridge University Press
- [35] Warner B., Cropper M., 1983, MNRAS, 203, 909
- [36] Warner B., O’Donoghue D., 1987, MNRAS, 224, 733
- [37] Watts D.J., Bailey J., Hill P.W., Greenhill J.G., McCowage C., Carty T., 1986, A&A, 154, 197
- [38] Wenzel, W., 1984, IBVS, 2481
- [39] Wood J.H., Crawford C.S., 1986, MNRAS, 222, 645
- [40] Wood J.H., Horne K., Berriman G., Wade R., O’Donoghue D., Warner B., 1986, MNRAS, 219, 629
- [41] Wood J.H., Horne K., Berriman G., Wade R., 1989, ApJ, 341, 974
- [42] Wood J.H., Horne K., 1990, MNRAS, 242, 609
- [43] Wood J.H., Irwin M.J., Pringle J.E., 1985, MNRAS, 214, 475