First measurement of the submillimetre
Sunyaev-Zel’dovich effect
Abstract
We report the first detection of the Sunyaev-Zel’dovich increment on the cosmic microwave background (CMB) at submillimetre wavelengths in the direction of a cluster of galaxies. It was achieved towards the rich cluster Abell 2163, using the PRONAOS 2-metre stratospheric telescope. Together with data from the SuZIE, Diabolo, and ISO-PHT experiments, these measurements, for the first time, give a complete picture of the far-infrared to millimetre spectral energy distribution of the diffuse emission toward a cluster of galaxies. It clearly shows the positive and negative parts of the S.Z. effect and also a positive signal at short wavelengths that can be attributed to foreground dust in our galaxy.
1 Introduction
The Sunyaev-Zel’dovich effect (Sunyaev and Zel’dovitch Sunyaev72 (1972), S.Z. in the following) is a spectral distortion of the Cosmic Microwave Background (CMB) due to inverse Compton scattering of CMB photons by hot electrons in clusters of galaxies. It consists of a flux decrement at millimetre and centimetre wavelengths and a flux increment at shorter wavelengths. If the temperature of the electron gas is determined independently, for instance from the Xray spectrum, then the knowledge of both parts of the S.Z. effect can provide information about the intracluster gas mass (thermal effect), and on its peculiar velocity with respect to the Hubble flow (kinetic effect). Recent calculations which fully take into account the relativistic effects, have shown that for the hottest clusters, , the S.Z. spectrum significantly departs from the Sunyaev and Zel’dovich result (see e.g. Rephaeli et al. Rephaeli95 (1995)). This temperature dependence of the S.Z. spectrum is particularly important in the submillimetre domain. Pointecouteau et al. (Pointecouteau98 (1998)) have shown that it could be used to determine the electron temperature from future space-borne sensitive submillimetre/millimetre S.Z. data, independently of any Xray measurement.
The comparison of the cluster’s Xray flux with the amplitude of the S.Z. thermal effect allows to derive the cluster’s angular distance and thus the Hubble constant. This method is fully independent of the classical distance-scale determination. Number of measurements of the decremental part at millimetre or centimetre wavelengths have been successfully achieved from the ground and allowed determinations of peculiar velocities or (see for instance Birkinshaw et al. Birkinshaw91 (1991), Jones et al. Jones93 (1993), Birkinshaw and Hughes Birkinshaw94 (1994), Myers et al. Myers97 (1997), and Holzapfel et al. 1997a , 1997b ). The determination of the clusters peculiar velocity is performed at wavelengths near 1.4 mm, where the thermal effect is close to zero. At this wavelength the dust emission of galactic cirrus or extragalactic starbursts can be significant and polutes the measurement. Only Infrared/submillimeter observations can raise this degeneracy. We report in this paper such measurements for the cluster Abell 2163.
This is a well studied massive cluster located at , which has one of the hottest known intracluster gas temperatures (, Elbaz et al. Elbaz95 (1995) and Markevitch et al. Markevitch96 (1996)). This makes it a very attractive candidate for measurements of the S.Z. effect. High sensitivity measurements of the S.Z. effect on this cluster have been obtained at 1.1, 1.4 and 2.1 mm using the SuZIE Caltech photometer on the CSO ( Holzapfel et al. 1997c ).
2 Observations
2.1 Submillimetre data
The submillimetre data presented here were obtained with the PRONAOS telescope 111The PRONAOS telescope is operated under the responsibility of the Centre National d’Etudes Spatiales (CNES), in collaboration with the laboratories of the authors (Serra et al. Serra98 (1998)) during a 30-hour stratospheric flight from Fort Sumner (N.M.) on September the 22nd and 23rd, 1996. The 2-metre primary dish of the instrument is a 6-element segmented mirror with active control of the shape to compensate for inflight thermal and gravity changes. The SPM photometer (Lamarre et al. Lamarre94 (1994)) includes warm optics providing the sky modulation and internal regulated black-body calibrators. The detector system uses bolometers cooled at 0.3 Kelvin with closed cycle coolers inside a liquid cryostat. There are 4 spectral bands at 170-240 , 240-340 , 340-540 , 540-1050 with beams of 2, 2, 2.5, and 3.5 arcmin (channels 1 to 4 respectively). The optical scheme uses dichroics so that a single direction on the sky is observed in the four channels simultaneously.
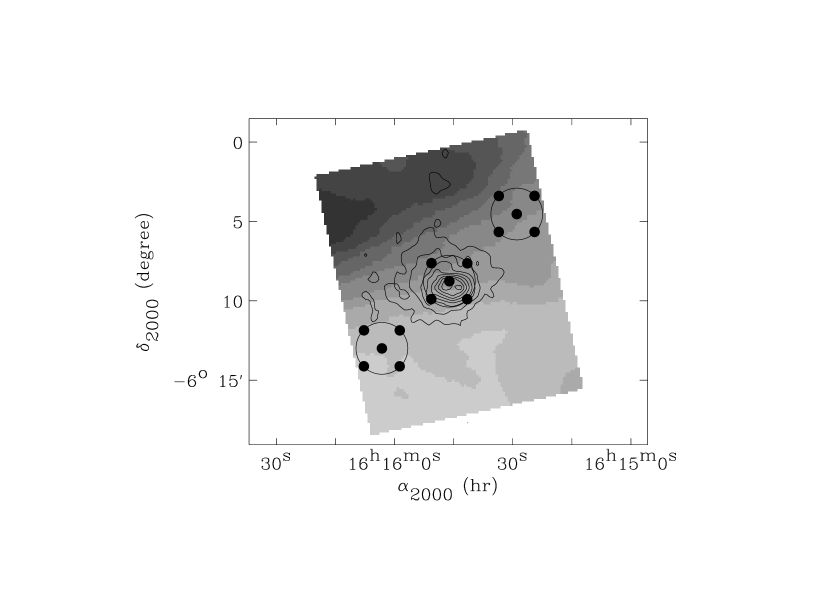
Our observation strategy includes three levels of beam modulation to subtract the instrumental systematic signals and their possible variations: i) beam switching at constant elevation, with a 6-arcmin amplitude, at a frequency of 19.5 Hz, ii) telescope nodding so that the source is alternately seen in the positive and negative beams, at a frequency of about 0.01 Hz, iii) repeating the observation on a blank field, with the same duration and observing mode. The blank field was selected in the neighborhood of the cluster, for minimum dust contamination in the IRAS 100 maps (). Five positions are observed in the direction of the cluster: one at the nominal cluster centre (maximum X-ray brightness) and the other four at 1.6-arcmin offsets in elevation and cross-elevation from this centre (see Fig. 1). This strategy was chosen to cope with possible miss-pointing of the telescope (which did not occur) and to provide information on the cluster extension in case of a high signal-to-noise detection. A2163 and the reference field were each observed for a total duration of 54 minutes.
The sensitivities achieved in flight by the PRONAOS-SPM system are 1.0, .58, .17 and .06 MJy/sr respectively in the four channels, for S/N=1 and an observation time of 1 hour. The noise level in channels 1 and 2 is dominated by low frequency fluctuations likely to be due to residual atmospheric emissions. These fluctuations are still important in channel 3, but can be efficiently removed by correlation with channel 1 and subtraction of the correlated component. The residual noise level is then about 0.09 MJy/sr in channel 3, which, together with the noise in channel 4, is close to what is expected from photon noise. The calibration is performed in four steps: i) ground based calibration of the photometer on extended blackbodies at different temperatures, ii) ground based measurement of the bands’ spectral responses, iii) inflight measurement of the instrument beam on the planet Saturn, and iv) inflight monitoring of the detector response on an internal modulated reference source (a detailed description of the noise analysis and calibration procedures will be published in a forthcoming paper by Pajot et al.). The resulting absolute calibration accuracy has been estimated to be of order 10%. Finally, for each analysed source the calibration coefficients are re-computed in a self consistent manner, integrating the bandpass over the best estimate of the source’s spectrum: e.g. dust plus S.Z. effect in the case of A2163.
The data processing includes: i) data deglitching and filtering, ii) demodulation from telescope nodding: , iii) averaging. Before averaging, channels 3 and 4 were cross-correlated with channel 1 to subtract any correlated noise component. The correlation ratios found are and in Jansky units. These color ratios are much smaller than the cosmic dust emission colors, which will be the main contributor to the flux measured in channel 1: and for dust at 15 K with a spectral index of 2. However, as this decorrelation process also implies some subtraction of the dust component from channels 3 and 4, the average data values were self-consistently corrected using the final dust best fit spectrum ().
2.2 Far infrared data
Maps at 90 and 180 were obtained with the PHOT instrument on board the ISO satellite, (open time program: GSERRA:SZCLUST). The observation mode was a PHOT-32 8x8 raster map with steps of 92 arcsecond and integration times of 20 and 64 seconds per pixel (pixel sizes are 43 and 90 arcsec respectively for the 90 and 180 filters). The data reduction was performed with the PIA-7.01 software. In order to get consistent data allowing us to derive the dust emission, the PRONAOS observing sequence was simulated with its parameters -beam switching and beam size- on the ISO maps (see Fig. 1). The results of these simulated measurements are reported in Table 1 with the corresponding error bars (see also Fig. 2). The error bars have been derived from the rms fluctuation taken on a map of residuals. This map was obtained by subtraction of the large scale cirrus pattern fitted as a 5 degree 2D polynomial. The error bar obtained in this manner is always larger than the PHOT absolute calibration uncertainty (10 to 20 %).
The same operation was performed on the IRAS ISSA map at 100 . Although the spatial modulation for PRONAOS and SuZIE is not exactly the same, the simulations using the 180 ISO-PHT data show that the dust signal is the same within error bars. Thus a single dust signal is used in the interpretation of the data.

| Instrument | aaCentral comptonization parameter taken from the litterature (assuming the same King profile as in this paper). | MJy/srbbEstimated signal for a 3.5’ beam and 6’ modulation amplitude (square brackets give errors). | |
|---|---|---|---|
| 90 | ISO-PHT | 0.16 [0.14] | |
| 100 | IRAS | 0.18 [0.22] | |
| 180 | ISO-PHT | 1.04 [0.18] | |
| 390 | PRONAOS | 0.43 [0.09] | |
| 630 | PRONAOS | 0.30 [0.08] | |
| 1120 | SuZIE | 4.05 [1.45] ccHolzapfel et al. 1997a and 1997b | 0.107 [0.038] |
| 1380 | SuZIE | 9.9 [6.0] ccHolzapfel et al. 1997a and 1997b | -0.039 [0.024] |
| 2120 | SuZIE | 3.73 [0.35] ccHolzapfel et al. 1997a and 1997b | -0.140 [0.013] |
| 2100 | Diabolo | 5.5 [2.2] ddDésert et al. Desert98 (1998) | -0.20 [0.08] |
3 Results and discussion
We show in Fig. 2 our far-infrared and submillimetre measurements together with the existing millimetre data from Holzapfel et al. (1997a ) at 1.1, 1.4 and 2.1 mm (SuZIE experiment on the CSO telescope: 1.9 arcmin beam, 4.6 arcmin beamthrow) and from Désert et al. (Desert98 (1998)) at 2.1 mm (Diabolo experiment on the IRAM 30 metre telescope: 0.5 arcmin beam, 3 arcmin beamthrow). The numerical values with error bars are reported in Table 1. The Diabolo and SuZIE data have been corrected for the different beams and modulation amplitudes to compare with PRONAOS data, assuming a King profile for the intracluster gas density:
| (1) |
where , the cluster core radius, corresponds to a projected angle arcmin and from Elbaz et al. (Elbaz95 (1995)). The dilution factors for PRONAOS and Diabolo are respectively 0.38 and 0.55 in terms of the ratio of the beam averaged signal to the central cluster value. For PRONAOS this also takes into account averaging over the offset positions. For SuZIE we use the values derived from single band fits by Holzapfel et al. (1997a ), which use the same cluster model as we do.
Different components appear in this spectrum: the dust shows up
at shorter wavelengths and is measured at 90 (ISO),
100 (IRAS), 180 (ISO) and 390 (PRONAOS).
The S.Z. thermal effect has its maximum positive
and negative peaks respectively at submillimetre and millimetre wavelengths.
The positive part is measured at 630 (PRONAOS) and 1.1 mm (SuZIE),
whereas the negative part is measured at 2.1 mm (SuZIE and Diabolo).
Finally the Kinetic S.Z. effect (or CMB primordial temperature fluctuation,
see below) is dominant
in the SuZIE 1.4 mm band, where the S.Z. thermal effect is close to zero.
We have simultaneously fit the ISO, PRONAOS, Diabolo and SuZIE data with a S.Z. plus dust spectrum having four free parameters: the comptonization parameter in the direction of the cluster center, the peculiar velocity of the cluster, the level of dust emission at 180 , and the dust temperature (The dust emissivity index being fixed to from Boulanger et al. Boulanger96 (1996)). We are not able to distinguish the S.Z. kinetic effect from a thermal fluctuation of the CMB itself since they have the same spectrum. In the following we will quote both the velocity value and the peak value for a CMB fluctuation that would have the same angular distribution and flux as the cluster S.Z. kinetic effect. For the S.Z. effect we assume an intracluster gas temperature of 13 keV and use an exact relativistic thermal S.Z. spectrum from Pointecouteau et al. (Pointecouteau98 (1998)). The best fit values for the four parameters using the whole data set, and 68% confidence intervals, are: , km/s (cluster moving away from us, ), MJy/sr and K. The error bar on each parameter has been calculated from a likelihood analysis after integration over the other parameters: . It was not necessary to assume a prior probability for any of the four parameters.
First of all, this data set provides three measurements of the S.Z. effect in A2163 made with significantly different beam sizes, 3.5, 1.9 and 0.5 arcmin respectively for PRONAOS, SuZIE and Diabolo. Within the error bars, the three measurements give the same value for the comptonization parameter in the direction of the cluster center. This validates the King profile that has been derived from the X-ray analysis for the intracluster gas distribution, for a cluster radius ranging from 0.4 to 5 times the core radii.
Our values for the compton parameter and cluster peculiar velocity can be compared with the values derived in Holzapfel et al. (1997a ) from the analysis of the SuZIE data at 1.1, 1.4 and 2.1 mm: and . However in their analysis the authors assumed a zero dust emission level, which is not realistic given the far infrared measurements. The ISO map in Fig. 1 clearly shows that this cluster, which is at medium galactic latitude, lies behind a significant layer of galactic dust (about 25 MJy/sr at 180 ). We show in Fig. 3 that the millimetre data itself does not allow a precise determination of the cluster peculiar velocity in the absence of any submillimetre measurement constraining the dust contribution. This figure displays the 68% and 95% confidence contours on and , including (and not including) the far infrared and submillimetre data in the fit: full lines (dashed lines). In the second case (dashed line) the parameters of the dust component have been varied in the following range: , . This is a plausible range considering the average depth of the cirrus cloud in the direction of A2163 : from the Xray data (Elbaz et al. Elbaz95 (1995)), or from 21 cm surveys (Dickey and Lockman Dickey90 (1990)). We use the infrared to colors from Boulanger et al. (Boulanger96 (1996)): at .

Although it remains within the previous error bars, the velocity change induced by taking into account the dust contribution implies a slight decrease in . This is because the kinetic S.Z. effect contributes about 10% of the measured decrement at 2.1 mm, the wavelength where the thermal S.Z. effect is mostly constrained by the data. The combined data set (submillimetre plus millimetre) only slightly improves the precision of the comptonization parameter since the accuracy of the PRONAOS measurement of the positive S.Z. effect (S/N = 3 to 4) is much less than that of the SuZIE measurement at 2.1 mm (S/N = 10).
Concerning the derivation of by comparison
of the comptonisation parameter with X-ray fluxes, this scales as
. Thus, the value derived using the same
isothermal model for the cluster gas distribution as
Holzapfel et al. (1997a ) increases from
to with our determination of .
To conclude, the combined data set presented here (Fig. 2) demonstrates the need for submillimetre data to correctly interpret S.Z. measurements and more generally millimetric CMB data. At this stage we are not able to assess the origin of the submillimetre dust emission towards A2163: i) residual unbalanced galactic dust as assumed above, ii) background starburst galaxies which can possibly be magnified by a gravitational lensing effect or iii) intracluster dust as measured by Stickel et al. (Stickel98 (1998)) toward the Coma cluster. This last hypothesis was carefully examined. Data from ISO-PHT show that the measured flux depends on the orientation of the simulated beam switching, and that the mean of all possible orientations (1.5 detection) does not provide a confirmation of a brightness excess towards the cluster. Moreover, given the depth of the foreground cirrus cloud (see above) the hypothesis of contamination by galactic dust seems very likely.
The case of A2163, a massive cluster at medium galactic latitude, actually provides a good illustration of the problems that will be faced when interpreting data for more standard clusters at higher galactic latitudes (, MJy/sr) with the future very sensitive space borne instruments such as Planck (Bersanelli et al. Bersanelli96 (1996)). Submillimetre capabilities, as provided by Planck and FIRST, will be required to derive meaningful peculiar velocities, and precisions below 10% on the comptonisation parameter. However, concerning the peculiar velocity, the fundamental limitation will remain the CMB because it has the same spectrum as the S.Z. kinetic effect (see e.g. Haehnelt and Tegmark Haehnelt96 (1996) and Aghanim et al. Aghanim97 (1997)). In a similar way, the analysis of the primordial CMB anisotropies themselves at high angular resolution () from the Planck 217 GHz channel, will also suffer from the dust contamination and require the help of the submillimetre channels.
References
- (1) Aghanim, N., De Luca, A., Bouchet, F. R., Gispert, R., and Puget, J. L.: 1997, A&A 325, 9
- (2) Bersanelli, M. et al.: 1996, ESA D/SCI(96)3
- (3) Birkinshaw, M. and Hughes, J. P.: 1994, ApJ 420, 33
- (4) Birkinshaw, M., Hughes, J. P., and Arnaud, K. A.: 1991, ApJ 379, 466
- (5) Boulanger, F. et al.: 1996, A&A 312, 256
- (6) Désert, F.X. et al.: 1998, New Astronomy in press
- (7) Dickey, J.M., and Lockman, F.J.: 1990, ARAA 28, 215
- (8) Elbaz, D., Arnaud, M., and Boehringer, H.: 1995, A&A 293, 337
- (9) Haehnelt, M. G. and Tegmark, M.: 1996, MNRAS 279, 545
- (10) Holzapfel, W. L. et al.: 1997a, ApJ 481, 35
- (11) Holzapfel, W. L. et al.: 1997b, ApJ 480, 449
- (12) Holzapfel, W. L. et al.: 1997c, ApJ 479, 17
- (13) Jones, M., Saunders, R., Alexander, P., Birkinshaw, M., Dilon, N., Grainge, K., Hancock, S., Lasenby, A., Lefebvre, D., and Pooley, G.: 1993, Nature 365, 320
- (14) Lamarre, J.M. et al.: 1994, Infrared Physics Techno. 35, 277
- (15) Markevitch, M., Mushotzky, R., Inoue, H., Yamashita, K., Furuzawa, A., and Tawara, Y.: 1996, ApJ 456, 437
- (16) Myers, S. T., Baker, J. E., Readhead, A. C. S., Leitch, E. M., and Herbig, T.: 1997, ApJ 485, 1
- (17) Pointecouteau, E., Giard, M., and Barret, D.: 1998, A&A in press
- (18) Rephaeli, Y.: 1995, ApJ 445, 36
- (19) Serra, G. et al.: 1998, ICSO conference held 1997 december 2/3, Toulouse
- (20) Stickel, M., Lemke, D., Mattila, K., Haikala, L. K., and Haas, M.: 1998, A&A 329, 55
- (21) Sunyaev, R. and Zel’dovitch, Y.: 1972, Comments Astrophys. Space Phys. 4, 173