The history of star formation in dusty galaxies
Abstract
A population of distant dusty galaxies emitting in the submillimetre waveband has recently been detected using the Submillimetre Common-User Bolometer Array (SCUBA) camera on the James Clerk Maxwell Telescope (JCMT). This population can be used to trace the amount of high-redshift star-formation activity that is obscured from view in the optical waveband by dust, and so is missing from existing inventories of star formation in the distant Universe. By including this population we can construct a complete and consistent picture of the history of star formation. The evolution of obscured star formation at redshifts less than unity is constrained by mid- and far-infrared counts of dusty galaxies. Activity increases with redshift as with , consistent with the form of evolution found in the optical waveband by the Canada–France Redshift Survey (CFRS) to . The form of evolution at higher redshifts is constrained by both faint SCUBA counts and the intensity of background radiation in the millimetre/submillimetre waveband. We find that the total amount of energy emitted by dusty galaxies is about four times greater than that inferred from restframe ultraviolet observations, and that a larger fraction of this energy is emitted at high redshifts. The simplest explanation for these results is that a large population of luminous strongly-obscured sources at redshifts is missing from optical surveys. We discuss the possible contribution of obscured active galactic nuclei to the submillimetre-wave background and counts. More accurate constraints on the history of star formation will be provided by determinations of the counts in several submillimetre wavebands and crucially by a reliable redshift distribution of the detected galaxies.
keywords:
galaxies: evolution – galaxies: formation – cosmology: observations – cosmology: theory – diffuse radiation – radio continuum: galaxies1 Introduction
A history of star formation in galaxies over roughly the last half of the Hubble time has been inferred with reasonable accuracy by combining the star-formation rate (SFR) in the local universe (Gallego et al. 1996; Gronwall 1998; Tresse & Maddox 1997; Treyer et al. 1998), the results of spectroscopic redshift surveys out to (Lilly et al. 1996) and the results of deep photometric surveys, such as the Hubble Deep Field, in which Lyman-dropout selection techniques (Steidel et al. 1996a) are used to determine photometric redshifts: see Madau et al. (1996) and Madau, Della Valle & Panagia (1998). This history of unobscured star formation in galaxies can be described adequately by a power-law increase in the comoving density of star-formation activity with redshift of the form with out to , followed by a decrease at higher redshifts. Observations made in the near-infrared waveband by Connolly et al. (1997) have provided further support for the suggestion that the SFR peaks at –2. This standard picture of the star-formation history is shown in Fig. 1. It accords with the form of evolution of the luminosity density inferred from observations of radio sources (Cram 1998; Dunlop 1998) and quasars (Boyle & Terlevich 1998).
This work has greatly increased our knowledge of the evolution of star formation activity in the Universe; however, the points plotted in Fig. 1 in fact only represent firm lower limits to the true SFR at each epoch. Extinction due to any interstellar dust in the optically selected observed galaxies suppresses their flux densities in the rest-frame optical and ultraviolet wavebands, and so leads to an underestimation of their SFR, sometimes by quite considerable factors (). Using estimates of obscuration in Lyman-dropout galaxies derived from restframe ultraviolet spectra, Pettini et al. (1998a,b) have recently revised the global SFR at redshifts greater than 2 upwards by a factor of about 5, as shown by the open boxes in Fig. 1. However, it is difficult to correct optical and ultraviolet spectra reliably for the effects of dust, and so these revisions are rather uncertain. In contrast, the associated rest-frame mid- and far-infrared thermal emission from the interstellar dust grains that are heated by absorbing optical and ultraviolet photons can be detected directly and used to place limits on the dust mass and SFR of the galaxies.
The first observations of dust emission from external galaxies were made by the IRAS satellite. Nearby galaxies selected on the grounds of blue colours in the optical waveband were found to emit typically 60 per cent of their total luminosity in the far-infrared waveband (Mazzarella & Balzano 1986). The redshift distribution of the population of galaxies detected at a wavelength of 60 m by IRAS extends out to , and is consistent with pure luminosity evolution of the form (Saunders et al. 1990; Oliver, Rowan-Robinson & Saunders 1992). More recent observations at wavelengths of 15 m and 175 m using the more sensitive ISO satellite (Kawara et al. 1997; Rowan-Robinson et al. 1997; Hammer & Flores 1998; Lagache et al. 1998) have confirmed that strong evolution continues out to , a result that is broadly consistent with the form of evolution derived from optical observations (Lilly et al. 1996). However, although they trace the star-formation history over at least half the Hubble time, these observations do not strongly constrain the SFR in the early Universe, an era crucial for distinguishing between competing galaxy formation models (Cole et al. 1994). One of the most promising routes to probe this regime are deep observations at still longer wavelengths, in the millimetre and submillimetre wavebands.
Early bounds on the intensity of background radiation in the submillimetre and far-infrared wavebands from the FIRAS instrument on the COBE satellite (Wright et al. 1994; Fixsen et al. 1996) provided limits on the amount and epoch of obscured star formation activity in an hierarchical model (Blain & Longair 1993b). Much more information about the role of dust was provided by Puget et al. (1996), who detected a considerably larger isotropic non-Galactic background radiation signal in the same data by using a different model of Galactic emission. The results indicate that a large amount of far-infrared emission must be produced by dust at (Burigana et al. 1997). Recently, this early estimate of the background radiation intensity has been in large part confirmed by independent analyses (Guiderdoni et al. 1997; Fixsen et al. 1998), and by complimentary data obtained using the DIRBE instrument (Hauser et al. 1998; Schlegel, Finkbeiner & Davis 1998). A significant amount of star formation activity at redshifts greater than unity, at least in dense environments, is apparently required to explain observations of metal enrichment in intracluster gas at (Mushotzky & Loewenstein 1997).
The population of submillimetre-luminous galaxies that produce the far-infrared/submillimetre-wave background signal were detected by Smail, Ivison & Blain (1997, hereafter SIB). The counts of faint galaxies in the submillimetre waveband are very sensitive to the form of galaxy evolution at high redshift because the –corrections expected for distant galaxies are very large and negative. Hence high-redshift galaxies are likely to make a substantial contribution to the counts (Blain & Longair 1993a), which in turn provide a sensitive test of galaxy evolution models in the early Universe.

SIB exploited the especially strong magnification bias expected in rich clusters of galaxies in the submillimetre waveband (Blain 1997) to increase the detectability of the population of background galaxies. Unless the cluster galaxies have extremely high and undetected SFRs, the contribution of flux densities from galaxies within the lensing clusters should be at least an order of magnitude less than that from background sources. The observations were carried out using the sensitive SCUBA camera at the James Clerk Maxwell Telescope (Holland et al. 1999). The results of the completed cluster survey and its follow up are described elsewhere (Ivison et al. 1998; Smail et al. 1998; Blain et al. submitted; Smail et al. in preparation). The first results of other blank-field surveys (Barger et al. 1998; Eales et al. 1998; Holland et al. 1998b; Hughes et al. 1998) are now available.
We use these 850-m observations and other sub-millimetre/far-infrared observations at wavelengths of 175 m (Kawara et al. 1997) and 2.8 mm (Wilner & Wright 1997), the intensity of background radiation in the millimetre/submillimetre/far-infrared wavebands, and existing information about the evolution of dusty galaxies at low redshifts derived from 60-m observations (Oliver et al. 1992) to investigate the history of star-formation activity in the Universe that is obscured from view in the optical waveband by dust. Throughout the paper we use the comoving density of star-formation activity to represent the luminosity density of the Universe, in order that the results of observations in the optical and submillimetre wavebands can be readily compared. However, non-stellar emission from active galactic nuclei (AGN) contribute to the total emitted radiation in the submillimetre waveband. This issue is discussed in more detail in Section 5.
We review the relevant observations and existing limits in Section 2, outline our strategy for determining the star formation history in Section 3, and discuss the self-consistency of the results in Section 4. In Section 5 we present the resulting star formation histories and review them in the context of optical observations. In Section 6 we investigate the most promising routes to obtaining better constraints on the history of star-formation activity in the millimetre/submillimetre and far-infrared wavebands: see also Blain (1998c). A value of Hubble’s constant km s-1 Mpc-1, a density parameter and a cosmological constant are assumed.
2 Observations
2.1 Mid/far-infrared source counts
The whole sky was observed at a wavelength of 60 m in the IRAS survey, and counts of galaxies were determined to various flux density limits (Hacking & Houck 1987; Rowan-Robinson et al. 1990; Saunders et al. 1990; Gregorich et al. 1995; Bertin, Dennefeld & Moshir 1997). At this wavelength the emission from galaxies is dominated by the thermal radiation of dust grains, heated by absorbing the optical and ultraviolet light from both young high-mass stars and AGN. The most luminous class of sources detected by IRAS appear to be powered by stars and AGN in the ratio 2:1 (Sanders & Mirabel 1996). The redshift distribution of the faintest galaxies in the survey extends out to a redshift of about 0.2. Saunders et al. (1990) and Oliver et al. (1992) found that pure luminosity evolution of the form or pure density evolution of the form can account for the results. The inferred form of luminosity evolution is comparable with that determined for radio-galaxies, quasars and optically-selected star-forming galaxies (see e.g. Dunlop & Peacock 1990; Hewett, Foltz & Chaffee 1993; Lilly et al. 1996; Boyle & Terlevich 1998 and Dunlop 1998). However, it is possible to fit the counts adequately by a range of evolution parameters if the typical dust temperature is varied: see Section 3.3.
The mid- and far-infrared counts of more distant galaxies are being determined from the results of surveys using the ISO satellite; for example the observations of Kawara et al. (1997) and Lagache et al. (1998) at a wavelength of 175 m. At shorter wavelengths of 7 and 15 m, Oliver et al. (1997) and Hammer & Flores (1998) derived counts from ISO observations of the Hubble Deep Field and CFRS fields respectively. However, it is difficult to translate between such a measurement of hot dust and the cooler dust that dominates the energy emission of a galaxy, and so the inferred global SFR (Rowan-Robinson et al. 1997) is very uncertain (Hughes 1996). Spectral features in dust emission in the mid-infrared waveband are also likely to affect the results (Xu et al. 1998). Much more information about the population of mid-infrared-luminous galaxies will be proved in 1999 by the Wide-Field Infrared Explorer (WIRE) satellite (Shupe et al. 1998).
2.2 The intensity of background radiation
The intensity of diffuse background radiation in the millimetre, submillimetre and far-infrared wavebands has been constrained by observations of the whole sky using the FIRAS (Fixsen et al. 1994) and DIRBE (Hauser et al. 1996) instruments aboard the COBE satellite (Puget et al. 1996; Guiderdoni et al. 1997; Fixsen et al. 1998; Hauser et al. 1998; Schlegel et al. 1998). At wavelengths longer than about 400 m the cosmic microwave background radiation (CMBR) dominates the spectrum detected by FIRAS. After subtracting the CMBR signal and the emission from Galactic dust, the isotropic signal from extragalactic sources remains. This subtraction is a complex process, and will improve in the future. The Planck Surveyor satellite (Bersanelli et al. 1996) will also obtain much more accurate maps of the submillimetre-wave sky. However, our knowledge of the intensity of extragalactic background radiation in the millimetre/submillimetre and far-infrared wavebands is now substantially complete (see Fig. 2). Consistent limits to the background radiation intensity at shorter wavelengths have been determined by Dwek & Slavin (1994), Biller et al. (1998) and Dwek et al. (1998). The energy-normalized background spectrum hence has a peak at a wavelength between about 100 and 200 m.

2.3 Millimetre/submillimetre-wave source counts
Millimetre/submillimetre-wave observations using both single-antenna telescopes and interferometer arrays can be used to detect and limit the counts of discrete sources. At a wavelength of 2.8 mm, Wilner & Wright (1997) used the BIMA interferometer to image the Hubble Deep Field to a 1 sensitivity of 0.71 mJy. No sources were detected at a significance greater than 5, which translates into a 3 upper limit to the counts of 160 deg-2 at a flux density of 2 mJy.
At 850 m SIB detected six sources, which corresponds to a surface density of deg-2 at a flux density of 4 mJy. The brightest 850-m source (Ivison et al. 1998b) was also detected at a wavelength of 450 m, indicating a very weak 3 limit of about deg-2 to the 450-m counts at a flux density of 80 mJy. Observations of five additional clusters (Smail et al. in preparation) have now extended the area of this survey to greater than 0.01 deg2. The surface density of discrete submillimetre-wave sources detected in the complete survey is fully consistent with measurements of the background radiation intensity discussed above (SIB). In deep images of dusty disks around stars, Holland et al. (1998) detected four unknown, probably extragalactic objects, indicating a count of deg-2 at a flux density of 8 mJy. At shorter wavelengths, Phillipps (1997) presented a 350-m 8.6-arcmin2 map made using the SHARC bolometer array at the Caltech Submillimetre Observatory, which contains no significant sources and reaches a 1 sensitivity of about 100 mJy.
The results of blank-field surveys in the Hubble Deep Field (Hughes et al. 1998), CFRS fields (Eales et al. 1998) and Hawaii Deep Survey fields (Barger et al. 1998), and independent observations of clusters will reduce the errors on the 850-m counts (see Fig. 11c for more details). The large complete cluster survey of Smail et al. (in preparation) will probably yield the most accurate constraints; the source counts derived from this large sample are discussed in a forthcoming paper (Blain et al. submitted).

2.4 Early results
Measurements of the far-infrared background radiation intensity, and deep ISO observations in the mid-infrared waveband have led to estimates of the star-formation history that is obscured by dust, as shown in Fig. 3. The comoving luminosity density emitted by dust in the far-infrared waveband can be related to the density of metals generated in high-mass stars by the present epoch in a population of galaxies that undergo their first generation of star formation at a redshift , by,
| (1) |
in an hierarchical model (Blain & Longair 1993b). The smoothed density of the Universe is . The relationship is similar in other models. The background radiation intensity shown in Fig. 2 can be explained by the generation of about since a redshift in this model. The estimated star-formation rate, assuming a standard conversion factor between far-infrared luminosity and the SFR (see Section 4) provides the star formation history shown in Fig. 3. The limits derived in a similar analysis by Burigana et al. (1997) are also shown. Counts of galaxies at 7 and 15 m can be used to infer a star-formation rate at (Rowan-Robinson et al. 1997; Hammer & Flores 1998), although potentially with a very large uncertainty (see Fig. 3).
3 Determining the history of obscured star formation
3.1 Strategy
Even before the completion of redshift surveys of submillimetre-selected galaxies we can still obtain useful constraints on the star-formation history at high redshifts by combining observations of discrete sources with measurements of the intensity of background radiation in the millimetre, submillimetre and far-infrared wavebands to derive self-consistent models for the evolution of the population of dusty galaxies. At very low redshifts, , these are constrained to match the normalization and evolution of the 60-m counts of IRAS galaxies. Note that redshifts less than two are described as ‘low’ in this paper.
First, an estimate of the typical dust temperature and the slope of the evolution function at low redshifts is obtained by fitting a pair of functional forms, which asymptote to power laws in at low redshift, to both the 60- and 175-m counts. Most of the degeneracy between the values of dust temperature and evolution parameter is broken by including information from the 175-m counts, and so a robust estimate of the form of evolution of dusty galaxies at low redshifts can be obtained.
Secondly, the resulting models of the evolving population of dusty galaxies are extrapolated out to high redshifts, and are constrained to fit the background radiation spectrum and submillimetre-wave counts.
Thirdly, we employ a simple chemical evolution model to check whether or not the best-fitting models are self-consistent. A sufficiently large mass of dust must be generated in each model to absorb early starlight and to account for the large amounts of far-infrared emission (Eales & Edmunds 1996, 1997; Frayer & Brown 1997), subject to the constraint on the temperature of emitting dust derived at low redshifts. The total mass of heavy elements produced in high-mass stars throughout the history of the Universe (Savage & Sembach 1996) is also checked for consistency with observations.
In order to avoid introducing a large number of free parameters, we aim to explain all the data using a single population of dusty galaxies, described by the 60-m luminosity function, with a fixed dust temperature and emissivity . Saunders et al. (1990) fit the 60-m counts using both a warm and cool component, and Pearson & Rowan-Robinson (1996) adopt a similar scheme of cool ‘cirrus’ and warm ‘starburst’ galaxies. Although distinct populations of dusty galaxies exist in the local Universe (Sanders & Mirabel 1996), in this paper we are investigating the global evolution of galaxies, driven by observations that are sensitive to galaxies out to redshifts of about 10. Hence, while such multi-component models may be required to explain more detailed observations in the future, we do not believe that the introduction of additional parameters is justified by the data at present. Here we fit four observations – the evolution of the 60-m count, the 175- and 850-m counts and the background radiation spectrum – using a model that contains four parameters – a typical dust temperature , a low-redshift slope of the evolution function , and two redshifts, and , the redshifts beyond which evolution slows down and at which the first galaxies appear respectively.
3.2 Spectral energy distribution
We assume that the frequency-dependent emissivity function of dust can be described in the millimetre and submillimetre wavebands by a simple power-law function (Hughes 1996; Ivison et al. 1998a). The dust emission spectrum is hence a modified Planck function with a Rayleigh–Jeans power-law index of . At shorter far-infrared wavelengths this function would decline exponentially as a function of frequency, turning over at a wavelength of m for a typical dust temperature of order K (Hughes 1996). A power-law spectrum of the form is grafted onto the modified Planck function at wavelengths shorter than that for which the equivalent power-law index of the modified Planck function is less than -. The slope of this short-wavelength spectrum reflects the fraction of dust grains in the model galaxy at temperatures larger than the defining temperature in the Planck function. A reasonable fit to radiative transfer models of dusty star-forming galaxies is provided by a value . These models are important for interpreting observations at wavelengths shorter than 50 m but not very relevant here (see Goldschmidt et al. 1997 and Xu et al. 1998).
(a) (b) (c)


3.3 Fitting the low-redshift counts
The 60-m counts of IRAS galaxies can be used to constrain the form of evolution at redshifts (Saunders et al. 1990; Oliver et al. 1992). If the luminosity function is parametrized using the two functions and , which describe density and luminosity evolution respectively, then,
| (2) |
Both and and and were found to provide good fits to the counts. The first of these cases is pure density evolution, and the second is pure luminosity evolution. Only models of pure luminosity evolution are considered here, because it is impossible to reproduce the counts of distant submillimetre-selected objects in a model of pure density evolution, without overproducing the intensity of far-infrared background radiation and the density of heavy elements generated in nucleosynthesis by a huge amount: between 50 and 100 times. This is because the effects of pure density and pure luminosity evolution are almost the same in the calculation of the background intensity and heavy element abundance, but luminosity evolution has a more significant effect in the calculation of the counts. This is not to say that no density evolution occurs, but luminosity evolution must be dominant if the existing data is accurate.
Two classes of evolution models are considered: an ‘anvil’ model defined by the evolution function,
| (3) |
and a ‘peak’ model, defined by the function,
| (4) |
In both models no galaxies exist beyond a redshift of . At very low redshifts has the asymptotic form .
These functional forms allow rather general and plausible evolution functions to be simply described: compare Cole et al. (1994). The peak model can be used to describe the star-formation history derived from optical and near-infrared observations in Fig. 1 adequately: see Table 1 and Fig. 8. By requiring an evolving IRAS 60-m luminosity function to fit both the form of evolution of the 60-m counts and 175-m ISO count, best-fitting values of the dust temperature and low-redshift evolution parameter can be determined, as shown in Fig. 4. The derived best-fitting value of the dust temperature K in both the anvil and peak models. In the anvil model the best-fitting evolution parameter , and in the peak model the best-fitting . A slightly stronger form of evolution is required in the peak model because the exponential term reduces the strength of the evolution at redshifts less than . Note that these slopes are very similar to the value required to fit the rate of evolution of optically selected star-forming galaxies determined at a wavelength of 280 nm by Lilly et al. (1996): they found . The estimated dust temperature appears to be consistent with the typical value of less than 40 K derived for a sample of very distant quasars by Benford et al. (1998). The 60-m counts predicted by the best-fitting models are compared with the IRAS data and the predictions of a non-evolving model in Fig. 5.
Equally good fits to low-redshift evolution of dusty galaxies are provided by the peak and anvil models. However, the 60-m counts provide no significant restrictions on the form of evolution at , and the ISO counts are not expected to include a significant proportion of galaxies at redshifts greater than 2. Hence, the submillimetre-wave counts and background intensities are required in order to investigate the history of star formation at earlier epochs.
3.4 Fitting the evolution of distant galaxies
In order to impose limits to the form of evolution at high redshifts, the peak and anvil models of pure luminosity evolution are used to predict both the spectrum of submillimetre-wave background radiation and the counts of dusty galaxies at wavelengths of 2.8 mm, 850 and 450 m. The density of metals generated in high-mass stars by the present epoch is also calculated. The models used to derive these quantities are discussed by Blain & Longair (1993a, 1996).
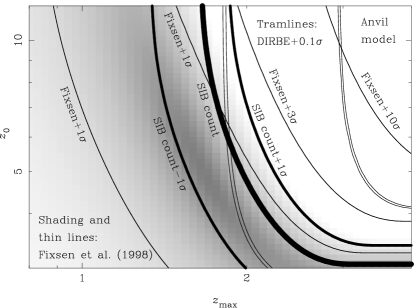
The results of these calculations are presented in Fig. 6 for illustration in the anvil model, assuming the values of and derived above, as a function of and , the remaining free parameters in the evolution function (equation 3). Likelihood contours derived for independent fits to the background intensities reported by Fixsen et al. (1998), and a combination of the results of Schlegel et al. (1998) and Hauser et al. (1998) are compared with the likelihood of a fit to SIB’s 850-m counts.
Additional constraints can be imposed by considering source counts at wavelengths of 2.8 mm (Wilner & Wright 1997) and 450 m (SIB; Barger et al. 1998), and the density parameter of heavy elements generated by high-mass stars by the present epoch , expected to be approximately . If solar metallicity (Savage & Sembach 1996) is typical of the Universe as a whole, and the density parameter in baryons (Burles & Tytler 1998), then . These constraints are weaker than those imposed by the counts and background data and shown in Fig. 6. The background estimate of Puget et al. (1996) provides a substantially weaker constraint on our models than any of the other estimates of the background and so does not add anything to our analysis. As noted by Fixsen et al. (1998), if the H+ correction employed by Puget et al. (1996) is omitted, then the two determinations of the background intensity are in good agreement (see Fig. 4b of Fixsen et al. 1998). The results of further analysis of the COBE data will probably increase the certainty with which the background is known, but, as shown in Fig. 6 and discussed below, the newly determined submillimetre-wave counts are the crucial data for discriminating between models.
In Fig. 7 the joint likelihood for a fit to all the data, apart from Puget et al.’s background is presented for both the peak and anvil models. All the data can be fitted very satisfactorily. Note that changing the values of the parameters and , which were determined using low-redshift data in Section 3.3, within their specified errors causes the probability contours in – parameter space to move by less than 1 from the positions shown in Fig. 7.

There are several interesting points to note in Fig. 6. First, the regions of parameter space in which both the intensity of background radiation and the 850-m counts are fitted overlap satisfactorily. The counts and background estimates are consistent, although models that fit the counts are in better agreement with the recent background estimates by Fixsen et al. (1998) than with Puget et al. (1996). Secondly, the tightness of the constraints imposed on the model parameters by the background measurements and the 850-m counts are comparable. As the accuracy of the 850-m counts is set to increase significantly when the complete cluster sample is presented (Blain et al. submitted; Smail et al. in preparation) and the data from other surveys becomes available, knowledge derived from the counts will be the determining factor in discriminating between models of galaxy evolution. Thirdly, the locus of the best-fitting parameters is a line and not a distinct peak. Hence, given the existing data, no individual model provides a best fit, but rather families of acceptable models trace out this locus (see Fig. 7). In the final section we discuss how we can discriminate between members of these families.
Three values of and are selected in each model, highlighted by dots in Fig. 7. The models defined by these sets of parameters are consistent with all the current submillimetre-wave data, and we list their parameters in Table 1.
Submillimetre-wave observations are very sensitive to the form of galaxy evolution at high redshifts, and so provide a series of interesting cosmological tests (Blain 1998a). At present we are not prepared to use the limited available data to infer values of and ; however, note that low values of or a non-zero value of tend to increase the background radiation intensity for a given count. In an Einstein–de Sitter model, an exact fit to the counts requires a more significant form of evolution than an exact fit to the background (see Fig. 6). Hence, at a first level of approximation, a high-density Universe would seem to be more favoured by this data. We will return to this issue once more accurate counts have been determined.
3.5 An optically-motivated model
The likelihood contours in Fig. 7 have been used to select six best-fitting peak and anvil models, to test the robustness of the procedure, and to investigate whether or not observational tests can be devised to distinguish between the different cases. However, these best-fitting models have been selected on the basis of observations in the far-infrared and submillimetre wavebands alone. If the extinction corrections applied to account for reddening in faint Lyman-dropout selected sources (Pettini et al. 1998a,b) are correct, then the empty squares in Fig. 1 represent the global SFR in a high-redshift population of non-active sources, with individual SFRs in the range 10 to 50 M⊙ yr-1. The effects of this population, which consists of less luminous sources than the galaxies detected by SIB, should be included in the models. It is possible to use a peak model – Peak-G in Table 1 – to connect this population and the low-redshift IRAS galaxies, assuming that they are subject to the same form of low-redshift evolution as the IRAS galaxies. The choice of in this model is unimportant, as the SFR at is effectively zero in this model.
In order to explain the high-redshift data – the submillimetre-wave background radiation intensity and counts, and the majority of the 175-m ISO counts – an additional second population of more luminous, but obscured, galaxies must be included. This ‘Gaussian’ population is based on the IRAS luminosity function, and is assumed to undergo pure luminosity evolution of the form,
| (5) |
This function represents a burst in the SFR of the population at a characteristic epoch, centred on the cosmic epoch that corresponds to redshift , with a characteristic timescale and a normalization with respect to the low-redshift IRAS luminosity function. To avoid introducing extra parameters, the dust temperature in this additional population remains at 38 K. The three parameters and are determined by fitting the model to the submillimetre-wave counts and background radiation intensity (see Table 1). Reasonably, , which is proportional to the total amount of star formation activity in the burst, is constrained more tightly than the individual values of and : Gyr.
(a) (b)


Model / / Line style Line Comments 10-3 M⊙ yr-1 Mpc-3 Thickness Peak-M 10 0.16 Dot-dashed Thin Fits Madau et al. (1996) Peak-P 10 0.31 Dot-dashed Thick Fits Pettini et al. (1998a,b) Anvil-10 10 0.85 7.7 Solid Thick Anvil-5 5 0.99 7.7 Solid Medium Anvil-4 4 1.05 7.7 Solid Thin Peak-10 10 0.79 7.7 Dashed Thick Peak-5 5 0.84 7.7 Dashed Medium Peak-4 4 0.90 7.7 Dashed Thin Peak-G 10 0.35 7.7 Dotted Thin Base for Gaussian model Gaussian 10 N/A N/A 0.91 N/A Dotted Thick Always added to above Gyr
4 Consistency arguments
4.1 Generation of dust and stars
We have adopted a single-temperature dust model to evaluate a star formation history in obscured galaxies that is consistent with all existing observations at wavelengths between the millimetre and mid-infrared wavebands. The temperature was obtained in Section 3.3 using the low-redshift count data. For these models to be self-consistent, a sufficiently large mass of dust must be present at each epoch to absorb the optical/ultraviolet continuum luminosity of young star-forming regions and re-emit it at the required temperature. This type of condition was discussed in the context of a starburst in an individual galaxy by Eales & Edmunds (1996, 1997). While preparing previous papers (Blain & Longair 1993a, 1996), the results of ‘back-of-the-envelope’ calculations suggested that this effect would not be particularly significant, especially as there was so little data with which to constrain model predictions. However, now that much more data is available, it is important to confirm the self-consistency of our models.
The relationship between the mass, temperature and total bolometric luminosity of dust grains is reasonably well determined. If the quantities are all expressed in densities per unit comoving volume, then the luminosity density emitted in the rest-frame far-infrared waveband
| (6) |
where is the comoving density of dust grains, and a emissivity law is assumed. Regardless of whether the dust is distributed uniformly or in clumps, equation (6) implies that there is a well-defined minimum temperature that the dust must have in order to emit a given luminosity density. Because of the strong temperature dependence on the right-hand side, it is possible for a small fraction of the dust at a higher than average temperature to dominate the emission of energy; for example, the same luminosity is emitted by a mass of dust at a uniform temperature as by only 1 per cent of the grains at a temperature increased by a factor of 2.3. However, it is not possible for a required luminosity to be generated at a uniform lower temperature.
For an obscured star formation model to be self-consistent, enough dust must be generated by prior generations of stars to satisfy the constraint on dust temperature imposed by equation (6) at a temperature of 38 K. If this condition is not satisfied, then insufficient absorption can take place at high redshifts. By rearranging equation (6), the limit is given by
| (7) |
is expected to be directly proportional to the SFR per unit comoving volume ; thus
| (8) |
Thronson & Telesco (1986) derived a value of L⊙ M yr for the entire range of stellar masses included in a Salpeter initial mass function (IMF). We note that the choice of this IMF is somewhat arbitrary at this time owing to our lack of knowledge of the IMF in galaxies in the early Universe. Rowan-Robinson et al. (1997) suggest a value of L⊙ M yr, and we assume this value here. If only OBA stars are formed, then the value of is expected to increase by a factor of about 3. Equations (6) and (8) provide a simple relationship between the bolometric luminosity emitted by dust and the comoving density of stars formed. Hence, given any star formation history, the total density of material converted into stars by any epoch
| (9) |
can be calculated. is the comoving density of stars formed in any Population III component at redshifts greater than .
The evolution of the density of dust, which is required to evaluate the limit in equation (7), can also be estimated using a simple model. Throughout the process of galaxy formation, dust is created as stars die and redistribute metals into the interstellar medium (ISM). Dust is also expected to be destroyed either by being bound up in newly formed stars or evaporated by the intense ultraviolet/blue light from OB stars. In general, both processes would be expected to proceed at a rate approximately following the SFR, and so it seems reasonable to assume that
| (10) |
in which is the efficiency of dust formation: that is, if a unit mass of gas is converted into stars, then a fraction of this mass is returned to the ISM in the form of dust grains after a short time. The details of the processing of elements in stars and the retention of metals in stellar remnants are extremely complex, but an efficiency of between and seems reasonable. If we assume that 30 per cent of the material in stars with masses greater than 20 M⊙ is converted into metals and returned to the ISM, then for either a Salpeter IMF, with mass limits of 0.07 and 100 M⊙, or a Kennicutt IMF (Kennicutt 1983), with mass limits of 0.1 and 100 M⊙, 2 per cent of the material processed into stars is returned to the ISM in the form of metals. Note that changing the density of dust in equation (7) by an order of magnitude modifies the lower limit to the dust temperature by only a factor of 1.5.
(a) (b)


Hence, by combining equations (7), (8), (9) and (10) a lower limit to the dust temperature that is required for a self-consistent model can be derived. If this lower limit is less than the redshifted temperature of the CMBR , then clearly the limit is not a practical restriction (Eales & Edmunds 1996). If the lower limit to the dust temperature is calculated assuming that the dust grains are in thermal equilibrium with the CMBR, then a dust temperature of 38 K at low redshifts would correspond to a slightly higher temperature of 40 K at .
4.2 The temperature limit for selected models
The redshift-dependence of the dust temperature limit calculated for all seven models listed in Table 1 that are fitted to the submillimetre-wave data is shown in Fig. 8. In each case . In Fig. 8(a) . With no Population III stars to generate early dust, the lower limit to the temperature exceeds the assumed value of 38 K at redshifts close to in all the models. The consistency breaks down only at redshifts greater than about 8 for the models with . Only a small fraction – less than 10 per cent – of sources in these models are at redshifts greater than 8, as shown by the redshift distributions in Fig. 13. Hence, even this violation of consistency does not invalidate the conclusions of the paper. In Fig. 8(b) a small Population III is included, in which . By seeding the high-redshift gas with heavy elements and dust, this population ensures that all the models are self-consistent.
The self-consistency condition is significant only if a low typical temperature of dust, such as 38 K, is assumed. If a significant fraction of submillimetre-wave sources are heated by AGN rather than high-mass stars, then systematically less dust forms by any epoch, and so the condition would be more difficult to satisfy. In an hierarchical model, a certain fraction of star formation is likely to occur in brief bursts at the epochs of mergers, and so only a fraction of the total mass of dust will be emitting strongly at any epoch. The lower limit to the dust temperature imposed by equation (7) would also increase in this case. In the models of Baugh et al. (1998) less than 20 per cent of stars form in such bursts, but the bursts could be responsible for a larger percentage of submillimetre-wave sources. Either a large population of dusty AGN or hierarchical mergers at high redshifts would make it more difficult to obtain a self-consistent model.
Based on the calculations discussed above all the models listed in Table 1 are self-consistent if a few per cent of star-formation activity occurs in Population III stars. If this population does not exist, then the first generation of stars would not be obscured by dust for a brief period. Nevertheless, even in this case the results in this paper would not be modified by more than about 10 per cent.
5 Results
5.1 Introduction
Here we use the models presented in Section 3 that account for all the available data in the millimetre/submillimetre and far-infrared wavebands to estimate the star formation history in obscured sources, and relate it to the observed consumption rate of neutral gas (Storrie-Lombardi, McMahon & Irwin 1996) and metal enrichment (Pettini et al. 1997) in Lyman- absorbers.
5.2 The star formation history
The star formation histories associated with the models presented in Table 1 are plotted in Fig. 9. Although there is a reasonable scatter in the results that fit the submillimetre-wave data, all the predictions lie within a factor of about 3 of each other over the critical range of redshifts from 2 to 5. The offset between the optically derived points and the submillimetre-derived curves is uncertain to within a factor of about 2. The estimated uncertainties in the values of the fitted parameters listed in Table 1 can shift the curves through a region similar to that enveloped by the curves from model to model. The histories are fully consistent with limits derived from existing background radiation intensities (Blain & Longair 1993b; Burigana et al. 1997).

At low redshifts the average slope of the star formation histories derived here is in good agreement with the form determined from observations of optically selected galaxies. However, there is a clear discrepancy between the two classes of history at high redshifts. The histories cannot be reconciled, even if the properties of the high-redshift, optically selected galaxies are corrected for the estimated dust extinction (Pettini et al. 1998a,b; Calzetti et al. 1995). A further correction to the dust extinction in the ultraviolet-selected samples appears unlikely, and we therefore suggest that the remaining star formation arises in a population of obscured galaxies which are either too red or too faint in the rest frame ultraviolet waveband to be selected by the Lyman-dropout technique (Steidel et al. 1996b). This suggestion can be tested by carrying out optical and near-infrared spectroscopy of submillimetre-selected sources to determine the fraction that lies at high redshifts .
The limited experience so far gained from follow-up observations of sources selected on the grounds of their powerful dust emission at more modest redshifts, IRAS F 10214+4724 (Rowan-Robinson et al. 1991; Close et al. 1995) and SMM J023990136 (SIB; Ivison et al. 1998b), suggests that such sources can be detected and studied in the optical and near-infrared waveband in reasonable integration times. Hence the prospects for following up submillimetre-wave surveys and determining the typical properties of the optical counterparts appear to be quite good. Direct submillimetre-wave observations of the Lyman-break objects on which the optically derived star formation history is based will soon allow us to determine whether or not the extinction corrections inferred from their optical and near-infrared spectra are correct, and thus the contribution of such sources to the population of submillimetre-selected objects.
Another population which may provide a link between the optical and submillimetre views of the distant Universe are the class of extremely red objects (EROs). These have been detected in deep multi-waveband surveys (Graham & Dey 1996; Ivison et al. 1997; Cimatti et al. 1998; Dey et al. 1998), but not in sufficient numbers to be included in the derivation of the points in Fig. 9. Nevertheless, detailed observations of these strongly obscured galaxies may help to unify the two regimes.
5.3 Enrichment
Observations of Lyman- absorbers along the line of sight to distant quasars allow the evolution of the mass of neutral gas and the typical metallicity in the Universe to be traced as a function of epoch (Storrie-Lombardi et al. 1996; Pettini et al. 1997).
5.3.1 Gas consumption and the density parameter in stars
The evolution of the neutral gas content of the Universe has been determined by Storrie-Lombardi et al. (1996). The comoving density parameter of neutral gas appears to peak at a redshift of about 3. When combined with an estimate of the density parameter in the form of stars , measured at the present epoch as (Gnedin & Ostriker 1992), this result can be viewed in the context of the star formation history. In Fig. 10(a) the mass of material that has been processed into stars is derived as a function of epoch using equation (9) for each of the star formation history models listed in Table 1.
The optically derived star formation history, as presented by Madau et al. (1996, 1998) appears to be very consistent with the data presented in Fig. 10(a). With or without dust corrections, that is in the Peak-M or Peak-P model respectively, builds up smoothly and remains approximately constant as a function of epoch to within the errors. The same is true for the Peak-G model. However, the values of predicted by the submillimetre-derived star formation histories are considerably larger. The total density parameter of processed material exceeds the stellar density derived by Gnedin & Ostriker (1992) by a factor of about 5. In fact, the values of determined in the submillimetre-derived models are comparable to the value of . Note, however, that despite this large predicted stellar mass, about half of the total mass is expected to have been processed prior to a redshift of 2 to 3 in all the submillimetre-derived histories. The observed turn-over in the neutral gas fraction and the maximum rate of star formation in these histories are coincident in redshift.
If the background radiation intensity and counts determined in the submillimetre waveband are not in error, then either a large fraction of the baryons in the Universe have been processed into stars, or the process of star formation in the distant sample must be different from that in nearby galaxies, with an initial IMF biased to high-mass stars. A third possibility is that some fraction of the luminosity of distant dusty galaxies could be produced by AGN rather than by high-mass stars.
(a) (b)


First, let us consider the effects of modifying the IMF. If a Salpeter IMF is assumed, with a lower mass limit of 0.07 M⊙, then in all the models listed in Table 1 about 65–70 per cent of all stars formed are still burning at the present epoch. In the submillimetre-derived models this fraction is typically 2–3 per cent smaller than in the optically-derived models, certainly not by enough to account for the factor of about 4 by which exceeds the observed value (Gnedin & Ostriker 1992). If a shallower low-mass IMF is assumed, for example Kennicutt (1983), the fraction of stars still burning is reduced to about 40 per cent. These results are unaffected by the value of the upper mass limit in the IMF. A population of extragalactic stars, not detected by Gnedin & Ostriker, could account for some of the difference. In order to account for a factor of 2.5 discrepancy between the submillimetre-derived star formation histories and Gnedin & Ostriker (1992) that remains after the fraction of 30 per cent of stellar remnants is removed from the curves in Fig. 10(a), a lower mass limit of about 0.7 M⊙ is required in the IMF. This is certainly a plausible scenario: a modified IMF in distant star-forming galaxies could account for these results, and would predict a stellar density at the present epoch for the submillimetre-derived models that is smaller by a factor of 4 compared with that shown in Fig. 10(a). A lower mass limit to the IMF of 3 M⊙ was suggested by Zepf & Silk (1996) in order to explain mass-to-light ratios of elliptical galaxies, and Rieke et al. (1993) interpret observations of M82 using the same cutoff value. The potential variations in the high-redshift IMF are discussed by Larson (1998).
Alternatively, we consider the effects of a population of obscured sources powered by AGN rather than high-mass stars. Such a population almost certainly exists. Both the brightest submillimetre-wave object detected by SIB and the prototype of ultraluminous distant dusty galaxies, IRAS F 10214+4724, contain AGN which must contribute to the heating of dust in these galaxies (Ivison et al. 1998b). In order to match the observed stellar density at the present epoch to that predicted in the models, but without modifying a standard Salpeter IMF, about 60 per cent of the energy emitted by distant submillimetre-selected sources must be generated by AGN. Such a large fraction would require the lower limits to the dust temperatures derived in Section 4 to be increased by a factor of about 20 per cent, but this is not unreasonable. Sanders & Mirabel (1996) report that about a third of ultraluminous galaxies detected by IRAS appear to contain an AGN.
The relative importance of these alternative explanations cannot be determined at present. Optical follow-up observations of submillimetre-selected sources will help to discriminate between the high-mass IMF and AGN models. The application of more advanced chemical enrichment models will also provide useful information when follow-up observations are available (Pei & Fall 1995; Eales & Edmunds 1996, 1997).
5.3.2 Generation of metals
The mass of metals generated in any star-formation history can be calculated using equations (9) and (10). If divided by the solar abundance, assuming that the sun formed out of representative gas at , the abundances of heavy elements are predicted to evolve as shown in Fig. 10(b) for the models listed in Table 1. The data on metal abundances in damped Lyman- systems determined by Pettini et al. (1997) are also plotted. As they noted, the fits to the optically derived counts and the Peak-G model are in full agreement with the data. By contrast, metals appear to be overproduced by a factor of about 5 at redshifts of 2 and 3 in the submillimetre-derived histories. However, in these histories the rate of enrichment shown by the curves in Fig. 10(b) is broadly consistent with the slope interpolated between the three highest redshift data points.
Is this difference in the rate of production of metals significant? Clearly, modifying the low-mass cut-off of the IMF as discussed above will not affect the metal enrichment rate. However, including a more substantial population of AGN-powered obscured sources at high redshifts would delay metal enrichment as compared with a model in which the sources were powered by star formation alone. If AGN outnumbered starbursts by a ratio of 4:1, then the enrichment curves in the submillimetre-selected models in Fig. 10(b) would fall into line with the data. Note that this fraction of AGN is greater than that required to explain the discrepancy between the observed and predicted stellar density in Section 5.3.1.
Alternative arguments could also be used to explain at least some of the excess metal density predicted in the submillimetre-selected models. The observations of damped Lyman- systems, from which the points in Fig. 10(b) are derived, may sample the outer regions of disk systems (Ferguson, Gallagher & Wyse 1998), rather than the highly-enriched cores, and so the metallicity of these systems may be systematically undersampled. In addition, quasars whose line of sight is intersected by the most metal-enriched systems are more likely to be obscured and thus less likely to be included in optically selected samples (Pei & Fall 1995). If this were true, then the data in Fig. 10(b) would tend to be obtained in directions with a systematically low metal density, again under-representing the true smoothed fraction of metals. The metal abundance in intracluster gas observed by the ASCA X-ray observatory is typically about a third of the solar abundance (Gibson, Loewenstein & Mushotzky 1998), a value which lies above the points in Fig. 10(b), perhaps indicating that the global metal abundance at redshifts of 2 to 3 lies closer to the values predicted by the submillimetre-derived models.
5.3.3 Enrichment discussion
The star formation histories in dusty galaxies that account for all of the far-infrared and submillimetre-wave data appear to be inconsistent with observations of and high-redshift metal enrichment. The results depend on the assumed IMF in dusty galaxies, and the optically derived data with which they are compared could well be subject to systematic biases. These biases would tend to lower the measured enrichment at high redshifts, and lead to a global value of enrichment in better agreement with the predictions of the submillimetre-derived models, which we expect to be unaffected by either systematic biases or local effects.
If the optical data is taken at face value, then either an IMF biased to high-mass star formation or a significant fraction, perhaps up to 60 per cent, of distant ultraluminous submillimetre-wave sources must be powered by AGN in order to reconcile the submillimetre-wave and optical data. If the fraction of AGN at high redshifts reached about 60 per cent, then the extinction-corrected star-formation history discussed by Pettini et al. (1998a,b) would account for most of the star-formation activity that has taken place in the Universe.
More detailed follow-up observations of submillimetre-selected sources and detailed stellar and chemical evolution studies will be required in order to disentangle these effects. In particular the fraction of AGN uncovered in follow-up observations of submillimetre-wave surveys will provide a powerful test of these ideas (Ivison et al. 1998b).
5.4 Contamination by AGN
Several circumstantial arguments can be used to illuminate the fraction of the SCUBA galaxies in which the dust is heated by AGN as compared with star formation using existing data.
The proportion of AGN that are missing from optically selected catalogues due to obscuration by dust has been discussed by Fall & Pei (1993). The absorption of the optical emission from AGN by intervening dust is also discussed by Drinkwater et al. (1996). Fall & Pei’s models suggest that the true surface density of quasars with luminosities greater than of order L⊙ at redshifts in the range 2 to 3 – sufficiently luminous to be detected by SCUBA – should be of order 50 deg-2, after correcting for the effects of dust extinction. For comparison the surface density of SCUBA galaxies is about 2000 deg-2.
Based on a radio selection technique, insensitive to the effects of dust absorption, Webster et al. (1995) estimate that 80 per cent of radio-loud quasars are missing from optically selected samples. If the same fraction of radio-quiet quasars is absent, then the surface density of obscured quasars that are sufficiently bright to be detected by SCUBA should be of order 100 deg-2. The results of deep X-ray surveys are also insensitive to the effects of obscuration by dust, and resolve a significant fraction of the X-ray background radiation. In order to account for the background spectrum, a population of dust obscured AGN, which are not detected in optical surveys, must be included in models (Almaini et al. 1997, 1998; Almaini, Lawrence & Boyle 1999). The surface density of faint X-ray sources, which are candidates for this population, is about deg-2 (Jones et al. 1997).
These observations all tend to suggest that the surface density of luminous dust obscured AGN might be typically up to a few tenths of the surface density of SCUBA galaxies, and thus that star-formation activity is responsible for the greater fraction of the submillimetre-wave flux density emitted by the population of SCUBA galaxies. This proportion is consistent with the fraction of compact sources identified with SCUBA galaxies by Smail et al. (1998).
Only one SCUBA-selected source, SMM J023990136, has been subject to detailed follow-up observations (Ivison et al. 1998). While SMM J023990136 certainly contains an AGN, a significant fraction of its luminosity is thought to be produced by massive star formation. The recent detection of redshifted CO(32) emission from SMM J023990136 using the Owens Valley Millimeter Array (Frayer et al. 1998) supports the idea that approximately equal amounts of its luminosity are contributed by star formation activity and an AGN.
If the SCUBA sources are powered predominantly by star formation activity, then a global gas consumption rate of order 0.5 M⊙ yr-1 Mpc-3 is required at redshifts of about 3. This rate can be compared with the predictions of the self-consistent chemical evolution models presented by Pei & Fall (1995). The infall model of Pei & Fall (1995) predicts a very similar consumption rate, and so there is no practical limit to the fraction of the luminosity of SCUBA sources that can be generated by star formation rather than AGN. Detailed multiwaveband follow-up observations will be required to determine the relative importance of AGN and star formation for heating dust in SCUBA galaxies. At present it seems likely that up to about a third of the emission from these sources is powered by AGN, with the remainder due to star formation. Interestingly, this is the fraction of the count of SCUBA galaxies predicted on the basis of the X-ray background and luminosity function by Almaini et al. (1999).
6 The consequences for future observations
The submillimetre-derived star formation histories shown in Fig. 9 correspond to models of galaxy evolution that account for the low-redshift evolution of IRAS galaxies, the observed submillimetre-wave background radiation intensity and the 850-m counts, and predict counts which are in agreement with the limits determined at wavelengths of 2.8 mm and 450 m. The predicted background radiation intensities, source counts and redshift distributions at a wide range of wavelengths are derived in these models and the results are used to discuss the future of submillimetre-wave cosmology. The most promising observations with which to obtain more accurate determinations of the history of obscured star formation are considered.

6.1 Background radiation
Predictions for the intensity of background radiation in the millimetre/submillimetre and far-infrared wavebands derived in the models listed in Table 1 are shown in Fig. 11. Similar spectra are predicted by all the models, regardless of their very different star formation histories. The ensemble of models included in Fig. 11 predicts background intensities of and W m-2 sr-1 at wavelengths of 850 and 450 m respectively. For comparison, the corresponding values reported by Puget et al. (1996) and Fixsen et al. (1998) are , and , W m-2 sr-1 respectively. The form of the background spectrum is therefore not a good quantity with which to discriminate between different models of the star-formation history.
6.2 Source counts
The source counts predicted at wavelengths of 2.8 mm, 1.3 mm, 850 m, 450 m, 175 m, 60 m and 15 m are shown in Fig. 12. The observed counts derived by Wilner & Wright (1997), SIB, Holland et al. (1998b), Kawara et al. (1997), the authors listed in Fig. 5, and Oliver et al. (1997) are also plotted. The predicted abundance of lensed submillimetre-wave galaxies (Blain 1996) is discussed elsewhere (Blain 1998c).
The 15-m counts are included for completeness only. The models used here have little predictive power at wavelengths shorter than about 40 m, and correspondingly the 15-m counts have little predictive power for determining the star formation history at high redshifts. The median redshift of the sources detected by ISO at 15 m is expected to be less than 0.5 (see Fig. 13a). The 15-m counts are uniformly underpredicted by a factor of about 3, about the size of the observation uncertainty. The predicted count curves can be made to traverse the 15-m count error bar shown in Fig. 12(b), by sweeping the value of the high-frequency power-law index in the spectral energy distribution model (see Section 3.2) through the range to . The value of this power-law index has almost no effect on either the source counts or background radiation spectra expected at longer wavelengths.
(a) (b)


(c) (d)


Wavelen- Flux limit gth / m / mJy 15 0.4 0.07–0.13 0.32–0.53 1.2–1.9 60 10 0.07–0.13 0.32–0.53 1.2–1.9 175 100 0.17–1.0 1.1–1.8 1.8–2.7 450 50 1.3–2.0 2.2–3.1 2.8–4.5 850 2 1.7–2.2 2.4–4.4 3.8–8.2 1300 2 1.7–2.7 2.5–5.0 3.8–9.2 2800 2 1.8–3.6 2.5–7.8 4.0–9.8
(a) (b)


(c) (d)


(e) (f)


The spread in the counts predicted across the range of well-fitting models listed in Table 1 offers excellent prospects for discriminating between the models using submillimetre-wave counts determined at a range of flux densities and observing wavelengths. A range of existing and future facilities will be useful for determining counts; Planck Surveyor (Bersanelli et al. 1996), large ground-based millimetre/submillimetre-wave interferometer arrays (Brown et al. 1996; Downes et al. 1996), advanced-technology single-antenna ground-based telescopes (Schloerb 1997; Stark et al. 1998) and FIRST (Pibratt 1997).
6.3 Redshift distributions
The redshift distributions of submillimetre-selected sources at, or just below, the flux density limits of current surveys are shown in Fig. 13. The sensitivity thresholds and the redshift ranges within which the redshift distributions of source in these surveys are expected to be 10, 50 and 90 per cent complete are listed in Table 2. Based on the values listed in Table 2, the median redshift of SIB’s submillimetre-selected sample should be in the range 2.4 to 4.4. This is in broad agreement with constraints obtained from broadband photometry of the optical counterparts by Smail et al. (1998), as well as the first spectroscopic identifications (Ivison et al. 1998b).
The crucial result revealed in Table 2 is that most of the sources detected in submillimetre-wave surveys are likely to lie at redshifts well below 10, and so a large proportion will be accessible to multi-waveband study using 8-m-class telescopes. The advantage of a cluster lens survey, of course, is that in addition to the rich archival data available, the sources are typically magnified by a factor of a few, both in the submillimetre and the optical waveband. Not only does this make it easier to detect these faint sources in the submillimetre waveband, but it also facilitates spectroscopic follow-up observations as compared with a blank-field survey. Blank-field submillimetre-wave surveys have wisely exploited the most carefully surveyed areas of the field sky – the Hubble Deep Field, CFRS fields and Hawaii Deep Survey fields (Hughes et al. 1998; Eales et al. 1998; Barger et al. 1998).
If confirmed by spectroscopic observations, the relatively modest median redshift predicted for submillimetre-selected galaxies would further suggest that they comprise a distinct population of strongly obscured sources that have evaded detection in optical surveys on the grounds of their extreme obscuration rather than their extreme distance.
6.4 Consequences for earlier results
In earlier papers we discussed the first results of our survey (SIB) and the consequences of our detection of a population of distant dusty galaxies for source confusion in existing and future observations (BIS; Blain et al. 1998b). The first results of follow-up observations in other wavebands have also been published (Ivison et al. 1998b). The results presented here reinforce the conclusions presented in these earlier papers, demonstrating that simple well-constrained and self-consistent families of models of the evolution of distant obscured galaxies and quasars can account for all the available data in the millimetre, submillimetre and far-infrared wavebands. A more complete description of the consequences for future surveys lies outside the scope of this paper: see Blain et al. (1998b) and Blain (1998c).
7 Conclusions
We have presented a family of self-consistent models of the evolution of dusty galaxies that account for all the available data in the submillimetre and far-infrared wavebands.
-
1.
The results suggest that the luminosity density emitted in the far-infrared waveband at evolves in a very different way to that inferred from observations in the optical waveband. By integrating our new luminosity densities over all epochs, we find that the total optically-derived volume emissivity (Madau et al. 1996) underpredicts the true value by a factor of about 4. Furthermore, we cannot reproduce the results of submillimetre-wave observations using a volume emissivity that evolves in the same way as the optically derived form. The peak of the comoving submillimetre-derived luminosity density also occurs at a considerably higher redshift than that suggested by optical observations, –5.
-
2.
If our submillimetre-derived star-formation histories are associated with a Salpeter IMF with a lower mass limit of 0.07 M⊙, then the number of low-mass stars at the present epoch and the apparent metallicity at –3 are overproduced by factors of up to about 5.
-
3.
In order to account for the discrepancy in the abundance of low-mass stars, then either the IMF in distant dusty galaxies must have a low-mass cut-off of about 0.7 M⊙, or up to 60 per cent of the energy emitted by distant dusty galaxies must be generated by gravitational accretion in AGN.
-
4.
In order to understand the discrepancy between the metal enrichment at moderate redshifts, either gravitational accretion in AGN must be responsible for a large fraction of the energy emitted by distant dusty galaxies or the current optical observations are subject to considerable selection effects that lead to the underprediction of the metal content at –3.
-
5.
The current evidence suggests that the population of distant luminous submillimetre-selected sources is missing from surveys made in the optical waveband because of their very considerable dust extinction, rather than because they lie at extremely great distances.
Using the results presented in this paper, we can determine the most appropriate strategy for making further progress in understanding the nature of distant dusty galaxies and their relationship with optically-selected distant galaxies:
-
1.
In order to learn more about the evolution of dusty galaxies, measurements of the submillimetre-wave counts at wavelengths longer than 200 m will allow the parameters that define the families of well-fitting models to be determined more accurately. However, it will still not be easy to discriminate between different models within the same family using more accurate counts.
-
2.
In order to address the relationship between sub-millimetre-selected samples and optically selected samples, follow-up optical and near-infrared imaging and spectroscopy of the submillimetre-selected sources will be required. On the basis of our predicted redshift distributions for the submillimetre-selected sources, it seems likely that a significant fraction of the sources will be detectable using the best existing optical and near-infrared instruments.
-
3.
The redshift distribution of submillimetre-selected sources will allow us to discriminate between different members of the same well-fitting family of galaxy formation models that can account for all the submillimetre-wave source count and background radiation data. The determination of a substantially complete redshift distribution is the key goal of follow-up observations during the course of the next year.
-
4.
The optical and near-infrared spectra obtained to derive such a redshift distribution will be crucial for determining the relative importance of star-forming galaxies and AGN in submillimetre-selected samples, and therefore to investigate the apparent discrepancy between the rate of metal enrichment inferred from optical and submillimetre-wave observations.
We now have a consistent picture of the evolution of the submillimetre-wave Universe; however, its relationship to our understanding derived from optical observations remains unclear. Some part of the discrepancy will be explained by the accurate quantification of known selection biases in the optical observations. The crucial information required to investigate the history of star formation in more detail will be provided by larger submillimetre-wave surveys, and, most importantly, by optical and near-infrared follow-up observations of submillimetre-selected sources. If these observations confirm that most submillimetre-selected sources are distant and show no signs of AGN activity, then there is a strong contradiction to investigate.
Acknowledgements
We thank Malcolm Longair, the referee Priya Natarajan, Max Pettini, Richard Saunders, Roberto Terlevich and Neil Trentham for helpful comments on the manuscript. We thank the commissioning team of SCUBA, and Ian Robson for his continuing support and enthusiasm. AWB, IRS and RJI are supported by PPARC.
References
- [blah] Almaini O., Shanks T., Griffiths R. E., Boyle B. J., Roche N., Georgantopoulos I., Stewart G. C., 1997, MNRAS, 291, 372
- [blah] Almaini O., Shanks T., Gunn K. F., Boyle B. J., Georgantopoulos I., Griffiths R. E., Stewart G. C., Blair A. J., 1998, Astron. Nachr., 319, 55 (astro-ph/9711150)
- [blah] Almaini O., Lawrence A., Boyle B. J., 1999, MNRAS, submitted
- [blah] Barger A. J., Cowie L. L., Sanders D. B., Fulton E., Taniguchi Y., Sato Y., Kawara K., Okuda H., 1998, Nat, 394, 248
- [bl] Baugh C. M., Cole S. M., Frenk C. S., Lacey C.G., 1998, ApJ, 498, 504
- [bl] Benford D. J., Cox P., Omont A., Phillipps T. G., 1998, BAAS, 30, 783
- [bl] Bersanelli M. et al., 1996, COBRAS/SAMBA. SCI(96)3, ESA, Paris
- [bl] Bertin E., Dennefeld M., Moshir M., 1997, A&A, 323, 685
- [bl] Biller S. D. et al., 1998, PRL, 80, 2992 (astro-ph/9802234)
- [bl] Blain A. W., 1996, MNRAS, 283, 1340
- [bl] Blain A. W., 1997, MNRAS, 290, 553
- [bl] Blain A. W., 1998a, MNRAS, 295, 92 (astro-ph/9710160)
- [bl] Blain A. W., 1998b, MNRAS, 297, 511 (astro-ph/9801098)
- [bl] Blain A. W., 1998c, in Colombi S., Mellier S. eds, Wide-field surveys in cosmology, Proc. XIV IAP Conference, Editions Frontières, Gif-Sur-Yvette, in press (astro-ph/9806369)
- [bl] Blain A. W., Longair M. S., 1993a, MNRAS, 264, 509
- [bl] Blain A. W., Longair M. S., 1993b, MNRAS, 265, L21
- [bl] Blain A. W., Longair M. S., 1996, MNRAS, 279, 847
- [bl] Blain A. W., Ivison R. J., Smail I., 1998a, MNRAS, 296, L29 (astro-ph/9710003; BIS)
- [bl] Blain A. W., Ivison R. J., Smail I., Kneib J.-P., 1998b, in Colombi S., Mellier Y. eds, Wide-field surveys in cosmology, Proc. XIV IAP Conference, Editions Frontières, Gif-Sur-Yvette, in press (astro-ph/9806063)
- [bl] Blain A. W., Kneib J.-P., Ivison R. J., Smail I., 1998c, ApJ, submitted
- [bl] Boyle B. J., Terlevich R., 1998, MNRAS, 293, L49
- [bl] Brown R. L., 1996, in Bremer M. N., van der Werf P., Röttgering H. J. A., Carilli C. R. eds., Cold Gas at High Redshift, Kluwer, Dordrecht, p. 411
- [bl] Burigana C., Danese L., De Zotti G., Franceschini A., Mazzei P., Toffolatti L., 1997, MNRAS, 287, L17
- [bl] Burles S., Tytler D., 1998, ApJ, 499, 699 (astro-ph/9712108)
- [blah] Calzetti D., Bohlin R. C., Kinney A. L., Storchi-Bergmann T., Heckmann T. M., 1995, ApJ, 443, 136
- [blah] Cimatti A., Andreani P., Röttgering H. J. A., Tilanus R., 1998, Nat, 392, 895
- [blah] Close L. M., Hall P. B., Liu C. T., Hege E. K., 1995, ApJ, 452, L9
- [blah] Cole S. M., Aragón-Salamanca A., Frenk C. S., Navarro J. F., Zepf S. E., 1994, MNRAS, 271, 781.
- [blah] Connolly A. J., Szalay A. S., Dickinson M., SubbaRao M. U., Brunner R. J., 1997, ApJ, 486, L11 (astro-ph/9706255)
- [blah] Cram L. E., 1998, ApJ, 506, L85 (astro-ph/9808228)
- [bl] Dey A., Graham J. R., Ivison R. J., Smail I., 1998, ApJ, submitted
- [bl] Downes D., 1996, in Shaver P. ed., Science with Large Millimetre Arrays. Springer, Berlin, p. 16
- [bl] Drinkwater M. J., Webster R. L., Francis P. J., Wilklind T., Combes F., 1996, Proc. Astron. Soc. Aust., 13, 183
- [bl] Dunlop J. S., 1998, in Bremer M. N., Jackson N., Perez-Fournon I. eds, Observational Cosmology with the New Radio Surveys. Kluwer, Dordrecht, p. 157 (astro-ph/9704294)
- [bl] Dunlop J. S., Peacock J. A., 1990, MNRAS, 247, 19
- [bl] Dwek E., Slavin J., 1994, ApJ, 436, 696
- [bl] Dwek E. et al., 1998, ApJ, in press (astro-ph/9806129)
- [bl] Eales S. A., Edmunds M. G., 1996, MNRAS, 280, 1167
- [bl] Eales S. A., Edmunds M. G., 1997, MNRAS, 286, 732
- [bl] Eales S. A., Lilly S. J., Gear W. K., Dunne L., Bond J. R., Hammer F., Le Fèvre O., Crampton D., 1998, ApJL, submitted (astro-ph/9808040)
- [bl] Fall S. M., Pei Y. C., 1993, ApJ, 402, 479
- [bl] Ferguson A. M. N., Gallagher J., Wyse R. F. G., 1998, AJ, 116, 673 (astro-ph/9805166)
- [blah] Fixsen D. J. et al. 1994, ApJ, 420, 457
- [blah] Fixsen D. J., Cheng E. S., Gales J. M., Mather J. C., Shafer R. A., Wright E. L., 1996, ApJ, 473, 576
- [blah] Fixsen D. J., Dwek E., Mather J. C., Bennett C. L., Shafer R. A., 1998, ApJ, in press (astro-ph/9803021)
- [blah] Frayer D. T., Brown R. L., 1997, ApJS, 113, 221
- [blah] Frayer D. T., Ivison R. J., Scoville N. Z., Yun M. S., Evans A. S., Smail I., Blain A. W., Kneib J.-P., 1998, ApJ, 506, L7 (astro-ph/9808109)
- [blah] Gallego J., Zamorano J., Aragón-Salamanca A., Rego M., 1996, ApJ, 459, L43
- [blah] Gibson B. K., Loewenstein M., Mushotzky R. F., 1998, MNRAS, 290, 623
- [blah] Gnedin N. Y., Ostriker J. P., 1992, ApJ, 400, 1
- [blah] Goldschmidt P. et al., 1997, MNRAS, 289, 465
- [blah] Graham J. R., Dey A., 1996, ApJ, 471, 720
- [blah] Gregorich D. T., Neugebauer G., Soifer B. T., Gunn J. E., Hertler T. L., 1995, AJ, 110, 259
- [blah] Gronwall C., 1998, in Thuan T. X. et al. eds, Dwarf galaxies and cosmology. Proc. XVIII Moriond meeting, Editions Frontières, Gif-sur-Yvette, in press (astro-ph/9806240)
- [blah] Guiderdoni B., Bouchet F. R., Puget J.-L., Lagache G., Hivon E., 1997, Nat, 390, 257
- [blah] Hacking P. B., Houck J. R., 1987, ApJS, 63, 311
- [blah] Hammer F., Flores H., 1998, in Thuan T. X. et al. eds, Dwarf galaxies and cosmology. Proc. XVIII Moriond meeting, Editions Frontières, Gif-sur-Yvette, in press (astro-ph/9806184)
- [blah] Hauser M. G., 1996, in Kafatos M., Kondo Y. eds, Examining the Big Bang and Diffuse Background Radiations. Proc. IAU 168, Kluwer, Dordrecht, p. 99
- [blah] Hauser M. G. et al., 1998, ApJ, in press (astro-ph/9806167)
- [bl] Hewett P. C., Foltz C. B., Chaffee F. H., 1993, ApJ, 406, L43
- [bl] Holland W. S. et al., 1999, MNRAS, in press (astro-ph/9809122)
- [bl] Holland W. S. et al., 1998, Nat, 392, 788
- [bl] Hughes D. H., 1996, in Bremer M. N., van der Werf P. P., Röttgering H. J. A., Carilli C. L. eds, Cold Gas at High Redshift. Kluwer Dordrecht, p. 311
- [bl] Hughes D. H. et al., 1998, Nat, 394, 241 (astro-ph/9806297)
- [bl] Ivison R. J., Archibald E. N., Dey A., Graham J. R., 1997, in Wilson A. ed., The Far-Infrared and Submillimetre Universe. ESA publications, Noordwijk, p. 281
- [bl] Ivison R. J. et al., 1998a, ApJ, 494, 211 (astro-ph/9709124)
- [bl] Ivison R. J., Smail I., Le Borgne J.-F., Blain A. W., Kneib J.-P., Bézecourt J., Kerr T. H., Davies J. K., 1998b, MNRAS, 298, 583 (astro-ph/9712161)
- [bl] Jones L. R. et al., 1997, MNRAS, 285, 547
- [bl] Kawara K. et al., 1997, in Wilson A. ed., The Far-Infared and Submillimetre Universe. ESA publications, Noordwijk, p. 285
- [bl] Kennicutt R. C., 1993, ApJ, 272, 54
- [bl] Lagache G. et al., 1998, in Colombi S., Mellier Y. eds, Wide-field surveys in cosmology, Proc. XIV IAP Conference, Editions Frontières, Gif-Sur-Yvette, in press
- [bl] Larson R. B., 1998, MNRAS, in press (astro-ph/9808145)
- [bl] Lilly S. J., Le Fèvre O., Hammer F., Crampton D., 1996, ApJ, 460, L1
- [bl] Madau P., Ferguson H. C., Dickinson M. E., Giavalisco M., Steidel C. C., Fruchter A., 1996, MNRAS, 283, 1388
- [bl] Madau P., Della Valle M., Panagia N., 1998, MNRAS, 297, L17
- [bl] Mazzarella J. M., Balzano V. A., 1986, ApJS, 62, 751
- [bl] Mushotzky R. F., Loewenstein M., 1997, ApJ, 481, L63
- [bl] Oliver S. J., Rowan-Robinson M., Saunders W., 1992, MNRAS, 256, 15P
- [bl] Oliver S. J. et al. 1997, MNRAS, 289, 471
- [bl] Pearson C., Rowan-Robinson M., 1996, MNRAS, 283, 174
- [bl] Pei Y. C., Fall S. M., 1995, ApJ, 454, 69
- [bl] Pettini M., Smith L. J., King D. L., Hunstead R. W., 1997, ApJ, 486, 665
- [bl] Pettini M., Kellogg M., Steidel C. C., Dickinson M., Adelberger K. L., Giavalisco M., 1998a, ApJ, in press (astro-ph/9806219)
- [bl] Pettini M., Steidel C. C., Adelberger K. L., Kellogg M., Dickinson M., Giavalisco M., 1998b, in Shull J. M., Woodward C. E., Thronson H. A. eds, Cosmic Origins: evolution of galaxies, stars, planets and life. Astr. Soc. Pac., San Francisco, p. 67 (astro-ph/9708117)
- [bl] Phillipps T. G., 1997, in Wilson A. ed., The far-infrared and submillimetre universe. ESA publications, Noordwijk, p. 223
- [bl] Pilbratt G., 1997, in Wilson A. ed., The Far-Infrared and Submillimetre Universe. ESA publications, Noordwijk, p. 7
- [blah] Puget J.-L., Abergel A., Bernard J.-P., Boulanger F., Burton W. B., Désert F.-X., Hartmann D., 1996, A&A, 308, L5
- [bl] Rieke G. H., Loken K., Rieke M. J., Tamblyn P., 1993, ApJ, 412, 99
- [bl] Rowan-Robinson M., Hughes J., Vedi K., Walker D. W., 1990, MNRAS, 246, 273
- [bl] Rowan-Robinson M. et al., 1991, Nat, 351, 719
- [bl] Rowan-Robinson M. et al., 1997, MNRAS, 289, 490
- [bl] Sanders D. B., Mirabel I. F., 1996, ARA&A, 34, 749
- [bl] Saunders W., Rowan-Robinson M., Lawrence A., Efstathiou G., Kaiser N., Ellis R. S., Frenk C. S., 1990, MNRAS, 242, 318
- [bl] Savage B. D., Sembach K. R., 1996, ARA&A, 34, 279
- [blah] Schlegel D. J., Finkbeiner D. P., Davis M., 1998, ApJ, 500, 525 (astro-ph/9710327)
- [blah] Schloerb F. P., 1997, in Latter W. B., Radford S. J. E., Jewell P. R., Mangum J. G., Bally J. eds, 25 years of millimeter spectroscopy. Proc. IAU 170, Kluwer, Dordrecht, p. 221
- [blah] Shupe D. L. et al., 1998, in McLean B. J., Golombek D. A., Hayes J. J. E., Payne H. E. eds, New horizons with multi wavelength sky surveys. Proc. IAU 179, Kluwer, Dordrecht, p. 118
- [blah] Smail I., Ivison R. J., Blain A. W., 1997, ApJ, 490, L5 (SIB)
- [blah] Smail I., Ivison R. J., Blain A. W., Kneib J.-P., 1998, ApJ, 507, L21 (astro-ph/9806061)
- [blah] Smail I. et al, 1999, in preparation
- [blah] Stark A. A., Carlstrom J. E., Israel F. P., Menten K. M., Peterson J. B., Phillips T. G., Sironi G., Walker W. W., 1998, in Phillips T. G. ed., Advanced Technology MMW, Radio and Terahertz telescopes. Proc. SPIE vol. 3357, SPIE, Bellingham, p. 495 (astro-ph/9802326)
- [bl] Steidel C. C., Giavalisco M., Dickinson M., Adelberger K. L., 1996a, AJ, 112, 352
- [bl] Steidel C. C., Giavalisco M., Dickinson M., Pettini M., Dickinson M., Adelberger K. L., 1996b, ApJ, 462, L17
- [xx] Storrie-Lombardi L. J., McMahon R. G., Irwin M. J., 1996, MNRAS, 283, L79
- [xx] Thronson H., Telesco C., 1986, ApJ, 311, 98
- [xx] Tresse L., Maddox S. J., 1998, ApJ, 495, 691
- [xx] Treyer M. A., Ellis R. S., Milliard B., Donas J., Bridges T. J., 1998, MNRAS, 300, 303
- [xx] Webster R. L., Francis P. J., Peterson B. A., Drinkwater M. J., Masci F. J., 1995, Nat, 375, 469
- [bl] Wilner D. J., Wright M. C. H., 1997, ApJ, 488, L67
- [bl] Wright E. L. et al. 1994, ApJ, 420, 450
- [bl] Xu C. et al., 1998, ApJ, in press (astro-ph/9806194)
- [bl] Zepf S. E., Silk J. E., 1996, ApJ, 466, 114