The Relationship Between Galaxies and Low Redshift Weak Lyman Absorbers in the Directions of H 1821+643 and PG 1116+21511affiliation: Based on observations obtained with the WIYN Observatory, which is a joint facility of the University of Wisconsin, Indiana University, Yale University, and the National Optical Astronomy Observatories. 22affiliation: Based on observations with the NASA/ESA Hubble Space Telescope, obtained at the Space Telescope Science Institute, which is operated by the Association of Universities for Research in Astronomy, Inc., under NASA contract NAS 5-2555.
Abstract
To study the nature of low Ly absorbers in the spectra of QSOs, we have obtained high signal-to-noise UV spectra of H 1821+643 ( = 0.297) and PG 1116+215 ( = 0.177) with the Goddard High Resolution Spectrograph on the Hubble Space Telescope. The spectra have minimum S/N 70-100 and 3 limiting equivalent widths of 50-75 mÅ at a resolution of 150 km s-1. Excluding lines within 3000 km s-1 of , we detect 26 Ly lines with 50 mÅ toward H 1821+643 and 13 toward PG 1116+215 (comparable to the 13 Ly lines observed toward 3C 273 by Morris et al.), which implies a density of 10216 lines per unit redshift for 50 mÅ and 0.28. The two-point velocity correlation function shows marginal evidence of clustering of Ly lines on 500 km s-1 scales, but only if the weakest lines are excluded.
We have also used the WIYN Observatory to measure galaxy redshifts in the fields centered on each QSO in order to study the relationship between the Ly absorbers and galaxies. We find 17 galaxy-absorber pairs within projected distances of 1 Mpc with velocity separations of 350 km s-1 or less. Monte Carlo simulations show that if the Ly lines are randomly distributed, the probability of observing this many close pairs on the two sight lines is 3.6. We find that all galaxies with projected distances 600 kpc from the QSO sight lines have associated Ly absorbers within 1000 km s-1, and the majority of these galaxies have absorbers within 350 km s-1. We also find that the Ly equivalent width is anticorrelated with the projected distance of the nearest galaxy out to at least 600 kpc. For 600 kpc, we find galaxies which do not have associated Ly lines, but nevertheless the anticorrelation persists if we select galaxies with 2 Mpc which are within 500 or 1000 km s-1 of a Ly absorber. This anticorrelation has a high significance but should be interpreted cautiously because there are potential selection biases which could lead to an artificial correlation. Statistical tests also show that the Ly absorbers are not randomly distributed with respect to the galaxies. Splitting the sample into roughly equal sets with 100 mÅ and 100 mÅ shows that the weakest absorbers are not randomly distributed either. Comparison of the nearest neighbor distances of the weaker and stronger absorbers suggests that the weakest absorbers are less closely associated with galaxies, but the difference is not yet statistically significant. We find several galaxy groups which do not have clearly associated Ly absorbers. However, given the projected distance of the nearest galaxy, we do not necessarily expect to find detectable Ly lines in these groups based on the equivalent width-projected distance anticorrelation. Furthermore, we find several counterexamples of comparable galaxy groups which do have associated Ly lines. As in previous studies, we find some Ly absorbers in regions apparently devoid of galaxies, although this may be due to the limited spatial extent and/or limited depth of the redshift survey. The equivalent width distributions of the absorbers apparently in voids and non-void absorbers are statistically indistinguishable, but the sample is small. We discuss the nature of the Ly absorbers in light of the new data. The observations are consistent with the hypothesis that many of the low redshift Ly absorption lines with rest equivalent widths in the range from 50 to 500 mÅ trace the overall gas distributions in the large scale structures of galaxies rather than the gaseous halos of individual galaxies. Other phenomena may also cause Ly absorption lines.
.
1. Introduction
The ubiquitous H I Lyman lines detected in the spectra of QSOs trace an important gaseous component of the universe. Typically hundreds of Ly forest lines are detected between the Ly and Ly QSO emission lines in a high resolution spectrum of a single high QSO (e.g., Hu et al. 1995; Lu et al. 1996; Kirkman & Tytler 1997), and recent computations suggest that these H I absorbers contain a substantial fraction of the baryons in the universe at high and low redshifts (e.g., Shull et al. 1996; Miralda-Escudé et al. 1996; Rauch et al. 1997; Weinberg et al. 1997; Bi & Davidsen 1997). Cosmological simulations of structure formation suggest that at high redshift, the Ly absorption lines trace the gas in large scale structures in between collapsed objects (Cen et al. 1994; Petitjean, Mücket, & Kates 1995; Miralda-Escudé et al. 1996; Hernquist et al. 1996; Zhang et al. 1997,1998). The Ly forest lines therefore provide a critical constraint on cosmological models as well as important clues about the formation and evolution of galaxies and large scale structures (i.e., voids, galaxy clusters, and galaxy superclusters). However, to make progress on this important topic and take advantage of the Ly lines as a sensitive probe of cosmic phenomena from = 0 to = 5, a better understanding of the nature of the absorbers is needed.
The advent of the Hubble Space Telescope (HST) has provided important new insights about the Ly absorbers and an opportunity to directly study the relationship between the Ly absorption lines and galaxies. Spectroscopy of 3C 273 with HST in the first cycle of observations revealed that there are considerably more Ly lines at low redshift than expected based on a simple extrapolation of the observed evolution of the number of lines per unit redshift () at high (Morris et al. 1991; Bahcall et al. 1991). Subsequently, Morris et al. (1993) carried out a redshift survey of galaxies brighter than 19 within 1∘ of 3C 273 to study the relationship of the absorbers with galaxies, and they found no galaxies within a projected distance of 230 kpc of any of the thirteen lines toward 3C 273 with rest frame equivalent width exceeding 50 mÅ. In fact, one Ly line in the Morris et al. (1993) sample turned out to be 4.8 Mpc (projected) from the nearest bright galaxy. However, based on various statistical tests, Morris et al. (1993) conclude that the absorbers are not randomly distributed with respect to the galaxies though the absorber-galaxy correlation is not as strong as the galaxy-galaxy correlation. In a similar program, Stocke et al. (1995) and Shull, Stocke, & Penton (1996) used the HST to search for Ly lines in the CfA and Arecibo redshift survey regions, and they find no galaxies within 450 kpc of the 10-11 Ly absorbers they discovered, and 3 or 4 of their Ly lines are found in galaxy voids (the fourth is a tentative detection). Overall, however, the majority of the Stocke et al. and Shull et al. Ly absorbers are located within large scale galaxy structures supporting the statistical conclusions of Morris et al. (1993).
In striking contrast to the results of Morris et al. and Stocke et al., Lanzetta et al. (1995) have measured the redshifts of galaxies within 13 of six QSOs observed for the HST QSO Absorption Line Key Project (Bahcall et al. 1993), and they find that between 32(10)% and 60(19)% of the Ly lines in their sample are associated with luminous galaxies within 160 kpc of the QSO sight lines, which suggests that a significant fraction of the clouds arise in large gaseous halos of intervening galaxies. Furthermore, Lanzetta et al. report that the Ly line equivalent widths are anticorrelated with the intervening galaxy’s projected distance from the QSO sight line. These conclusions appear to be in conflict with the findings of Morris et al. (1993) and Stocke et al. (1995). However, it may be possible to reconcile these discordant results. The Lanzetta et al. sample is sensitive only to strong Ly lines with 300 mÅ while the samples of Morris et al. (1993) and Stocke et al. (1995) are dominated by much weaker lines with 200 mÅ. Based on this line strength difference it has been suggested that there are two populations of Ly absorbers at low redshift: (1) strong Ly absorbers with (H I) cm-2 (corresponding to 300 mÅ for Doppler parameter 35 km s-1) that mostly occur in large gaseous halos of luminous galaxies, and (2) weaker Ly absorbers with (H I) cm-2 which are less closely tied to galaxies and may in some cases be truly intergalactic (primordial?) gas clouds. Currently this suggestion cannot be rigorously tested, however, because the sample of weaker Ly lines is rather small; there are no more than 28 weak Ly lines in the combined samples of Morris et al. (1993), Stocke et al. (1995), and Shull et al. (1996). Recently, Grogin & Geller (1998) have reanalyzed the Morris et al. and Stocke/Shull et al. data with additional redshifts for 3C 273, and they conclude that the Ly absorbers on these sight lines are randomly distributed with respect to galaxies. Evidently the nature of the low z Ly absorbers is still an open question.
To elucidate the nature of low redshift weak Ly absorbers, we initiated a program in 1995 to study the relationship between low Ly absorption line systems and galaxies in the directions of three QSOs using the HST Goddard High Resolution Spectrograph (GHRS), the Space Telescope Imaging Spectrograph (STIS), and the WIYN multiobject fiber-fed spectrograph (HYDRA). To significantly improve the size of the sample of weak Ly lines, we designed the observations to obtain spectra adequate for detection of Ly lines with = 50 mÅ at the 3 level. The WIYN HYDRA is used to measure the redshifts of bright galaxies in 1∘ fields centered on the QSOs. In this paper we present a study of the relationship between Ly clouds and galaxies in the directions of H 1821+643 ( = 0.297) and PG 1116+215 ( = 0.177). These QSOs have been observed previously with the HST Faint Object Spectrograph (FOS, Bahcall et al. 1992,1993; Jannuzi et al. 1998), but the FOS spectra are not adequate for detecting weak Ly lines; their 4.5 limiting equivalent widths are generally greater than 250 mÅ throughout most of the Ly cloud region. The third sight line for our program will be observed with STIS in Cycle 7.
The paper is organized as follows. In §2 we review the GHRS observations and data reduction and present the UV spectra. We also summarize the WIYN observations and data reduction in this section. We discuss the absorption line selection and identification in §3. The properties of the Ly clouds are examined in §4, and the relationship between the Ly absorbers and galaxies is analyzed in §5. A discussion of the results and the nature of the Ly absorbers is given in §6. An overall summary of our investigation is provided in §7. Further details on this project can be found in Tripp (1997). Throughout the rest of this paper we assume = 75 km s-1 Mpc-1 and = 0, and we rescale measurements from the literature to these values for the cosmological parameters.
2. Observations and Data Reduction
2.1. GHRS Spectroscopy - H 1821+643
H 1821+643 was observed for 5.1 hours with the GHRS on March 29, 1996. Standard target acquisition procedures were used to center the target in the large science aperture (1.74”1.74”), and the QSO was observed with the G140L grating. These observations were obtained after the installation of COSTAR,111Corrective Optics Space Telescope Axial Replacement and the spectra have resolution 2000 with a spectral spread function approximately described by a narrow Gaussian profile containing 70% of the line profile area and a broader profile containing 30% of the area (see Figure 4 in Robinson et al. 1998). In velocity units the resolution (FWHM) ranges from 160 km s-1 at 1250 Å to 130 km s-1 at 1540 Å. Half-diode substepping was employed, which samples the GHRS spectral line spread function with 1.2 diodes/FWHM. With this substepping pattern (step pattern 4), 11% of the observing time is used for measuring the background with the science diodes. For accurate wavelength calibration, a Pt-Ne lamp was observed briefly at 1.7 hour intervals. The grating was positioned to provide complete wavelength coverage from 1252–1528 Å. Combined with the earlier intermediate resolution (15-20 km s-1) GHRS observations obtained by Savage et al. (1995), which included the 1231.7–1268.9 and 1521.2–1557.5 Å wavelength ranges, this allowed us to search for all Ly clouds between = 0.013 and = 0.281. Since the QSO systemic redshift is = 0.297, these spectra cover all but a small fraction of the Ly forest on this sight line. The FOS data obtained by Bahcall et al. (1992) can be used to fill in the missing redshift range, but their spectrum is not adequate for detection of the Ly lines with 250 mÅ. Bahcall et al. (1992) do not report detection of any Ly lines at 0.013, but they do detect a strong Ly line at = 0.297, and a strong Ly line is present at this redshift in our GHRS spectrum.
The signal-to-noise ratio of high quality GHRS observations is ultimately limited by fixed pattern noise (FPN) due to scratches and manufacturing marks on the detector window and response irregularities of the photocathode. The detector diodes also introduce fixed pattern noise due to diode-to-diode sensitivity differences, but this noise is effectively reduced by comb addition and is generally weaker than the FPN due to the photocathode and faceplate. To reduce the fixed pattern noise, comb addition and the “FP- SPLIT” procedure were employed for the H 1821+643 observations. The FP- SPLIT procedure breaks an observation into subexposures and tilts the grating slightly between subexposures so that the position of the spectrum on the photocathode is shifted. When the subexposures are coadded in wavelength space, the FPN is smeared out and hence reduced. Typically subexposures at four different grating tilts are obtained when the FP-SPLIT procedure is used, and S/N 150 can be achieved when the subexposures are coadded (Cardelli & Ebbets 1994). To obtain higher S/N, the fixed pattern noise spectrum (i.e., the flat field) must be derived from the FP-SPLIT subexposures and divided into the data. To prevent loss or degradation of data in case of HST glitches or orbital interrupts (c.f. Cardelli & Ebbets), sets of four FP-SPLIT subexposures were read out roughly every four minutes, and a large number of subexposures at each of the four FP-SPLIT positions were obtained over the course of five hours.
The preliminary data reduction was carried out at the GHRS computing facility at the Goddard Space Flight Center with the standard CALHRS software. This included spectrum extraction and conversion to count rates, corrections for paired pulse events, background subtraction, and wavelength calibration. Software developed at the University of Wisconsin was then used to merge the individual subexposures and explore the usefulness of the fixed pattern noise flatfielding. Due to non-repeatability of the grating carousel rotation, slight positioning errors occur every time the grating is rotated, and degradation of resolution occurs if it is assumed that the grating was rotated by exactly the instructed amount for merging of subexposures. To achieve the highest possible resolution, the centroids of well-detected and narrow absorption lines in the individual FP-SPLIT subexposures are calculated and used to determine the shifts for merging. Finally, the zero point in the wavelength scale was determined by comparing the wavelengths of Galactic interstellar absorption lines in the G140L spectrum to their known wavelengths derived from the high resolution interstellar absorption line study of Savage et al. (1995)222In some cases the Milky Way interstellar lines are significantly blended in our low resolution spectrum but are resolved in the higher resolution spectrum. These cases are not suitable for determining the scale zero point and were not used for this purpose.. Savage et al. also measured accurate wavelengths of the H I Ly line at = 0.22489 and the O VI 1031.93 Å line at = 0.22503 (see also Savage, Tripp, & Lu 1998), so these lines were also used to determine the mean wavelength zero point. We estimate that the H 1821+643 G140L observations have an absolute velocity uncertainty of 30 km s-1, which corresponds to a redshift uncertainty of 0.0001.
The H 1821+643 G140L observation is close to the S/N regime where application of a FPN correction may be beneficial (see §3). After merging the data into four “master” FP-SPLIT subexposures (i.e., all FP-SPLIT subexposures at the same position on the photocathode combined) we used the method of Cardelli & Ebbets (1994) to derive and apply the FPN correction. The final FPN corrected spectrum of H 1821+643 is shown in Figure 1 where the observed count rate is plotted against heliocentric wavelength (in Å). Note that at 1251.6 Å and at 1537.9 Å, the spectrum falls off the end of the diode array in some of the FP-SPLIT subexposures and consequently the S/N is lower in these regions. Since these spectral regions have already been observed by Savage et al. (1995) at higher resolution, their only purpose in the G140L spectrum is to provide better constraints on the continuum placement. This is important at the short end of the G140L spectrum where the continuum rises (see Figure 1); without the spectrum extention a significantly different continuum fit could be selected. The final S/N ranges from 100 to 160 per resolution element. The combined S/N and resolution are adequate for detection of 50 mÅ lines at the 3 level or better throughout the G140L spectrum.
2.2. GHRS Spectroscopy - PG 1116+215
PG 1116+215 was observed for 3.5 hours with the GHRS on 4 February 1997. The observational setup and data reduction procedure were nearly identical to the H 1821+643 observation and reductions, but quarter-diode substepping (step pattern 5) was used to provide more on-target exposure time and less (but still ample) time spent measuring the background. After the PG 1116+215 observations were fully reduced (including the FPN correction), the data were binned to half-diode samples to improve the S/N and match the H 1821+643 data. The final FPN corrected and half-diode binned spectrum of PG 1116+215 is plotted in Figure 3. While H 1821+643 was actually brighter than expected when we observed it with the GHRS G140L grating, PG 1116+215 was apparently fainter than expected based on previous IUE and HST measurements. Consequently, the count rate was lower than expected. The S/N ( 75-160 per resolution element) of the PG 1116+215 GHRS G140L spectrum is adequate for detection of 75 mÅ lines at the 3 level or better throughout the entire spectrum and at the 50 mÅ level for 1400 Å. A special zero point velocity correction was not applied to the PG 1116+215 observations. The weak interstellar lines of S II and Ni II (see §3.1.2) have average heliocentric velocities of 17 km s-1 while H I 21 cm emission in the direction of PG 1116+215 has an average heliocentric velocity of -20 km s-1 (Lockman & Savage 1995). Some of this difference could be due to the pronounced positive velocity wing of H I emission seen in the 21 cm profile. We estimate that the PG 1116+215 G140L spectrum has an absolute velocity uncertainty of 50 km s-1, which corresponds to a redshift uncertainty of 0.0002.
2.3. WIYN Galaxy Redshift Measurements
To study the relationship between the Ly absorbers and galaxies in the directions of H 1821+643 and PG 1116+215, we have conducted a survey of galaxy redshifts in the fields centered on the QSOs using the fiber-fed multiobject spectrograph (HYDRA) on the WIYN telescope. The galaxy targets were selected primarily from (1) eleven 67 67 images in Harris R clustered around H 1821+643 acquired with the WIYN imager in July 1995, and (2) 1 images obtained with the KPNO Schmidt telescope by B. Jannuzi & R. Green (1995, private communication). For H 1821+643, a few additional targets from the POSS II database were observed to extend the angular coverage at the lowest redshifts. Objects in the WIYN and Schmidt images were selected and classified as stars or galaxies by B. Jannuzi and A. Tanner using FOCAS (Tyson & Jarvis 1979; Valdes 1982). Our original objective was to measure the redshifts of all galaxies brighter than 19 in the 1∘ fields centered on the QSOs (estimates of completeness of the final sample are provided below). However, a galaxy redshift sample complete to 19 will not provide many redshifts with 0.2. Since the H 1821+643 sight line probes Ly clouds out to = 0.297, we obtained the WIYN images for a deeper redshift survey near the center of the QSO field.
A full description of the WIYN observations and data reduction will be provided in a separate paper (Tripp et al. 1998); here we provide a summary. The observations were carried out on several observing runs between August 1995 and April 1997. For all runs we used the Simmons camera with the 400 line mm-1 “blue” grating and a Tektronics 20482048 CCD (T2KC). For most of the runs we used the red fibers which subtend 2” on the sky. However, on one of the early runs we used the blue fibers which subtend 3”. This setup provided a resolution of 4.6 Å (300 km s-1) with the red fibers or 7.1 Å ( 450 km s-1) with the blue fibers. To include the Ca II H & K lines at = 0, the grating was positioned to provide spectra extending from 3900 to 7100 Å. We typically observed 60-75 candidate galaxies per setup with 10-30 fibers positioned on the sky. Three 50 minute exposures were obtained for each fiber configuration. Targets were given priority based on brightness and proximity to the QSO. Due to fiber positioning constraints, in some setups not all of the fibers could be placed on new targets, so previously observed galaxies were reobserved to improve the S/N. Spectra of objects observed in multiple setups were coadded to obtain the final redshift, but the individual spectra were also measured to test the reliability and uncertainties of the redshift measurements (see Tripp et al.1998).
The data were reduced with IRAF333IRAF is distributed by the National Optical Astronomy Observatories, which are operated by AURA, Inc., under contract to the NSF. using the DOHYDRA package. We then used the standard method of Tonry & Davis (1979) to determine the galaxy redshifts by cross-correlating the target spectra with spectra of “templates”, i.e., high S/N galaxy spectra with known redshifts, after masking out any emission lines or night sky residuals and passing both the target and the templates through a Fourier bandpass filter. We used six templates for the cross-correlation measurements. The first template is a spectrum of M32 observed with HYDRA with one of the central fibers in the slit (which have the highest throughput) and reduced in an identical fashion to the target data reductions. The heliocentric velocity of M32 is –209 km s-1 (de Vaucouleurs et al. 1991). The other templates are actual targets in the H 1821+643 and PG 1116+215 fields for which we obtained high S/N spectra, and the heliocentric velocities of these templates were established by cross-correlation with the M32 spectrum. The templates were intentionally selected to have a range of redshifts to check the reliability of the cross-correlation redshifts in marginal cases. For emission line galaxies, the redshifts were measured using templates with absorption lines and night sky residuals masked out.
The galaxy redshifts measured in the fields of H 1821+643 and PG 1116+215 are summarized in Tables 1 and 2, respectively. We also list in these tables the POSS II magnitudes (denoted since is roughly equivalent to ) and impact parameters (projected distances from the sight line) for each galaxy. The POSS II magnitudes have rms errors of 0.21 magnitudes (Weir, Djorgovski, & Fayyad 1995). Since CCD calibration of the POSS II magnitudes was not available for these fields, we determined the magnitude zero-point by comparison to the measurements of Kirhakos et al. (1994). Absolute magnitudes calculated using the interstellar extinction corrections based on from Lockman & Savage (1995) and the K-correction from Peebles (1993) are also provided in Tables 1 and 2. We have measured 98 redshifts in the field of H 1821+643 and 118 redshifts in the field of PG 1116+215. For H 1821+643, we have obtained 56 additional redshifts from Schneider et al. (1992), Le Brun, Bergeron, & Boissé (1996), and Bowen, Pettini, & Boyle (1998), bringing the grand total to 154. These additional redshifts and the other quantities when known are listed at the end of Table 1. The listed redshifts are on a heliocentric basis. In the direction of H 1821+643, (Galactocentric) - (heliocentric) = 0.0009, while toward PG 1116+215, (Galactocentric) - (heliocentric) = -0.0003.
Table 3 provides estimates of the completeness of the PG 1116+215 galaxy redshift survey for various limiting magnitudes out to various radii based on the number of galaxy candidates in the Schmidt catalog and the number of redshifts actually obtained. It will be important to consider the impact of the angular coverage of the galaxy redshift survey (at low redshifts) and its limited depth (at high redshifts), so we also list in Table 3 the redshifts at which = 17, 18, 19, and 20 correspond to a 1 galaxy [using = –19.5 from Loveday et al. (1992)] and the physical scale corresponding to a 10’, 20’, and 30’ radius at each of these redshifts. For example, based on the Schmidt catalog of targets within 20’ of the QSO, we estimate that the PG 1116+215 survey is 86.9% complete for 19.0. = 19 corresponds to a 1 galaxy, and 20’ corresponds to 2.4 Mpc, at 0.121. The PG 1116+215 target list contained very little stellar contamination; only six observed targets turned out to be stars. Unfortunately, the H 1821+643 catalog suffered much more severe stellar contamination; 64 observed candidates turned out to be stellar (see Tripp et al. 1998). This stellar contamination was partly due to the low latitude and direction of the QSO (4) which causes the sight line to pass over several spiral arms and through the warped part of the outer Milky Way (see Savage et al. 1995), but it was also partly due to the fact that we observed the H 1821+643 field first — experience gained from the H 1821+643 field was used to improve the star/galaxy separation procedure for PG 1116+215. Due to the large number of stars in the target list, estimates of the H 1821+643 survey completeness are more uncertain. If we remove objects which are observed to be stars and objects for which we did not get good spectra but are probably stars (based on magnitude and POSS II classification), then we estimate that within a 20’ radius from the QSO, the H 1821+643 redshift survey is roughly 72.4% complete for 18.0 and 50.8% complete for 20.0. Our survey is substantially more complete than the previous surveys noted above because any redshifts from those surveys which we missed were added to our sample.
Table 1 shows that redshifts have been obtained for a number of galaxies as faint as 21.0 in the H 1821+643 field. Taking = –19.5 and the interstellar extinction and K-corrections described above, we find that 21.0 corresponds to a roughly 0.5 galaxy at = 0.20. Therefore we have not measured redshifts for galaxies fainter than 0.5 beyond 0.2. Furthermore, most of the galaxies at 0.2 for which we have obtained redshifts are in the rich galaxy cluster which hosts the QSO, so our redshift survey is severely incomplete for intervening galaxies at 0.2. Consequently, in our analysis of the relationship between Ly absorbers and galaxies in §5, we shall consider a sample which only includes galaxies and absorbers with 0.2.
3. Absorption Line Selection and Identification
Absorption lines in the H 1821+643 G140L spectrum were selected for further analysis based on the statistical significance of the observed equivalent width . The automated objective procedure described in Tripp et al. (1996) was used to measure the equivalent widths. The errors in the equivalent widths account for continuum placement uncertainty as well as statistical noise. For the lines detected at the level444The significance of the lines typically increases to 4-5 if we only consider statistical noise., the reality of the feature was checked by visually inspecting the four FP-SPLIT subexposures; if the line is apparent in at least three of the subexposures, then the detection is probably reliable and the line was included in the line list. We have measured all of the equivalent widths with and without the fixed pattern noise correction, and for the most part, the FPN correction did not have a significant impact on the equivalent width measurements. However, for a few of the weakest lines the correction was important. Figure 4 shows an example of a 3 absorption line which is completely removed by the FPN correction. Consequently, we elected to apply the correction to all lines in the final sample. Table 4 lists the observed equivalent widths of all reliably detected lines in the H 1821+643 G140L spectrum. Table 4 also lists the heliocentric vacuum wavelength of the centroid of each line, the line identification, the redshift, and, for ISM lines, the heliocentric velocity of the line. For line identification and throughout this paper, we use wavelengths from Morton (1991). Profile fitting was employed to extract the redshifts of the individual features using VPFIT (developed by J. Webb and R. Carswell, see Carswell et al. 1991) and to infer the presence of additional components in some complex absorption blends (see below). Table 5 provides the same information for lines detected in the spectrum of PG 1116+215. The redshift uncertainties from VPFIT are typically 0.0001. Including the uncertainties in the velocity scale (see §§2.1,2.2), we estimate that the total redshift uncertainties are 0.0002.
As noted above, the previous HST observations of H 1821+643 obtained by Bahcall et al. (1992,1993) and Savage et al. (1995) can be used to expand the redshift range probed in this study. Table 6 summarizes the equivalent widths, identifications, and redshifts of extragalactic absorption lines relevant to this study detected in these previous observations. Note that while the Savage et al. observations have a limiting equivalent width similar to that of our G140L spectrum, 50 mÅ at the 3 level, their resolution is considerably better so we prefer the Savage et al. data in cases where the lines are also present in the G140L spectrum.
3.1. Galactic Interstellar Absorption Lines
An important issue in the study of weak Ly lines is possible contamination of the extragalactic line sample by absorption lines due to the ISM of the Milky Way. While the strong ISM lines are easily identified (c.f. Table 4 in Morton, York, & Jenkins 1988), in spectra sensitive to 50 mÅ equivalent widths, a significant number of weaker ISM resonance lines which are less familiar may be detected as well, and these can easily be misidentified as Ly clouds in low resolution spectra. Galactic interstellar lines identified in the GHRS spectra of H 1821+643 and PG 1116+215 are listed in Tables 4 and 5, and absorption profiles of ISM lines of interest are plotted in Figures 5 and 6. In the following two sections we justify the Galactic line identifications.
3.1.1 H 1821+643
In the wavelength range of the G140L spectrum shown in Figure 1, weak interstellar lines of C I and Ni II are of particular concern.
Neutral carbon is not the dominant ionization state of C in warm H I clouds (the ionization potential of C I is 11.3 eV), but nevertheless it has been detected in absorption on interstellar sight lines with low ion column densities comparable to the those observed toward H 1821+643. For example, Lu, Savage, & Sembach (1994) measure = 10417 mÅ for the Galactic C I 1560.31 Å line at low velocity555 Lu et al. (1994) also report detections of S II and weak C I absorption in a Galactic high velocity cloud in the direction of this active galaxy. The high velocity absorption is not included in the equivalent width quoted here. in the spectrum of the Seyfert galaxy NGC 3783. The S II equivalent widths in the low velocity interstellar gas toward NGC 3783 are comparable to the corresponding S II equivalent widths observed toward H 1821+643 (Savage et al. 1995), so comparable C I lines may be expected toward H 1821+643. Our G140L H 1821+643 spectrum does not cover the C I 1560.31 Å multiplet, but it does cover the C I 1277.25, 1280.13, and 1328.83 Å resonance lines. Since the value of , the product of the oscillator strength and wavelength, of the 1277.25 Å line is very similar to of the 1560.31 Å line (Morton 1991), we might expect to see a roughly 100 mÅ C I line due to the ISM in the H 1821+643 spectrum, and indeed a 150 mÅ line is observed at 1277.21 Å (see Figure 1 and Table 4). Figure 5 shows the normalized absorption profiles of the Galactic C I 1277.25, 1280.13, and 1328.83 Å lines (the 1280.13 Å profile is in the same panel as the 1277.25 Å line). For purposes of comparison, we also plot the Milky Way S II 1253.81, Si II 1526.71, and C II 1334.53 Å lines from the G140L spectrum in Figure 5. The -values of the 1280.13 and 1328.83 Å transitions are lower than the 1277.25 -value by factors of 4.0 and 1.6 respectively. The 1280.13 Å line is not detected, but this is not surprising since it has a lower oscillator strength. An absorption feature of moderate strength is present at the expected wavelength of C I 1328.83 Å, but it is blended with the strong H I Ly line at = 0.297 (see Figure 5). It is possible that we have detected the Galactic C I 1277.25 and 1328.83 Å lines. However, the C I 1277.25 Å line is rather broad compared to the strong Galactic ISM lines (Figure 5). There are C I* and C I** transitions near the 1277.25 Å line, but the strongest of these are only separated from C I 1277.2 by 70 km s-1 (see Morton 1991), so this seems an unlikely explanation of the breadth of the 1277.21 Å absorption line. This C I line may be blended with a Ly cloud at 0.05. This is important because a cluster of galaxies is detected near this redshift in the WIYN survey (see §5.2). Higher resolution spectroscopy with STIS will be required to determine if Ly absorption actually contributes to the feature at 1277.21 Å.
Singly ionized nickel also has several weak resonance lines which are likely to be detected in high S/N ISM spectra. In the wavelength range of the G140L H 1821+643 spectrum, the strongest Ni II lines occur at 1317.22, 1370.13, and 1454.84 Å with f-values of 0.1458, 0.1309, and 0.05954 (Morton 1991). Figure 5 shows the normalized absorption profiles of these Ni II lines; all three of the lines are well-detected in the G140L spectrum of H 1821+643. From Figure 5 we see that the profiles of the Ni II 1317.22 and 1370.13 Å lines appear to have complex component structure with a main component at the velocity of the other ISM lines and weaker absorption extending from roughly –400 km s-1 to +400 km s-1. Since the weak component structure appears in both profiles, one is tempted to attribute this high velocity absorption to interstellar Ni II. However, this weak high velocity absorption cannot be entirely due to Ni II because it is not detected in the absorption profiles of strong ISM lines. For example, Savage et al. (1995) observed the interstellar Mg II 2796.35, 2803.53 Å doublet at 15 km s-1 resolution, and the absorption profiles of these lines, which are among the strongest of the ISM lines, show no evidence of absorption with –160 km s-1 or +60 km s-1 (see Figure 2 in Savage et al.). Similarly, the strong C II 1334.53 and Si II 1526.71 Å lines do not show high velocity interstellar gas of comparable strength (see Figure 5). What then is the source of the high velocity absorption near the Ni II profiles? For Ni II 1317.22 Å, continuum placement may play a role. With the uncertainty of the continuum placement, the extended absorption near Ni II 1317.33 Å is marginally detected. The extended absorption near Ni II 1370.13 Å, on the other hand, is real. The Cu II 1367.95 Å transition is close to the component at -400 km s-1 in the Ni II 1370.13 Å profile, but this identification cannot be correct because Cu II has a much stronger line at 1358.77 Å which is not apparent and because the wavelength doesn’t match the Cu line well. Given the close proximity of this Ni II line to the strong multicomponent Ly line at 1363.15 Å, it is likely that the extra absorption near Ni II 1370.13 Å is extragalactic H I Ly absorption. There are multiple absorption components near the Ni II 1454.84 Å line as well, but these occur at high positive velocities with different relative strengths than the components near the other Ni II lines (see Figure 5) and thus are not due to Ni II.
The absorption line at 1414.41 Å may have a contribution from Galactic Ga II 1414.40 Å. However, toward the well studied star Oph with (H) = 1.38 atoms cm-2, this Ga line has = 4 mÅ (Savage, Cardelli, & Sofia 1992). Since the line at 1414.41 Å in the H 1821+643 spectrum has = 6310 mÅ, it is unlikely that this line is entirely due to Ga II, but Ga is significantly depleted from the gas phase by dust in the Oph interstellar cloud. If we assume that Ga is not depleted at all in the interstellar gas toward H 1821+643 and scale the Oph equivalent width by the H 1821+643/ Oph hydrogen column densities, then we predict 12 mÅ for the Ga II line in the H 1821+643 spectrum. This is a conservative upper limit since Ga probably is at least somewhat dust depleted on the H 1821+643 sight line. Therefore we conclude that the line at 1414.41 Å is primarily due to extragalactic H I with possibly a small contribution from Ga II.
3.1.2 PG 1116+215
The interstellar lines in the GHRS G140L spectrum of PG 1116+215 are listed in Table 5 and many of them are displayed on a velocity basis in Figure 6. Close inspection of these interstellar profiles reveals evidence of a Galactic high velocity cloud (HVC) at 200 km s-1 (see, e.g., the Si IV and Si II profiles in Figure 6). We have taken this HVC into account in our identification of the lines.
In contrast to H 1821+643, the C I 1277.25 Å multiplet is not detected toward PG 1116+215. The difference may be due to the fact that the Galactic sight line to PG 1116+215 contains a considerably lower column density of H I than that toward H 1821+643: (H I) = 1.40 versus 3.84 cm-2 (Lockman & Savage 1995). We attribute the line found at 1328.46 Å to Ly rather than C I 1328.83 because of the absence of the C I 1277.25 multiplet which should be 1.6 times stronger.
The line at 1239.40 Å with = 17024 lies close to the wavelengths of Galactic N V 1238.80 and Mg II 1239.93 and 1240.39. However, we identify this feature as dominated by Ly absorption at = 0.1950 because there is no evidence for the weaker member of the N V doublet at 1242.80 Å (see Fig. 6) and the velocity centroid implied for the N V absorption (145 km s-1) is larger than we would expect to observe given that the ISM Si IV 1393.76 and 1402.77 Å lines are at +43 km s-1. Also, the Mg II 1239.93 and 1240.39 doublet lines have small f-values and these lines typically have equivalent widths of 10 to 25 mÅ in the spectra of distant stars in the Milky Way halo (Savage & Sembach 1996). Again, it would be useful to obtain a high resolution STIS spectrum to confirm the identification of this line and to properly remove any absorption due to interstellar N V and Mg II.
We identify the line at 1317.42 Å as Ni II 1317.21. With this identification we would expect to see a Ni II line of comparable strength at 1370.13 Å. While there is no statistically significant line detected at that wavelength, a feature of low significance is evident in Figure 6. We believe the Ni II 1317.21 identification is the correct one and that noise and/or continuum placement uncertainties have probably combined to cause the detection of one Ni II line and the apparent weakness of the second.
The interstellar S II triplet lines at 1259.52, 1253.81, and 1250.58 Å (with f-values of 0.0162, 0.0109, and 0.00545, respectively) shown in Figure 6 are blended with various other absorption features. The high S/N of the observations permits a clear separation of the overlapping absorption features. S II 1259.52 blends with the very strong interstellar Si II 1260.42 line and separate equivalent widths are given in Table 5. S II 1253.81 blends with a weaker line at 1255.00 Å that we identify as a Ly feature at = 0.03223. S II 1250.58 blends with a broader and stronger feature we identify as a Ly line at = 0.02845. This is evident from the strength of the 1250.30 Å line; if this line is entirely due to Galactic S II 1250.58, then it should be a factor of 2.0 weaker than the S II 1253.81 Å line. Instead we see from Figures 3 and 6 that the 1250.30 Å line is clearly stronger than the the line at 1253.86 Å. Also, the centroid of the 1250.30 Å line is blueshifted with respect to the other ISM lines (see Figure 6). With these identifications the relative strengths and velocities of the three S II lines from profile fitting are consistent with their origin in the Galactic ISM. The two Ly lines that blend with the S II lines differ in strength by about a factor of two. We considered the possibility that these lines might be a metal line doublet but could not find any plausible identifications involving the stronger Ly systems we see in the spectrum of PG 1116+215. While the line at 1255.0 Å may contain a contribution from S II in the Galactic HVC, this feature cannot be entirely due to high velocity interstellar S II. This is clear from comparison of the S II 1250.58 and 1253.81 Å lines; if the line at 1255.0 Å were mostly due to high velocity S II, then it would be much stronger than observed in the S II 1250.58 profile.
The other ISM lines found in the spectrum of PG 1116+215 are definite detections of lines known to be strong in the Galactic ISM. There are no known Galactic ISM lines close to the observed line at 1448.43 Å. There are also no reasonable identifications of this feature as a metal line associated with one of the stronger Ly lines seen in the spectrum of PG 1116+215. Therefore this line is left as unidentified in Table 5.
3.2. Extragalactic Absorption Lines
Heavy elements are detected in two extragalactic absorption line systems in the G140L spectrum of H 1821+643. We detect the O VI 1031.93, 1037.62 Å doublet and C III 977.02 Å in the associated absorber at = 0.2967, and the O VI doublet is also detected in the intervening absorption system at = 0.2250. These metal absorbers have been analyzed in a separate paper (Savage, Tripp, & Lu 1998). Note that the line at 1478.27 Å could be identified as Si III 1206.50 Å associated with the O VI absorber at = 0.2250. However, this identification seems unlikely because neither Si II nor Si IV lines are detected at this redshift with sensitive upper limits (see Savage et al. 1998), and it is difficult to simultaneously satisfy the lower limits on the Si III/Si II and Si III/Si IV ratios in photoionized or collisionally ionized gas. Therefore we attribute the line at 1478.27 Å at least partially to extragalactic Ly absorption. Corresponding Ly absorption is detected in the G160M spectrum (see Table 6), but the redshifts derived from the Ly and Ly lines differ by 0.0008, so this Ly line is probably blended, perhaps with Si III associated with the O VI absorber. Once again, higher resolution observations are needed to resolve this line identification ambiguity.
In the spectrum of PG 1116+215, a statistically significant line is detected at the expected wavelength of Si III 1206.50 at = 0.13852, within 30 km s-1 of the strong Ly line at = 0.13861. Si II 1260.42 Å is also marginally detected at this redshift.
The rest of the lines not identified as Galactic ISM lines or extragalactic metals (or H I Ly) are identified as Ly lines provided . In a few cases, the statistic from profile fitting with VPFIT is poor unless additional components are added to the fit. On this basis we infer the presence of two components in the line at 1384.16 Å in the spectrum of PG 1116+215. There are some indications that there is an additional Ly line (not listed in Table 4) blended with interstellar Si IV 1393.76 Å toward H 1821+643 (see Tripp 1997), but higher resolution observations are required to reliably identify this line.
4. Lyman Absorbers
4.1. Lyman Line Density
The high detection sensitivity of our GHRS spectra provides a rare opportunity to assess the line density, (the number of lines per unit redshift), of weak Ly lines and its evolution at low redshift. In the following analysis we exclude from consideration the region within 3000 km s-1 of the emission redshift of each quasar for the reasons given in §5.2.
Combining the G140L spectrum obtained here with the G160M spectra of Savage et al. (1995), we detect a total of 26 Ly lines with mÅ (19 with mÅ) in the spectrum of H 1821+643 over the wavelength region 1233-1556 Å, corresponding to a redshift path = 0.247 after applying a correction of for the redshift path blocked out by strong ISM lines. This implies
for Ly lines with mÅ, where the error is determined from statistics.
A similar analysis for the 3C 273 sightline (Morris et al. 1993) with 13 Ly lines with mÅ (8 with mÅ) over the wavelength region 1218-1382 Å with a redshift path of 0.135 (including the two lines associated with the Virgo cluster and the line blended with Galactic Si IV absorption666Brandt et al (1997) have verified the reality of this line by detecting the H I Ly absorption at the same redshift.) yields
for Ly lines with mÅ.
For PG 1116+215, 13 Ly lines with mÅ (10 with mÅ) are found in the G140L spectrum between 1226 and 1417 Å, corresponding to after applying a correction of 0.013 for the redshift path blocked out by the ISM lines. The resulting line density is then
for Ly lines with mÅ, where the inequality results from the fact that not all spectral regions of the PG 1116+215 G140L spectrum have adequate S/N to detect Ly lines with mÅ.
These estimates are in essential agreement with each other. Combining the H 1821+643 and the 3C 273 sightlines, we find
for Ly lines with mÅ at . Similarly we find
for Ly lines with mÅ combining the data for all three sightlines.
The line density at , for Ly lines with mÅ, is consistent with the number of Ly absorbers with (H I) cm-2 at these redshifts predicted by Riediger, Petitjean, & Mücket (1998) based on their study of Ly cloud evolution in the context of a CDM model. Note that an absorber with (H I) cm-2 would produce a Ly absorption line with = 50 mÅ if km s-1. Recently, Shull (1997) has reported preliminary results from analysis of 7 sight lines observed in HST Cycle 6. Based on these new spectra, which are reported to be adequate for detection of 20 mÅ lines, Shull (1997) derives = 25040. Evidently the number of lines detected continues to rise as the sensitivity improves. This is also predicted by Riediger et al. and may have important implications for the nature of the absorbers and the baryon content of the low Ly forest (see Shull 1997 and discussion below).
4.2. Redshift Evolution of Lyman Line Density
Previous studies of the redshift evolution of Ly clouds at low redshift have been limited to relatively strong lines ( mÅ, e.g., Weymann et al. 1998). The redshift evolution of weaker Ly lines is of considerable interest since, according to cosmological simulations of structure formation and evolution, they may arise from the tenuous gas in void regions and therefore may evolve differently from the stronger lines which mostly trace the gas distribution near galaxy structures (compare the and populations in Figure 6 of Riediger et al. 1998). The distribution of Ly lines in redshift is generally described by the expression
| (1) |
where is the line density at . Dividing the data for the above three sightlines into two redshift bins at and and considering only Ly lines with between 75 and 300 mÅ, we find and . The data seem to indicate some evolution in the number density of the weak lines but the relatively small number of lines and the small redshift span of the current sample () make any determination of the evolution index very uncertain. A formal fit to the equation above using the technique of Lu, Wolfe, & Turnshek (1991) yields for Ly lines with mÅ at . A similar value is obtained if lines as weak as 50 mÅ are included.
4.3. Clustering of Weak Lyman Lines
A striking aspect of Figure 1 is the complex component structure of the strong Ly lines. To allow the reader to inspect this more closely, the normalized absorption profiles of the four strongest Ly lines in the spectrum of H 1821+643 are shown on expanded scales in Figure 7, and the rest equivalent widths of the Ly lines are plotted versus redshift in Figure 8. Though there is some confusion from adjacent unrelated lines, we see from Figures 7 and 8 that the absorption profiles of three out of the four strongest H I Ly lines contain complex component structure with a main strong component and several partially resolved weaker outlying components spanning 1000-1500 km s-1. Even the Ly line at which does not show resolved weak components has an asymmetric profile which is evidence for unresolved components. Similarly, two out of the three strongest H I Ly lines seen toward PG 1116+215 show evidence of multiple components (see Table 5). This seems to suggest that there is some clustering of weak Ly lines at low redshift. Clustering of strong Ly lines ( mÅ) at low has been reported by Lanzetta et al. (1996) and Ulmer (1996), but clustering of weak Ly lines has not been detected previously.
To quantitatively measure the degree to which the Ly lines are clustered, we use the standard technique involving the two-point velocity correlation function,
| (2) |
where is the number of observed line pairs with velocity separation and is the number of pairs expected in a random distribution. If the clouds are not clustered on velocity scale , then . To expand our Ly line sample, we have combined our data with those of Morris et al (1993) for 3C 273, Stocke et al (1995) and Shull et al (1996) for I Zw 1, Mrk 335, Mrk 421, and Mrk 501, and Bruhweiler et al. (1993) and Savage et al. (1997) for PKS 2155304. All these spectra were obtained with the GHRS and have enough sensitivity to detect Ly lines as weak as 75 mÅ throughout the spectra, except the G140L spectrum of PKS 2155304 obtained by Bruhweiler et al (1993) which has somewhat lower sensitivity and is adequate for detection of lines with mÅ. Figure 9a shows the two-point correlation function for lines with mÅ. No evidence for clustering on any velocity scale is evident. Figure 9b shows the two-point correlation function for lines with mÅ, which shows a marginal signal () at km s-1, and the signal may extend up to km s-1. The number of lines in the sample becomes too small for this analysis if a higher equivalent width limit is imposed. Clearly a much larger sample of lines is required to further explore the clustering properties of weak Ly lines.
5. The Relationship Between Ly Absorbers and Galaxies
In this section we examine the relationship between Ly absorbers and galaxies. We begin with the sample definitions and nearest neighbor distances (§5.1). We then present some individual cases of interest and examine the correlations between the Ly line equivalent widths and the nearest galaxy impact parameters and distances in §5.2. Finally, in §5.3 we carry out a statistical analysis of the nature of the absorber-galaxy relationship.
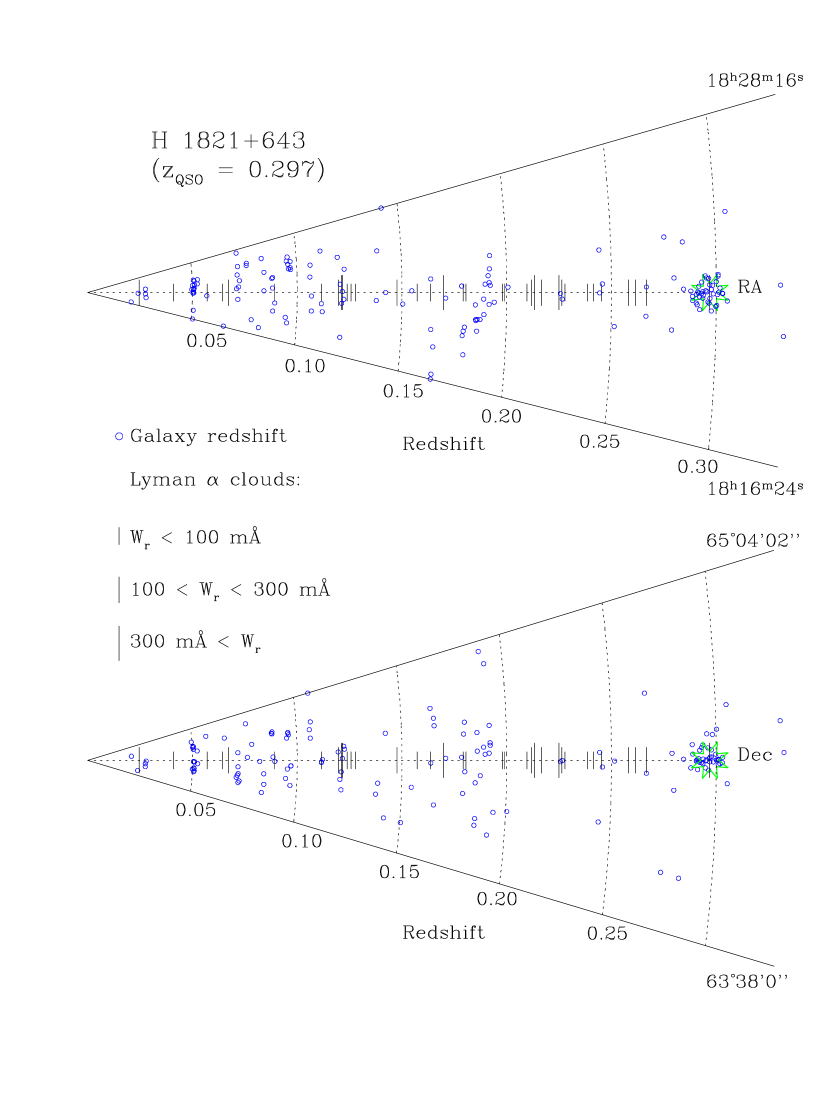
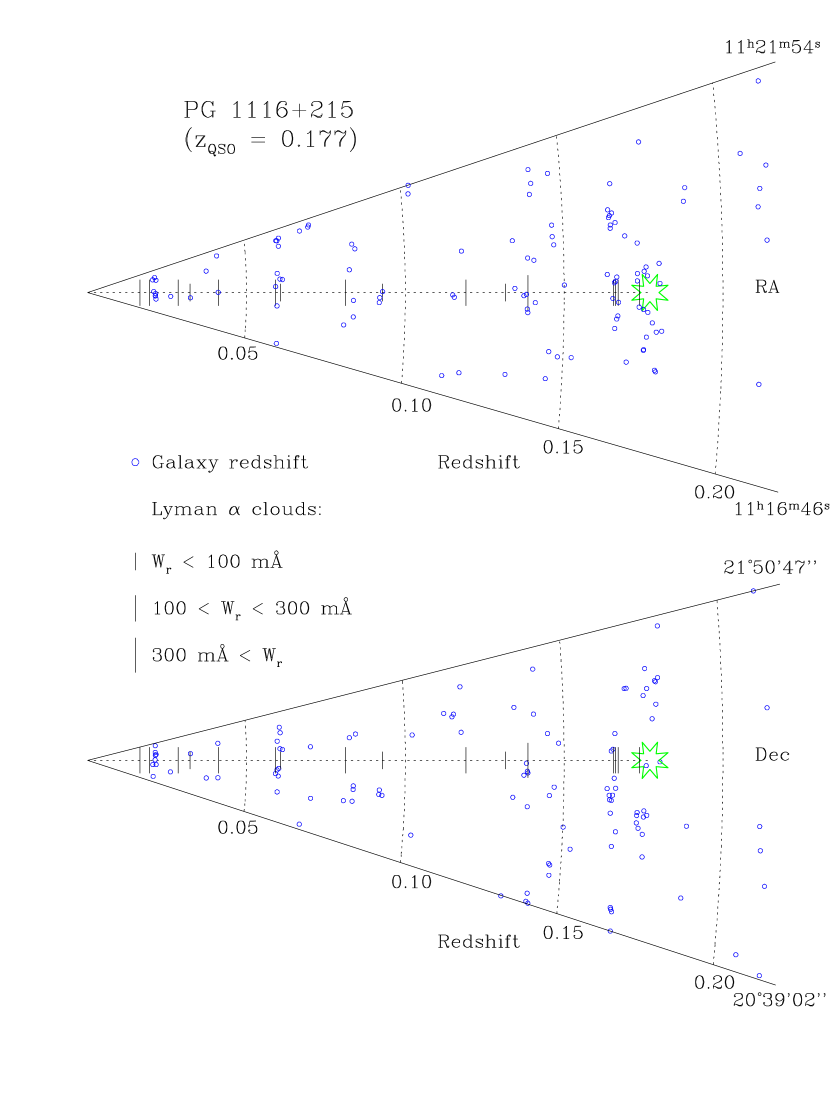
In Figures 10 and 11 we overplot the Ly line redshifts (indicated with vertical lines) on RA and Dec slices showing the galaxy redshifts (circles); the length of the line indicates the absorption line equivalent width as shown in the figure legend. Figure 12 shows the number of galaxies in the survey as a function of redshift in 1000 km s-1 bins with the absorber redshifts plotted at the top of each panel.
5.1. Ly Absorber Samples
For the Ly absorption lines we consider the following samples: (1) a “total” sample which includes all Ly lines listed in Tables 4 - 6, (2) a “complete” sample which only includes Ly lines with 0.20 but is otherwise identical to the total sample, and (3) a “1 Mpc complete” sample which only includes lines with 0.048 0.20. The second sample is defined because the H 1821+643 galaxy redshift survey is severely incomplete at 0.20 (see §2.3). The “1 Mpc complete” sample is defined to ensure good spatial coverage with a high degree of galaxy redshift survey completeness out to at least 1 Mpc from the QSO (c.f., Table 3). At 0.048, a 20’ radius corresponds to less than 1 Mpc, so nearest galaxies could be missed because they are outside of the field covered by the redshift survey. We will compare results derived from the “complete” and “1 Mpc complete” samples to evaluate the impact of this bias. For reasons given in §5.2, in all samples we exclude lines within 3000 km s-1 of the QSO redshift.
Following Morris et al. (1993) and Stocke et al. (1995), we further delineate the samples based on the assumption used to calculate the radial distances between absorbers and galaxies. We either (a) assume the radial distance between a given absorber and galaxy is given by the Hubble law (referred to as the “pure Hubble flow” sample), or (b) assume the absorber and galaxy are at the same radial distance if 300 km s-1 and calculate the radial distance between the absorber and galaxy from ( for 300 km s-1 (the “perturbed Hubble flow” sample). The perturbed sample is intended to account for motions from, e.g., galaxy rotation, which cause departures from the Hubble flow. The projected (i.e., transverse) distance between clouds and galaxies, also referred to as the impact parameter, is calculated assuming = 75 km s-1 Mpc-1 and = 0. Tables 7 and 8 list the projected and three-dimensional distances from the Ly absorbers to their nearest galaxies, for the pure Hubble flow sample, along with the absorber-galaxy velocity separation.
5.2. Relationship with Individual Galaxies and Specific Galaxy Structures
We now turn to the relationship between galaxies and Ly absorbers implied by our study, and we begin with inferences drawn from direct inspection of the data.
Individual Galaxies. One of the major conclusions of the Ly cloud study of Lanzetta et al. (1995) is that a large fraction (32-60% ) of the strong lines originate in individual luminous galaxies within projected distances of 200 kpc from the line of sight. More recently, Lanzetta et al. (1997) have suggested that the fraction is even larger and that possibly all of the absorbers arise in such galaxies. Furthermore, Lanzetta et al. claim that the Ly equivalent width is anticorrelated with impact parameter, which indicates that there is a physical association between the galaxies and the absorbers and that the density of the gaseous halo decreases with increasing distance from the galaxy. This anticorrelation has been contested by Le Brun et al. (1996) and Bowen, Blades, & Pettini (1996), but Chen et al. (1998) argue that Le Brun et al. and Bowen et al. have effectively diluted the anticorrelation by including galaxy-absorber pairs at large impact parameters (up to 5 Mpc) which are unlikely to be physically associated.
We can test the conclusions of Lanzetta et al. because our galaxy samples include 42 galaxies with impact parameters 600 kpc (see Tables 1 and 2). However, we should exclude any galaxies and absorption lines which have because (1) the absorbers with are now recognized to be a special class of absorption systems; in some cases there is clear evidence that these absorbers are close to the QSO nucleus (e.g., Hamann et al. 1997a,b; Barlow & Sargent 1997), (2) these absorbers can be significantly photoionized by the QSO itself (the “proximity effect”), and (3) in the case of H 1821+643, the QSO is located in a rich galaxy cluster (see Figure 10 and Hall, Ellingson, & Green 1997) which is a special environment. For consistency with Lanzetta et al. and Chen et al., we exclude objects within 3000 km s-1 of the QSO redshift. This leaves us with 20 galaxies with 600 kpc in the fields of H 1821+643 and PG 1116+215.
First consider the closer galaxies: if we find a galaxy with an impact parameter of 200 kpc or less, do we find a strong Ly line at that redshift? Our sample is small – we only have three galaxies with impact parameters of 200 kpc or less – but in all three cases we find a strong Ly line with 300 mÅ within 150 km s-1 of the galaxy redshift. Furthermore, as we consider larger impact parameters, we continue to find nearby Ly absorbers. In fact, all galaxies within projected distances of 600 kpc from the sight lines have associated Ly absorbers with 1000 km s-1 ( is the mean of and ). In some cases there are several galaxies near the redshift of the Ly cloud; following Chen et al. (1998) and Lanzetta et al. (1995), we first assume that the galaxy with the smallest impact parameter is the most likely to be associated with the absorber (we consider an alternate selection criterion below). This reduces our list of 20 close galaxies to 12 close galaxies. We also treat Ly lines within 350 km s-1 of each other as a single absorber. Given these assumptions, we find 12 galaxy-absorber pairs with 600 kpc and 1000 km s-1 (7 pairs toward H 1821+643 and 5 pairs toward PG 1116+215). We have used 1000 km s-1 because this is the selection criterion originally employed by Lanzetta et al. (1995). While there are situations which could lead to such high velocity gas flows in galaxy clusters (e.g., Roettiger, Stone, & Mushotzky 1998; Burns 1998), in general 1000 km s-1 is a rather large velocity interval which corresponds to many Mpc in an unperturbed Hubble flow. Therefore one might reasonably wonder if these 12 galaxy-absorber pairs are coincidental alignments of randomly distributed Ly lines which occasionally happen to be close to a galaxy. To address this question, we have used Monte Carlo simulations (see §5.3) to randomly distribute Ly lines along the H 1821+643 and PG 1116+215 sightlines. Based on 10000 Monte Carlo trials, we find that the probability of 7 chance galaxy-absorber pairs toward H 1821+643 and 5 chance pairs toward PG 1116+215 is 4.7. Furthermore, nine of these 12 observed galaxy-absorber pairs have 600 kpc and 340 km s-1, and the probability of this occuring if the Ly clouds are randomly distributed is 1.3, again based on 10000 Monte Carlo trials. Taking into account the uncertainties in the galaxy and cloud redshifts, it seems reasonable to attribute galaxy-absorber velocity differences of 350 km s-1 to normal galaxy motions such as rotation.
A similar corroborating result is obtained from the 3C 273 data obtained by Morris et al. (1993). There are five galaxies777Actually there are eight galaxies with 600 kpc in the 3C 273 sample, but four of these are in Virgo at roughly the same redshift with = 0.0065, and again we use the galaxy with the smallest impact parameter. in the sample of Morris et al. with impact parameters of 600 kpc or less, and in all five cases there are Ly clouds detected within 500 km s-1. In four out of the five 3C 273 close galaxy-absorber pairs, the Ly absorber is within 250 km s-1 of the galaxy redshift. In all, there are 17 galaxies with 600 kpc along the three sight lines (3C 273, H 1821+643, and PG 1116+215); every one of them has a corresponding Ly absorption line with 1000 km s-1, and 14 out of the 17 galaxies are within 500 km s-1 of a Ly line. This is a strong indication that Ly absorbers are somehow associated with luminous galaxies but does not necessarily indicate that the absorption lines originate in the large gaseous halos of the identified individual luminous galaxies. The Ly lines could be due to undetected faint dwarf galaxies which are clustered with the observed luminous galaxies, or they could be due to broadly distributed gas within the large scale structures where luminous galaxies are found, for example.
Since in some cases there are several galaxies close to a line of sight at a given Ly absorber redshift (see Figures 10 and 11), it isn’t clear that the galaxy with the smallest impact parameter is the most likely one (or the only one) to be associated with the absorber (as assumed above). In some cases the galaxy with the smallest impact parameter has a larger velocity separation from the absorber than another galaxy at a somewhat larger impact parameter. An alternative criterion for identifying galaxy-absorber pairs is to match absorbers with the galaxy with the smallest three-dimensional distance. Assuming the perturbed Hubble flow described above, this selection method leads to the identification of 17 galaxy-absorber pairs within projected distances of 1 Mpc with 350 km s-1 in the H 1821+643 and PG 1116+215 sight lines. These galaxy-absorber pairs are summarized in Table 9. Monte Carlo simulations indicate that the probability of drawing this many pairs from a randomly distributed Ly population is 3.6.
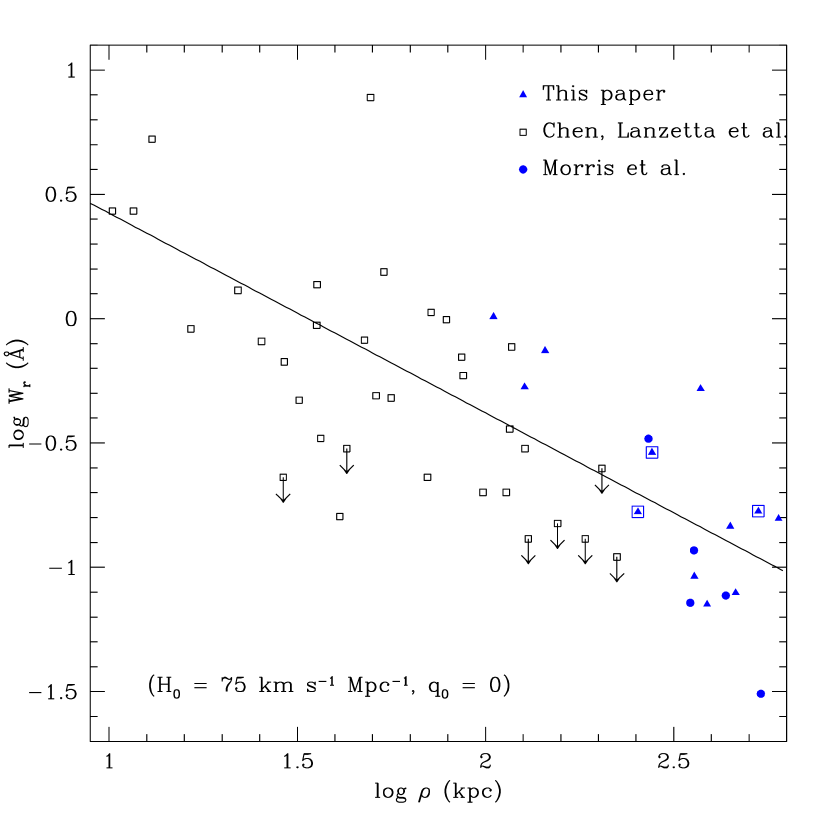
We now turn to the equivalent width - impact parameter anticorrelation which Lanzetta et al. use to argue that the strong Ly lines are truly due to luminous individual galaxies. Does this anticorrelation extend to larger impact parameters? Lanzetta et al. (1995) and Chen et al. (1998) could not detect such an extension because their FOS Ly line measurements generally do not have sufficient sensitivity to detect the weak absorption lines, but our data are adequate for this purpose. To explore this question, we have combined the H 1821+643 and PG 1116+215 data with the 3C 273 data from Morris et al. (1993) and, for the stronger lines at smaller impact parameters, the data from Chen et al. (1998). From these papers we have selected all galaxy-absorber pairs with impact parameters of 600 kpc or less and 1000 km s-1. The results are plotted in Figure 13. This figure shows that the Lanzetta et al. (1995) anticorrelation does appear to extend to larger impact parameters. The Spearman rank-order correlation coefficient for the data in Figure 13 is = -0.762, and with 44 data points, this indicates that the data are anticorrelated at the significance level.888According to Equation 14.6.2 in Press et al. (1992). The sum squared difference of ranks statistic indicates that the significance of the anticorrelation is 5.0. Fitting a power-law of the form
| (3) |
where is the galaxy impact parameter and is a constant, to the data in Figure 13 yields = -0.800.10 and = 4.230.20 where is in mÅ and is in kpc (fit shown as a solid line in Figure 13). Based on the strong line data alone, Chen et al. derive = -0.930.13, in agreement within the 1 uncertainties.
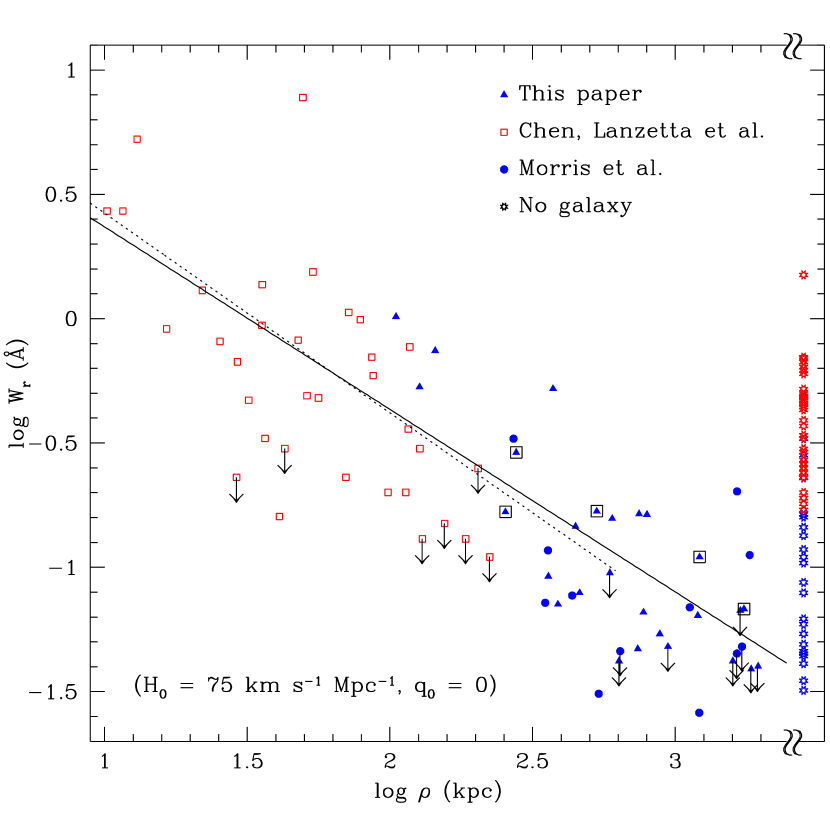
In Figure 13, we have only included galaxies with impact parameters of 600 kpc or less. If we increase the impact parameter cutoff, we continue to find galaxies apparently associated with Ly lines, be we also find some galaxies which do not have associated Ly absorption lines, within 1000 km s-1, of the strength expected from equation (3). For example, a galaxy at = 0.18967 in the H 1821+643 field is at a projected distance of 635 kpc, and therefore from eqn. (3) we expect to find a line with 95 mÅ near this redshift, which should be easily detected. From Figure 1, it is clear that no Ly line of this strength is present at this redshift (a weak feature is apparent at the expected wavelength, but it is lower than 3 significance and much weaker than 95 mÅ). From the H 1821+643, PG 1116+215, and 3C 273 sight lines, we find 15 cases999Again, for groups of galaxies we only consider the galaxy with the smallest impact parameter. of galaxies with 600 2200 kpc that do not have unambiguously associated Ly lines within 1000 km s-1. However, five of these cases are at redshifts where the associated Ly line could be hidden within strong ISM lines or extragalactic lines. The remaining 10 cases which do not have associated Ly lines are plotted as upper limits in Figure 14, which also shows all galaxies with 2200 kpc that do have Ly lines within 1000 km s-1. Remarkably, using the sample shown in Figure 14, we find that the anticorrelation persists at high significance levels out to 2200 kpc. There is a lot of scatter in the data shown in Figure 14, so the cases where we do not find associated Ly lines may simply be cases where the line is weak enough to fall below our detection threshold; the upper limits for these cases are consistent with the anticorrelation. If we select only galaxy-absorber pairs with 2200 kpc and 500 km s-1, the anticorrelation is still strong because there are only five galaxy-absorber pairs in Figure 14 with 500 1000 km s-1 (the triangles encased in squares in Figure 14).
This strong anticorrelation is another indication that the absorbers and galaxies shown in Figure 14 are in some way physically related and may have important implications regarding the nature of the Ly absorbers. We discuss possible interpretations of the anticorrelation in §6. However, it is important to emphasize that there are some potential selection biases which could artificially tighten the anticorrelations shown in Figures 13 and 14. For example, the current galaxy redshift surveys only probe relatively bright galaxies (see Table 3), so there could be fainter galaxies at smaller impact parameters than those plotted in Figure 14 that might be revealed by a deeper redshift survey. Discovery of such galaxies would modify the appearance of Figure 13 and weaken the anticorrelation by moving points from the lower right corner of Figure 14 to the lower left corner of the plot. Going deeper might also reveal close galaxies which do not have corresponding Ly absorption. Along these lines, Linder (1998) has used simulations to argue that most Ly absorbers could be due to faint galaxies rather than the observable luminous galaxies at the same redshift. Some deep searches near the lowest redshift Ly lines have not found such faint galaxies (e.g., Morris et al. 1993; van Gorkom et al. 1993; Rauch et al. 1996), but van Gorkom et al. (1996) and Hoffman et al. (1998) have located faint dwarf galaxies at the redshifts of a few low Ly lines. It will be important to do more deep searches for faint galaxies to establish whether or not the anticorrelation in Figure 13 is real.
Another potential bias in Figure 14 (and in the analyses of Lanzetta et al. and Chen et al.) may be introduced by the selection of only Ly lines which are known to be within a certain projected distance and velocity of a galaxy. Due to these selection criteria, there are many Ly lines in our sight lines and in the Chen et al. (1998) sight lines which are not plotted in Figure 14. In some cases, these unplotted Ly lines may not have known galaxies nearby simply because the appropriate galaxy redshift survey is incomplete. Alternatively, these lines may not have known nearby galaxies because the nearest galaxy is outside of the angular extent of the redshift survey. If this is the case, then these missing galaxy-absorber pairs would have relatively large impact parameters and would fill in the upper right corner of Figure 14, and this would weaken the anticorrelation. To illustrate the possible impact of this selection effect, we plot on the far right side of Figure 14 some of the missing lines from the Chen et al. (1998) sample (using equivalent widths reported by Jannuzi et al. 1998 and Bahcall et al. 1993) and the missing lines from our sight lines. From this we see that the missing lines could indeed substantially dilute the anticorrelation. To check to see if this selection bias is occuring, more galaxy redshift measurements are needed.
Specific Galaxy Structures. A visual inspection of Figures 10, 11, and 12 and Tables 7 and 8 yields the following information on the relationship between the Ly clouds and galaxy structures.
First, there are no unambiguously detected Ly lines in the vicinity of the prominent galaxy clusters at 0.050 and 0.190 in the direction of H 1821+643. The galaxy survey of Morris et al. (1993) revealed a similar cluster of galaxies at 0.08 with no associated Ly absorbers in the direction of 3C 273. This may indicate that Ly absorbers are destroyed (or are not created in the first place) in this type of environment. However, do we expect to see absorbers in these clusters based on the impact parameters of the nearest galaxies? As already noted above, in the cluster at 0.190, there is a galaxy at a projected distance of 635 kpc and we should see an absorber there based on equation (3). In the cluster at 0.050, the nearest galaxy has an impact parameter of 590 kpc, so we might expect a Ly line at that redshift with 100 mÅ. In this case a line with the right strength is well-detected at the expected wavelength, but its identification is ambiguous since this absorption may be due to C I in the Milky Way ISM (see §3.1.1). Morris & van den Bergh (1994) have shown that a substantial fraction of Ly lines at low could be due to material stripped out of galaxies in tidal interactions, and they point out that in this model Ly absorbers would be less likely to be found in rich clusters because (1) there are fewer gas-rich spirals, and (2) tidal debris should be less common due to the higher velocity dispersion of rich clusters. Furthermore, rich galaxy clusters contain hot intracluster media, so Ly clouds may be fully ionized in this environment. Therefore it is not necessarily surprising to find that Ly absorbers may avoid rich clusters. However, more sight lines crossing rich clusters must be studied to give this suggestive result statistical significance. We note that there is a strong Ly cloud in the rich cluster which hosts H 1821+643, but since this is a absorber, this is a special case. This cloud may be quite close to the QSO nucleus or gas ejected by the QSO, for example (see Savage et al. 1998). Given the very large number of galaxies in this rich cluster (see Figure 10), it is noteworthy that the Ly absorption only shows one strong component, albeit at the FOS G130H resolution (FWHM 250 km s-1).
Examination of Figures 10 - 12 reveals other smaller galaxy groups which do not have associated Ly lines within = 1000 km s-1 such as the group at = 0.072 toward H 1821+643. However, such inspection also shows several galaxy groups which do have associated Ly absorbers, e.g., the group at = 0.121 toward H 1821+643 or the groups at = 0.060, 0.138, and 0.166 toward PG 1116+215. Evidently the Ly absorbers do not always avoid the regions of higher galaxy concentration. This was known previously from the results of Stocke et al. (1995) and Shull et al. (1996) who showed that the majority of their Ly lines are found within large scale structures even though their sight lines probe substantial paths through galaxy void regions, but it is still possible that the Ly lines avoid the regions of highest galaxy density, i.e. rich clusters.
Second, as found for other sight lines by Morris et al. (1993), Stocke et al. (1995), and Shull et al. (1996), our study reveals some Ly absorbers apparently in galaxy voids at very large distances from the nearest galaxy in the survey (see Tables 7 and 8 and Figures 10 - 11). At 0.20, absorbers apparently in voids should not be taken too seriously because at these redshifts our galaxy survey is very incomplete. At lower redshifts, our survey is deep enough to reveal faint galaxies. Consider the examples of Ly lines at large distances from galaxies at = 0.04105 toward H 1821+643 and at = 0.01639 toward PG 1116+215. At = 0.04105, = 19.0 corresponds to 0.14, while at = 0.01639, = 19.0 corresponds to 0.02. Therefore based on the completeness estimates from §2.3, there is a good chance that we would have identified a galaxy as bright as the LMC near these void absorbers if such galaxies were present. However, at these redshifts the limited angular extent of the galaxy redshift survey (see Table 3) is a source of concern; in these cases a galaxy at a projected distance of one to a few Mpc might be missed because it is outside of the region surveyed. Therefore more redshift measurements with broader angular coverage are needed to establish that these are truly void absorbers.
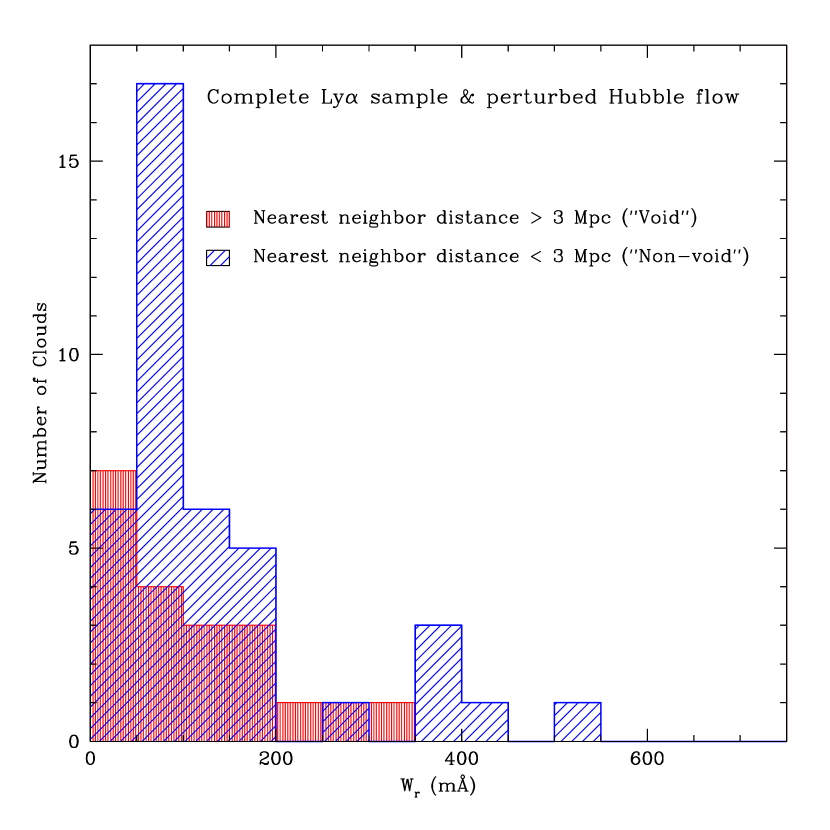
Figures 9-11 give a visual impression that the absorption lines in voids tend to be weaker. To explore this possibility, we have divided (somewhat arbitrarily) our complete perturbed Hubble flow sample into “void” and “non-void” samples, the non-void absorbers defined by having three-dimensional nearest neighbor distances of 3 Mpc or less and the void absorbers defined by nearest neighbor distances greater than 3 Mpc (we have also included the Morris et al. and Stocke/Shull et al. data in this exercise). We then compared the equivalent width distributions. This division at 3 Mpc is not entirely arbitrary though because it correctly separates the Ly lines which Stocke et al. (1995) and Shull et al. (1996) define as void and non-void absorbers on different grounds. Figure 15 compares the resulting equivalent width distributions of the void and non-void absorbers. While it does appear that the strongest lines tend to be non-void absorbers (which is not surprising given the discussion above), the two distributions are similar, and a KS test indicates that there is a 15% probability that they were drawn from the same parent distribution. Therefore there is no statistically significant difference between the equivalent width distribution of the void and non-void absorbers in the present sample. Applying the same test to the “1 Mpc complete” sample, which is less prone to the problems discussed in the previous paragraph, yields a very similar result. In this case we find a 14% probability that the void and non-void absorbers were drawn from the same equivalent width distribution.
5.3. Statistical Relationships
In §5.2 we addressed the question: if there is a galaxy within some impact parameter, do we find a Ly absorber near that redshift? The other obvious question to ask about our data is: given that we have detected a Ly absorber at redshift , is there a galaxy or galaxy structure nearby? Toward PG 1116+215, 69% of the Ly absorbers in the total sample have nearest neighbor galaxies within three-dimensional distances of 2 Mpc, while toward H 1821+643, 47% of the absorbers have galaxies within 2 Mpc, assuming the perturbed Hubble flow101010In their full sample, Stocke et al. (1995) found that 70% of the Ly lines are within 2 Mpc of a galaxy.. In the “1 Mpc complete” sample, 75% of the PG 1116+215 absorbers and 53 % of the H 1821+643 absorbers are within 2 Mpc of the nearest galaxy.
Specifically, we consider the following issues. (1) Previous studies have indicated that overall, the Ly absorbers are not randomly distributed with respect to galaxies. Is this confirmed by our data? Recently this conclusion has been challenged by Grogin & Geller (1998). (2) As noted in §1, there is considerable interest in comparing the relationship between the weak Ly absorbers and galaxies to that between the strong Ly absorbers and galaxies. Is there a statistically significant difference? Stocke et al. (1995) split their sample into weak and strong absorbers and found that the weak lines are statistically consistent with a random distribution. However, Stocke et al. emphasize that their sample of weak clouds is rather small. We can check this result with a larger sample.
Following the previous studies of Morris et al. (1993) and Stocke et al. (1995), we use Monte Carlo nearest neighbor tests to examine these issues. To do this, we randomly distributed absorbers along the H 1821+643, PG 1116+215, and 3C 273 sight lines with a line density in accordance with Eqn. (1); we tried various values of ranging from 0.0 to 0.5 and found no significant changes in the results. The number of absorbers randomly distributed on each sight line was set equal to the number in the observed Ly sample, and we ran 1000 simulations for each QSO. We then determined the three-dimensional nearest neighbor distance for each real absorber-galaxy, random absorber-galaxy, and galaxy- galaxy pair as discussed above and plotted their cumulative nearest neighbor distributions. The results for the total and complete samples are shown in Figure 16 (see §5.1 for the sample definitions). The cumulative percentage on the y-axis in this figure indicates the fraction of objects (absorbers, galaxies, and random absorbers) with nearest neighbor distances equal to or less than the corresponding value on the x-axis. The results of Kolmogorov-Smirnov (KS) tests which compare the nearest neighbor distributions for all of the samples defined in §5.1 are summarized in Table 10. Column 6 of Table 10 shows that the probability that the Ly clouds are drawn from a random distribution is extremely small for all samples, in agreement with the previous conclusions of Morris et al. (1993) and Stocke et al. (1995). The “complete” and “1 Mpc complete” samples yield similar results, which indicates that the limited spatial coverage of the redshift survey at low does not have a severe impact. Table 10 also shows that for the complete sample, the galaxy-galaxy and galaxy-Ly distributions are statistically difficult to distinguish. However, this does not necessarily indicate that the Ly absorbers are clustered as strongly as galaxies in general because the galaxy clustering implied by the galaxy-galaxy nearest neighbor distribution in Figure 16 is underestimated due to incompleteness of the redshift surveys.
We have also divided our complete sample into “weaker” and “stronger” absorbers based on the Ly line equivalent widths. Figure 17 compares the resulting nearest neighbor distribution of the Ly lines with 100 mÅ to the nearest neighbor distribution of the lines with 100 mÅ. We selected 100 mÅ as the cutoff between the weak and strong absorbers because this divides the sample roughly in half (28 weak vs. 21 strong absorbers) and because this is the cutoff used by Stocke et al. (1995). Table 11 lists the KS probabilities that the weak and strong absorbers are drawn from a random distribution. Figure 17 and Table 11 clearly show that neither the weak absorbers nor the strong absorbers are randomly distributed with respect to the galaxies in the survey. Figure 17 also shows that the weaker absorbers are difficult to distinguish from the stronger absorbers, at least based on the nearest neighbor distribution with 100 mÅ delineating weak lines from strong. However, previous studies indicate that the cutoff between the hypothesized two populations of Ly absorbers (see §1) may be closer to 300 mÅ than 100 mÅ. Unfortunately, we have very few Ly lines in our sample with 300 mÅ, so we cannot apply the same test using 300 mÅ as the cutoff. However, the sparse data that we do have suggest that there is a difference between absorbers with 300 mÅ and weaker absorbers, as expected from the anticorrelation discussed in §5.2. For example, four out of six Ly lines in the H 1821+643 and PG 1116+215 spectra with 300 mÅ (not including lines within 3000 km s-1 of the QSO redshift) have a nearby galaxy with 200 kpc and 300 km s-1, and the fifth has a galaxy at = 373 kpc and = 246 km s-1. The only Ly line with 300 mÅ that does not have a nearby galaxy is at 0.2 toward H 1821+643 where the galaxy redshift survey is very incomplete. In contrast, out of the 41 remaining Ly lines with 300 mÅ, only two have 200 kpc and 300 km s-1, and these are both within 350 km s-1 of a strong Ly line with 300 mÅ (see Tables 7 and 8). If we divide the sample into lines with 200 mÅ and 200 mÅ, we obtain the nearest neighbor distributions shown in Figure 18 and the statistical results in the lower half of Table 11. While Figure 18 does suggest that there is a difference between the weaker and stronger lines, the difference has a marginal statistical significance; a KS test indicates that there is a 6.5% probability that the weaker and stronger absorbers in Figure 18 are drawn from the same distribution. However, there are only 9 lines in the sample with with 200 mÅ. Clearly more observations are needed.
6. The Nature of the Low Redshift Ly Absorbers
In this section we discuss the implications of our results for the relationship between Ly absorbers and galaxies. To facilitate the discussion, we first summarize the main results of our study in the context of earlier studies:
(1) The distribution of Ly absorbers in space is not random but rather is correlated with the distribution of galaxies as found previously (Morris et al. 1993; Lanzetta et al. 1995; Stocke et al. 1995; Lanzetta et al. 1997). A new result of this work is that, because of our larger sample of weak Ly absorption lines, we find that even the very weak absorbers ( 100 mÅ) are correlated with the galaxy distribution. On the other hand, the correlation between galaxies and absorbers is not as strong as the correlation between galaxies themselves (Morris et al. 1993; Mo & Morris 1994; Stocke et al. 1995; Lanzetta et al 1997). There appears to be marginal evidence that the weak absorption lines are less correlated with the galaxy distribution than the strong absorption lines, but the difference is not yet significant.
(2) Earlier work by Lanzetta and co-workers (Lanzetta et al. 1995, 1997) showed that luminous galaxies at impact parameters 200 kpc frequently have corresponding Ly absorption lines. They also suggested that galaxies at impact parameters greater than 200 kpc are almost never associated with corresponding Ly absorption lines. However, we find that all galaxies within 600 kpc of the quasar sightlines do have corresponding Ly absorption with 1000 km s-1, and a significant number of galaxies at 600 2200 kpc have corresponding Ly absorption lines with 1000 km s-1. Furthermore, most of these galaxy-absorber pairs are separated by less than 350 km s-1. These different conclusions result mostly from the fact that the Ly absorption lines tend to be weak for galaxies with large impact parameters, and the FOS spectra used by Lanzetta et al. (1997) are not sufficiently sensitive to detect these weak lines.
(3) It was shown by Lanzetta and co-workers (Lanzetta et al. 1995,1997; Chen et al. 1998) that the equivalent widths of the Ly absorption lines are anticorrelated with the impact parameters to galaxies for impact parameter up to 200 kpc and up to 500 km s-1. We find that the same relation extends to impact parameters as large as 2 Mpc for 1000 km s-1. In addition, there is no noticeable increase in the scatter around the mean anticorrelation relation going from small to large (see Figure 14), while increasingly large scatter with increasing might be expected if the absorbers and the galaxies are physically related at small impact parameters but are less physically related at larger projected distances. However, there are potential selection effects which can artificially tighten this anticorrelation, and follow-up studies are needed to determine whether or not it is real.
(4) Some prominent groups of galaxies do not have clearly associated Ly lines. However other galaxy groups do have associated Ly absorbers. Evidently Ly absorbers do not always avoid regions of higher galaxy density, but they may avoid the densest regions.
(5) Dividing the Ly absorbers into “void” and “non-void” absorbers based on whether or not there is a galaxy within 3 Mpc in 3-dimensional space, assuming a perturbed Hubble flow for the determination of radial distance, we find that the equivalent width distributions of void and non-void absorbers are statistically indistinguishable.
There are two main competing interpretations of the relationship between galaxies and Ly absorbers at low redshifts. Lanzetta and co-workers (e.g., Lanzetta et al. 1995,1997; Chen et al. 1998) have suggested that low redshift Ly absorbers (mostly strong absorption lines with 300 mÅ) are physically associated with individual galaxies which are surrounded by extended gaseous envelopes of 200 kpc radius of unknown geometry which give rise to the observed Ly absorption. Two main arguments are cited in support of the physical association interpretation: (1) the galaxy-absorber cross-correlation function appears to be strong for 200 kpc and 500 km s-1 and is much weaker at larger impact parameters and velocity separations (Lanzetta et al. 1997); (2) there is an anticorrelation between absorber equivalent width and impact parameter for galaxy-absorber pairs that are likely to be physically associated (Chen et al. 1998), where “physically associated” pairs refer to those with galaxy-absorber cross-correlation significantly above zero (essentially galaxy-absorber pairs with 200 kpc and 500 km s-1). The latter point suggests that the density of the gas distribution near galaxies drops off with increasing galactocentric radius. Some independent support for this picture is provided by Zaritsky et al. (1997) who conclude, based on the velocity dispersion of satellites around isolated spiral galaxies, that the dark matter halos of spirals have radii 200 kpc.
However, there are difficulties with the gaseous halo interpretation (see, e.g., §5 in Stocke et al. 1995). It is difficult to understand how galaxies would be able to maintain such large gaseous halos — such halos would probably be weakly bound and vulnerable to disruption by interactions in groups and clusters. Our finding that the equivalent width versus impact parameter anticorrelation extends to impact parameters as large as 600 kpc and may extend to several Mpc further aggrevates the problem and challenges the Lanzetta et al. interpretation. In addition, there are several instances in our sample and elsewhere (e.g., Rauch et al. 1996) in which a group of galaxies within a few 100 km s-1 of each other with separations comparable to the impact parameter to the nearest galaxy appear to be responsible for the same Ly absorption. As noted by Rauch et al. (1996), the “cloud size” or “coherence length” of Ly absorbers inferred by Dinshaw et al. (1995,1997) from common Ly lines detected toward QSO pairs, 700 kpc, is much larger than the transverse separation between galaxies so it is doubtful that the large cloud size could refer to absorption produced by a single galactic halo or disk. Rather, the large transverse sizes and small velocity differences of common Ly absorbers measured by Dinshaw et al. appear to favor spatially coherent and rather quiescent gaseous structures on scales significantly larger than the virial radii of individual galaxies.
An alternative to the Lanzetta et al. interpretation is that, rather than being associated with individual galaxies, the Ly absorbers trace the large scale structures in which both galaxies and gas reside. Recent cosmological simulations of structure formation involving gas hydrodynamics suggest a picture in which galaxies are surrounded and connected by filamentary or sheet-like gaseous structures. Such structures have properties which are consistent with the Ly absorption lines at = 2- 4, as has been shown by a number of recent studies (e.g., Cen et al. 1994; Petitjean, Mücket, & Kates 1995; Miralda-Escudé et al. 1996; Hernquist et al. 1996; Zhang et al. 1997,1998). In these simulations, the density of the gas distribution drops with increasing distance from galaxies, and often even void regions contain enough gas to produce Ly absorption lines, albeit with much lower H I column densities. It is reasonable to expect that the overall structure of the gas distribution at = 0 will remain similar to that at 2, although the amount of gas in void regions and in the filamentary structures should decrease as the gas “drains” through the filaments into galaxies.
The association of Ly absorbers with large scale structures appears to be consistent with all of the observational evidence obtained so far for low Ly absorbers. The distribution of absorbers is obviously correlated with that of galaxies because they trace the same large scale structures, but clearly the absorber-galaxy correlation function will be weaker than the galaxy-galaxy correlation function. Since most (if not all) galaxies are likely to be engulfed by diffuse gas in the filamentary structures, an absorption line is likely to be found when a galaxy is near the QSO sightline (result (2) above). The anticorrelation between absorber equivalent width and impact parameter and the persistence of such an anticorrelation to very large impact parameters can also be understood in analogy with the simulations at large redshift; the density of the gas distribution is expected to decrease on average as one moves away from galaxies. However, since the gas distribution is not regular and smooth, a large scatter in this anticorrelation relation is expected, as observed (see Figures 13 and 14). Chen et al. (1998) attemped to reduce the scatter in the equivalent width vs impact parameter relation by incorporating various galaxy properties as a secondary parameter, such as galaxy luminosity, mean surface brightness, effective radius, disk-to-bulge ratio, redshift, and shape of the gas distribution; only marginal improvement in the relation was found even in the best case when galaxy B-band luminosity was incorporated into the relation111111The significance of the anticorrelation improved from 3.4- 4.5 to 4.2-5.9, depending on the statistical test applied.. The apparent insensitivity of this relation to galaxy properties is naturally explained if the absorption arises from the overall large scale structure rather than in individual galaxies.
Some absorption lines should also occur when the quasar sightlines pass through regions in the large scale structure that are relatively far (many Mpc) away from galaxies, where there may still be gas either in filaments or in the voids. This is consistent with result (5), namely, the equivalent width distributions of void and non-void absorbers are statistically indistinguishable. However, the absorption lines arising from regions in space far away from galaxies should, to some degree, be weaker on average. A much larger Ly line sample is required to search for such a trend.
A third interpretation of the Ly absorbers is that the lines are associated with faint dwarf galaxies which may be able to generate large (100 kpc) gaseous halos via supernova-driven winds (Wang 1995; Nath & Trentham 1997). At low , this interpretation has gained support from the 21 cm imaging study of van Gorkom et al. (1996) which has located gas-rich dwarf galaxies at the redshift of some low Ly lines. There are some potential problems with this interpretation. First, the dwarf galaxies are usually more than 100 kpc from the sight lines. Several sensitive imaging searches for very faint galaxies in the vicinity of the two lowest-redshift Ly absorbers toward 3C 273 have failed to find faint galaxies within 100 kpc of the sight line (e.g., Morris et al. 1993; van Gorkom et al. 1993; Rauch et al. 1996). By searching a somewhat larger field, Salzer (1992) and Hoffman et al. (1998) have found two dwarf galaxies at projected distances of 200 kpc near the lowest redshift 3C 273 absorber. Hoffman et al. (1998) have measured the rotation curve of one of these dwarfs, and they show that extension of the observed rotation curve cannot explain the velocity of the associated Ly absorber (see their Figure 6), but this may not be surprising if the Ly line is due to a galactic wind. A second criticism of the dwarf galaxy model of Ly absorbers stems from the recent study of Martin (1998). Martin (1998) has explored the likelihood that dwarf galaxies will drive galactic winds by surveying the expansion rates and sizes of their H shells. She concludes that “many of the shells will breakthrough the surrounding H I layer supersonically, but the projected expansion speeds are typically less than the lower limits on the escape velocity.” Martin notes that in a few objects in her sample (e.g., NGC 1569, see also Heckman et al. 1995), an unbound galactic wind is likely, but since she has exclusively selected dwarfs with prominent shells and only 25% of dwarf galaxies show prominent H filaments (Hunter, Hawley, & Gallagher 1993), her study seems to suggest that the majority of nearby dwarf galaxies will not drive winds. Since many recent studies have shown that galaxy clusters and large scale structures contain large numbers of dwarf galaxies (e.g., Phillipps et al. 1998, and references therein) and since Gallagher, Littleton, & Matthews (1995) and Phillipps et al. have shown that in these structures the distribution of the dwarfs tends to be more spatially extended than that of the giant galaxies, it seems more likely that Ly lines with dwarfs 100-200 kpc away are due to gas in the large scale structures where the dwarfs are found rather than the dwarfs themselves.
The hypothesis that many low redshift Ly absorption lines with in the range from 50 to 500 mÅ trace the overall gas distribution in the large scale structures rather than gaseous halos of individual galaxies is physically plausible and is consistent with existing observations. However, it is probably true that a variety of phenomena cause Ly absorption lines in QSO spectra. The gaseous disks and halos of individual galaxies will certainly produce Ly absorption if the QSO sight line passes close enough, and these will probably be stronger lines. Additional studies at low redshift should ultimately allow the determination of all sites of origin for this important tracer of cosmic phenomena.
7. Summary
We have obtained high signal-to-noise UV spectra of the QSOs H 1821+643 ( = 0.297) and PG 1116+215 ( = 0.177) with the GHRS in order to study the nature of low H I Ly absorbers and their relationship with galaxies. The spectra have S/N ranging from 75 to 160 per 150 km s-1 resolution element and permit the detection of weak Ly lines. Toward H 1821+643 and PG 1116+215 we find 26 and 13 Ly lines, respectively, with 3 rest equivalent widths 50 mÅ (not including lines within 3000 km s-1 of ). The previous best studied sight line for Ly lines as weak as 50 mÅ, 3C 273, showed 13 Ly lines with 50 mÅ at 3 significance or better (Morris et al. 1993). We have also measured 98 and 118 galaxy redshifts in the fields centered on H 1821+643 and PG 1116+215 with the multiobject spectrograph on the WIYN Telescope. With 56 additional redshifts from the literature, we have a total of 154 redshifts in the H 1821+643 field. Within a 20’ radius from the QSO, we estimate that our H 1821+643 and PG 1116+215 redshift surveys are respectively 72.4% and 85.0% complete for 18.0 and 50.8% and 68.5% complete for 20.0.
From our new data combined with data from previous studies we obtain the following results.
(1) The number of Ly lines detected per unit redshift with 50 mÅ is at 0.28.
(2) Several of the stronger Ly profiles show complex multiple component structure, but there is no compelling evidence of clustering in the two-point velocity correlation function of the whole sample. However, if we exclude the weakest lines ( 100 mÅ), the two-point correlation function shows a marginal signal (3) on velocity scales of 500 km s-1.
(3) All galaxies within projected distances of 600 kpc have associated Ly absorbers with 1000 km s-1, and the Ly equivalent widths are anticorrelated at high significance with the projected distance of the nearest galaxy out to 600 kpc. Further studies are needed to establish whether this anticorrelation is real or due to selection effects. For kpc, we find galaxies which do not have associated Ly lines. However, the anticorrelation continues to Mpc for galaxies within 500 or 1000 km s-1 of a Ly absorber. Most of these galaxy-absorber pairs have 350 km s-1.
(4) We find three prominent galaxy clusters which do not have associated strong Ly absorbers. However, we also find galaxy groups which do have associated Ly absorbers.
(5) As in previous studies, we find Ly lines in voids at large distances from the nearest galaxies, but this may be due to the limited spatial coverage (at low ) or limited depth (at high ) of the galaxy redshift survey. Statistically, the equivalent width distributions of the void and non-void absorbers are indistinguishable, but the sample is small.
(6) Statistical tests show that the Ly absorbers are not randomly distributed with respect to the galaxies. Splitting the sample into roughly equal groups of weak ( 100 mÅ) and strong absorbers shows that the weak absorbers are also not randomly distributed. Comparison of the nearest neighbor distances of the weak and strong absorbers suggests that the weak absorbers may be less closely associated with galaxies than the strong absorbers, but with the small sample this difference is not yet statistically significant.
(7) The observations are consistent with the hypothesis that many of the low redshift Ly absorbers with rest equivalent widths in the range from 50 to 500 mÅ trace the overall gas distributions in the large scale structures in which galaxies reside rather than the gaseous halos of individual galaxies. However, it is likely that not all Ly lines are produced in this way. Some of the stronger Ly lines may arise in the halos of individual galaxies.
References
- (1) Bahcall, J. N., et al. 1993, ApJS, 87, 1
- (2) Bahcall, J. N., Jannuzi, B. T., Schneider, D. P., Hartig, G. F., Bohlin, R., & Junkkarinen, V. 1991, ApJ, 377, L5
- (3) Bahcall, J. N., Jannuzi, B. T., Schneider, D. P., Hartig, G. F., & Green, R. F. 1992, ApJ, 397, 68
- (4) Barlow, T. A., & Sargent, W. L. W. 1997, AJ, 113, 136
- (5) Bi, H., & Davidsen, A. F. 1997, ApJ, 479, 523
- (6) Bowen, D. V., Blades, J. C., & Pettini, M. 1996, ApJ, 464, 141
- (7) Bowen, D. V., Pettini, M., & Boyle, B.J. 1998, MNRAS, submitted
- (8) Brandt, J. C. et al. 1997, AJ, 114, 554
- (9) Bruhweiler, F. C., Boggess, A., Norman, D. J., Grady, C. A., Urry, C. M., & Kondo, Y. 1993, ApJ, 409, 199
- (10) Burns, J. O. 1998, Science, 280, 400
- (11) Cardelli, J. A., & Ebbets, D. C. 1994, in Calibrating Hubble Space Telescope: Proceedings of a Workshop held at STScI, ed. J. C. Blades & S. J. Osmer (Baltimore: STScI), 322
- (12) Carswell, R. F., Lanzetta, K. M., Parnell, H. C., & Webb, J. K. 1991, ApJ, 371, 36
- (13) Cen, R., Miralda-Escudé, J., Ostriker, J. P., & Rauch, M. 1994, ApJ, 437, L9
- (14) Chen, H.-W., Lanzetta, K. M., Webb, J. K., & Barcons, X. 1998, ApJ, 498, 77
- (15) de Vaucouleurs, G., de Vaucouleurs, A., Corwin, H. G., Buta, R. J., Paturel, G., & Fouque, P. 1991, Third Reference Catalog of Bright Galaxies (Springer, New York)
- (16) Dinshaw, N., Foltz, C. B., Impey, C. D., Weymann, R. J., & Morris, S. L. 1995, Nature, 373, 223
- (17) Dinshaw, N., Weymann, R. J., Impey, C. D., Foltz, C. B., Morris, S. L., & Ake, T. 1997, ApJ, 491, 45
- (18) Gallagher, J. S. III, Littleton, J. E., & Matthews, L. D. 1995, AJ, 109, 2003
- (19) Grogin, N. A., & Geller, M. J. 1998, ApJ, in press
- (20) Hall, P. B., Ellingson, E., & Green, R. F. 1997, AJ, 113, 1179
- (21) Hamann, F., Barlow, T. A., & Junkkarinen, V. 1997a, ApJ, 478, 87
- (22) Hamann, F., Barlow, T. A., Junkkarinen, V., & Burbidge, E. M. 1997b, ApJ, 478, 80
- (23) Heckman, T. M., Dahlem, M., Lehnert, M. D., Fabbiano, G., Gilmore, D., & Waller, W. H. 1995, ApJ, 448, 98
- (24) Hernquist, L., Katz, N., Weinberg, D. H., & Miralda- Escudé, J. 1996, ApJ, 457, L51
- (25) Hoffman, G. L., Lu, N. Y., Salpeter, E. E., Connell, B. M., & Fromhold-Treu, R. 1998, ApJ, in press
- (26) Hu, E. M., Kim, T.-S., Cowie, L. L., Songaila, A., & Rauch, M. 1995, AJ, 110, 1526 referencehunt93 Hunter, D. A., Hawley, W. N., & Gallagher, J. S. 1993, AJ, 106, 1797
- (27) Jannuzi, B. T. et al. 1998, ApJS, 118, in press
- (28) Kirhakos, S., Sargent, W. L. W., Schneider, D. P., Bahcall, J. N., Jannuzi, B. T., Maoz, D., & Small, T. A. 1994, PASP, 106, 646
- (29) Kirkman, D., & Tytler, D. 1997, ApJ, 484, 672
- (30) Lanzetta, K. M., Bowen, D. V., Tytler, D., & Webb, J. K. 1995, ApJ, 442, 538
- (31) Lanzetta, K. M., Webb, J. K., & Barcons, X. 1996, ApJ, 456, L17
- (32) Lanzetta, K. M., Webb, J. K., & Barcons, X. 1997, in Proceedings of the 13th IAP Colloquium, Structure and Evolution of the Intergalactic Medium from QSO Absorption Lines, ed. P. Petitjean & S. Charlot, (Paris: Editions Frontieres), 213
- (33) Le Brun, V., Bergeron, J., & Boissé, P. 1996, A&A, 306, 691
- (34) Linder, S., 1998, ApJ, 495, 637
- (35) Lockman, F. J., & Savage, B. D. 1995, ApJS, 97, 1
- (36) Loveday, J., Peterson, B. A., Efstathiou, G., & Maddox, S. J. 1992, ApJ, 390, 338
- (37) Lu, L., Sargent, W. L. W., Womble, D. S., & Takada-Hidai, M. 1996, ApJ, 472, 509
- (38) Lu, L., Savage, B. D., & Sembach, K. R. 1994, ApJ, 426, 563
- (39) Lu, L., Wolfe, A. M., & Turnshek, D. A. 1991, ApJ, 367, 19
- (40) Martin, C. 1998, ApJ, in press
- (41) Miralda-Escudé, J., Cen, R., Ostriker, J. P., & Rauch, M. 1996, ApJ, 471, 582
- (42) Mo, H. J., & Morris, S. L. 1994, MNRAS, 269, 52
- (43) Morris, S. L., & van den Bergh, S. 1994, ApJ, 427, 696
- (44) Morris, S. L., Weymann, R. J., Dressler, A., McCarthy, P. J., Smith, B. A., Terrile, R. J., Giovanelli, R., & Irwin, M. 1993, ApJ, 419, 524
- (45) Morris, S. L., Weymann, R. J., Savage, B. D., & Gilliland, R. L. 1991, ApJ, 377, L21
- (46) Morton, D. C. 1991, ApJS, 77, 119
- (47) Morton, D. C., York, D. G., & Jenkins, E. B. 1988, ApJS, 68, 449
- (48) Nath, B. B., & Trentham, N. 1997, MNRAS, 291, 505
- (49) Peebles, P. J. E. 1993, Principles of Physical Cosmology (Princeton: Princeton Univ. Press), 331
- (50) Petitjean, P., Mücket, J. P., & Kates, R. E. 1995, A&A, 295, L9
- (51) Phillipps, S., Driver, S. P., Couch, W. J., & Smith, R. M. 1998, 498, L119
- (52) Press, W. H., Teukolsky, S. A., Vetterling, W. T., & Flannery, B. P. 1992, (Cambridge: Cambridge University Press), 634
- (53) Rauch, M., et al. 1997, ApJ, 489, 7
- (54) Rauch, M., Weymann, R. J., & Morris, S. L. 1996, ApJ, 458, 518
- (55) Riediger, R., Petitjean, P., & Mücket, J. P. 1998, A&A, 329, 30
- (56) Robinson, R. D., et al. 1998, PASP, 110, 68
- (57) Roettiger, K., Stone, J. M., & Mushotzky, R. F. 1998, ApJ, 493, 62
- (58) Salzer, J. J. 1992, AJ, 103, 385
- (59) Savage, B. D., Cardelli, J. A., & Sofia, U. J. 1992, ApJ, 401, 706
- (60) Savage, B. D., & Sembach, K. R. 1996, ApJ, 470, 893
- (61) Savage, B. D., Sembach, K. R., & Lu, L. 1995, ApJ, 449, 145
- (62) Savage, B. D., Sembach, K. R., & Lu, L. 1997, AJ, 113, 2158
- (63) Savage, B. D., Tripp, T. M., & Lu, L. 1998, AJ, 115, 436
- (64) Schneider, D. P., Bahcall, J. N., Gunn, J. E., & Dressler, A. 1992, AJ, 103, 1047
- (65) Shull, J. M. 1997, in Proceedings of the 13th IAP Colloquium, Structure and Evolution of the Intergalactic Medium from QSO Absorption Lines, ed. P. Petitjean & S. Charlot, (Paris: Editions Frontieres), 101
- (66) Shull, J. M., Stocke, J. T., & Penton, S. 1996, AJ, 111, 72
- (67) Stocke, J. T., Shull, J. M., Penton, S., Donahue, M., & Carilli, C. 1995, ApJ, 451, 24
- (68) Tonry, J., & Davis, M. 1979, AJ, 84, 1511
- (69) Tripp, T. M. 1997, PhD Dissertation, University of Wisconsin-Madison
- (70) Tripp, T. M., Jannuzi, B. T. et al. 1998, in preparation
- (71) Tripp, T. M., Lu, L., & Savage, B. D. 1996, ApJS, 102, 239
- (72) Tyson, J. A., & Jarvis, J. F. 1979, ApJ, 230, L153
- (73) Ulmer, A. 1996, ApJ, 473, 110
- (74) Valdes, F. 1982, in SPIE, Instrumentation in Astronomy IV, 331, 465
- (75) van Gorkom, J. H., Bahcall, J. N., Jannuzi, B., & Schneider, D. 1993, AJ, 106, 2213
- (76) van Gorkom, J. H, Carilli, C. L., Stocke, J. T., Perlman, E. S., & Shull, J. M. 1996, AJ, 112, 1397
- (77) Wang, B. 1995, ApJ, 444, L17
- (78) Weinberg, D. H., Miralda-Escudé, J., Hernquist, L., & Katz, N. 1997, ApJ, 490, 564
- (79) Weir, N., Djorgovski, S., & Fayyad, U. M. 1995, AJ, 110, 1
- (80) Weymann, R. J. et al. 1998, ApJ, submitted
- (81) Zaritsky, D., Smith, R., Frenk, C., & White, S. D. M. 1997, ApJ, 478, 39
- (82) Zhang, Y., Anninos, P., Norman, M. L., & Meiksin, A. 1997, 485, 496
- (83) Zhang, Y., Meiksin, A., Anninos, P., & Norman, M. L. 1998, ApJ, in press
| RA | Dec | aaWeighted mean and weighted uncertainty based on redshifts measured with 2-3 templates (see §2.3). For redshifts from the literature, uncertainties are listed when provided in the original papers. All redshifts are heliocentric. | aaWeighted mean and weighted uncertainty based on redshifts measured with 2-3 templates (see §2.3). For redshifts from the literature, uncertainties are listed when provided in the original papers. All redshifts are heliocentric. | POSS II bbFor a few objects, no magnitude is available from the POSS II database. In most cases, this indicates that the object is too faint to be detected in the POSS II survey. However, in some cases this may be due to misclassification in the POSS II database or close proximity to a bright star. | ccAbsolute magnitude calculated using interstellar extinction corrections based on from Lockman & Savage (1995) and the K- correction from Peebles(1993), = 2.5 log . | ddImpact parameter (i.e., projected distance to sight line). The QSO coordinates (J2000) are RA = 18:21:57.2, Dec = +64:20:36. | ||||||
|---|---|---|---|---|---|---|---|---|---|---|---|---|
| (J2000) | (km s-1) | (Mpc) | ||||||||||
| Redshifts from Tripp et al. (1998) | ||||||||||||
| 18:17:12.35 | 64:33:56.0 | 0.02089 | 12 | 0.788 | ||||||||
| 18:21:41.17 | 63:51:38.0 | 0.02404 | 17 | 17.4 | -17.8 | 0.783 | ||||||
| 18:21:27.36 | 64:12:11.3 | 0.02752 | 12 | 20.6 | -14.9 | 0.277 | ||||||
| 18:23:25.35 | 64: 8:34.2 | 0.05003 | 48 | 15.6 | -21.2 | 0.832 | ||||||
| 18:21:49.15 | 64:37:49.0 | 0.05024 | 36 | 15.8 | -21.0 | 0.936 | ||||||
| 18:22:31.72 | 64:35:29.9 | 0.05051 | 49 | 16.7 | -20.2 | 0.838 | ||||||
| 18:18:14.76 | 64:18:23.5 | 0.05059 | 25 | 18.2 | -18.6 | 1.322 | ||||||
| 18:21:52.71 | 64:39: 0.1 | 0.05062 | 16 | 17.5 | -19.4 | 1.006 | ||||||
| 18:16:24.99 | 64: 5:11.9 | 0.05062 | 18 | 18.9 | -18.0 | 2.147 | ||||||
| 18:22:41.28 | 64:10:27.8 | 0.05067 | 12 | 18.0 | -18.8 | 0.613 | ||||||
| 18:22:50.89 | 64: 9:20.2 | 0.05079 | 55 | 0.696 | ||||||||
| 18:24:21.41 | 64: 6:26.3 | 0.05090 | 48 | 15.5 | -21.3 | 1.161 | ||||||
| 18:23:42.37 | 64:32:54.2 | 0.05231 | 35 | 17.9 | -19.0 | 0.943 | ||||||
| 18:24:33.29 | 64:16:14.5 | 0.05245 | 31 | 17.9 | -19.0 | 0.987 | ||||||
| 18:16:31.37 | 64:43:54.6 | 0.06553 | 36 | 16.9 | -20.5 | 2.916 | ||||||
| 18:22:30.84 | 64: 4:13.7 | 0.07103 | 30 | 17.6 | -20.0 | 1.251 | ||||||
| 18:24:33.51 | 64: 6:21.0 | 0.07149 | 34 | 18.9 | -18.7 | 1.663 | ||||||
| 18:20:56.89 | 64:27:54.5 | 0.07170 | 27 | 18.3 | -19.3 | 0.736 | ||||||
| 18:27:46.25 | 64:14:28.2 | 0.07177 | 73 | 17.0 | -20.6 | 2.886 | ||||||
| 18:25:46.50 | 64: 7:56.7 | 0.07192 | 44 | 18.4 | -19.2 | 2.107 | ||||||
| 18:25:43.04 | 64:53:37.3 | 0.07608 | 29 | 18.4 | -19.3 | 3.246 | ||||||
| 18:18:17.51 | 64:34:37.3 | 0.07843 | 37 | 18.7 | -19.1 | 2.242 | ||||||
| 18:26:16.03 | 63:54: 5.7 | 0.08343 | 28 | 18.2 | -19.7 | 3.334 | ||||||
| 18:24:29.24 | 64: 1: 5.2 | 0.08432 | 37 | 18.8 | -19.1 | 2.224 | ||||||
| 18:23:38.83 | 64:41:47.7 | 0.08796 | 41 | 2.151 | ||||||||
| 18:22:29.42 | 64:41: 6.7 | 0.08822 | 40 | 17.7 | -20.3 | 1.881 | ||||||
| 18:23:44.86 | 64:42:47.0 | 0.08834 | 45 | 18.5 | -19.5 | 2.266 | ||||||
| 18:19:44.77 | 64:23: 7.3 | 0.08846 | 100 | 17.7 | -20.3 | 1.319 | ||||||
| 18:20:42.96 | 64:19:45.8 | 0.08930 | 67 | 19.4 | -18.7 | 0.739 | ||||||
| 18:18:35.52 | 64:14:22.3 | 0.09532 | 57 | 18.1 | -20.1 | 2.201 | ||||||
| 18:25:52.36 | 64:40: 7.5 | 0.09574 | 57 | 17.8 | -20.4 | 3.105 | ||||||
| 18:24:28.05 | 64:16:42.7 | 0.09701 | 66 | 18.4 | -19.8 | 1.651 | ||||||
| 18:23:29.55 | 64:40:22.6 | 0.10614 | 96 | 18.8 | -19.7 | 2.351 | ||||||
| 18:24:40.32 | 64:34:54.8 | 0.10642 | 35 | 17.8 | -20.6 | 2.413 | ||||||
| 18:21:36.59 | 64:45:23.6 | 0.10682 | 32 | 17.8 | -20.7 | 2.658 | ||||||
| 18:20: 7.54 | 65: 4: 0.3 | 0.10689 | 38 | 17.4 | -21.1 | 4.804 | ||||||
| 18:25:53.45 | 64:19:19.7 | 0.11156 | 79 | 18.8 | -19.8 | 2.839 | ||||||
| 18:20: 8.65 | 64:21: 4.2 | 0.11208 | 102 | 20.2 | -18.3 | 1.308 | ||||||
| 18:25: 4.45 | 64:25:22.9 | 0.11957 | 99 | 18.9 | -19.8 | 2.445 | ||||||
| 18:21: 0.88 | 64: 3:55.7 | 0.12120 | 105 | 2.112 | ||||||||
| 18:22: 2.65 | 64:21:39.3 | 0.12154 | 70 | 18.3 | -20.5 | 0.144 | ||||||
| 18:21:22.38 | 64:28:29.0 | 0.12224 | 34 | 18.5 | -20.2 | 1.046 | ||||||
| 18:23:58.19 | 64:26:52.3 | 0.12258 | 76 | 17.3 | -21.5 | 1.740 | ||||||
| 18:21:20.26 | 64: 3:44.8 | 0.13774 | 59 | 18.5 | -20.5 | 2.291 | ||||||
| 18:21:57.42 | 63:52:44.3 | 0.14220 | 206 | 3.782 | ||||||||
| 18:28:15.51 | 64:33:39.5 | 0.14228 | 70 | 18.3 | -20.8 | 5.816 | ||||||
| 18:22: 4.38 | 64: 8:38.5 | 0.15465 | 59 | 18.9 | -20.4 | 1.741 | ||||||
| 18:22:49.76 | 64:19:28.6 | 0.16376 | 100 | 0.882 | ||||||||
| 18:16:24.55 | 64: 2: 6.2 | 0.16556 | 94 | 18.2 | -21.2 | 6.238 | ||||||
| 18:16:43.64 | 64:34:56.2 | 0.16564 | 39 | 17.9 | -21.6 | 5.635 | ||||||
| 18:21:36.61 | 64:21:25.0 | 0.17086 | 74 | 19.1 | -20.4 | 0.373 | ||||||
| 18:19:24.36 | 64: 7:53.6 | 0.17919 | 100 | 18.4 | -21.2 | 3.414 | ||||||
| 18:19:55.22 | 64:35: 8.4 | 0.18012 | 56 | 18.9 | -20.7 | 3.213 | ||||||
| 18:21:14.82 | 64:12:16.4 | 0.18504 | 35 | 20.9 | -18.7 | 1.592 | ||||||
| 18:20:24.54 | 63:56:31.0 | 0.18532 | 97 | 19.4 | -20.2 | 4.377 | ||||||
| 18:20:21.11 | 63:59: 1.2 | 0.18547 | 39 | 19.3 | -20.4 | 4.022 | ||||||
| 18:19:45.65 | 64:30:52.5 | 0.18596 | 95 | 19.1 | -20.5 | 2.945 | ||||||
| 18:20:25.56 | 64:23:59.0 | 0.18599 | 52 | 21.0 | -18.7 | 1.760 | ||||||
| 18:20:25.99 | 64:14:57.5 | 0.18742 | 63 | 1.925 | ||||||||
| 18:20:43.29 | 65: 0:15.1 | 0.18921 | 40 | 18.6 | -21.1 | 6.885 | ||||||
| 18:22:25.14 | 64:22:46.2 | 0.18967 | 40 | 19.9 | -19.8 | 0.635 | ||||||
| 18:22:53.12 | 64:55:24.0 | 0.19117 | 56 | 19.1 | -20.7 | 6.060 | ||||||
| 18:21:18.06 | 63:53:47.8 | 0.19161 | 39 | 18.7 | -21.0 | 4.667 | ||||||
| 18:22:29.69 | 64:23: 8.2 | 0.19162 | 53 | 19.1 | -20.6 | 0.745 | ||||||
| 18:22:20.96 | 64:26:52.2 | 0.19212 | 35 | 18.1 | -21.6 | 1.167 | ||||||
| 18:23:59.02 | 64:25:58.7 | 0.19213 | 59 | 18.8 | -21.0 | 2.450 | ||||||
| 18:22:14.04 | 64: 3: 5.4 | 0.20057 | 54 | 18.9 | -21.0 | 3.134 | ||||||
| 18:21:38.82 | 64:20:31.7 | 0.22650 | 32 | 19.8 | -20.3 | 0.388 | ||||||
| 18:23:47.60 | 64: 3:16.8 | 0.24433 | 49 | 19.6 | -20.7 | 4.340 | ||||||
| 18:21:56.28 | 64:22:50.4 | 0.24435 | 64 | 20.2 | -20.1 | 0.462 | ||||||
| 18:22:19.11 | 64:18:43.5 | 0.24568 | 86 | 20.8 | -19.5 | 0.625 | ||||||
| 18:20:31.50 | 64:20:24.0 | 0.25147 | 72 | 19.8 | -20.5 | 1.950 | ||||||
| 18:22:10.26 | 64:17:15.6 | 0.26669 | 80 | 0.795 | ||||||||
| 18:24: 4.97 | 63:52:38.0 | 0.27548 | 116 | 19.1 | -21.5 | 7.001 | ||||||
| 18:20:31.98 | 64:22:19.7 | 0.27889 | 114 | 20.1 | -20.4 | 2.119 | ||||||
| 18:22:30.01 | 64:13:16.4 | 0.27987 | 55 | 20.6 | -19.9 | 1.845 | ||||||
| 18:23:50.02 | 63:52: 3.2 | 0.28420 | 100 | 19.5 | -21.1 | 7.115 | ||||||
| 18:22: 0.23 | 64:18:48.9 | 0.28787 | 62 | 21.1 | -19.5 | 0.419 | ||||||
| 18:21:48.70 | 64:24:20.4 | 0.28858 | 78 | 20.9 | -19.7 | 0.891 | ||||||
| 18:21:39.29 | 64:22: 4.8 | 0.28880 | 92 | 20.5 | -20.2 | 0.564 | ||||||
| 18:21:34.40 | 64:20:31.0 | 0.29044 | 82 | 21.4 | -19.2 | 0.574 | ||||||
| 18:21:53.32 | 64:20:23.7 | 0.29056 | 83 | 0.109 | ||||||||
| 18:21:58.42 | 64:18:24.1 | 0.29116 | 89 | 20.9 | -19.7 | 0.512 | ||||||
| 18:21:19.97 | 64:22:57.1 | 0.29216 | 53 | 20.2 | -20.5 | 1.088 | ||||||
| 18:22:19.84 | 64:23:36.1 | 0.29305 | 79 | 20.7 | -20.0 | 0.905 | ||||||
| 18:21:44.81 | 64:24:11.2 | 0.29359 | 97 | 20.3 | -20.4 | 0.896 | ||||||
| 18:22:33.10 | 64:18:50.8 | 0.29481 | 54 | 21.1 | -19.6 | 1.000 | ||||||
| 18:21:58.69 | 64:26:45.7 | 0.29552 | 84 | 21.3 | -19.4 | 1.448 | ||||||
| 18:21:37.00 | 64:23:28.6 | 0.29606 | 101 | 20.7 | -20.0 | 0.850 | ||||||
| 18:22:27.25 | 64:18:20.3 | 0.29639 | 74 | 0.933 | ||||||||
| 18:22: 3.51 | 64:23: 0.9 | 0.29766 | 80 | 19.8 | -20.9 | 0.592 | ||||||
| 18:22:12.61 | 64:26:32.9 | 0.29828 | 66 | 20.2 | -20.5 | 1.460 | ||||||
| 18:21:29.76 | 64:27:42.3 | 0.30025 | 50 | 21.0 | -19.7 | 1.828 | ||||||
| 18:21:55.72 | 64:20: 3.1 | 0.30294 | 55 | 0.137 | ||||||||
| 18:24:45.87 | 64:33: 8.2 | 0.30512 | 85 | 19.9 | -20.8 | 5.302 | ||||||
| 18:21:39.49 | 64:15:20.8 | 0.30529 | 50 | 20.7 | -20.0 | 1.343 | ||||||
| 18:22:11.36 | 64:28:50.5 | 0.33069 | 144 | 20.8 | -20.1 | 2.121 | ||||||
| 18:20:33.20 | 64:22:13.1 | 0.33233 | 40 | 20.3 | -20.7 | 2.344 | ||||||
| Redshifts from Schneider et al. (1992) | ||||||||||||
| 18:21:54.40 | 64:20: 9.3 | 0.22560 | 150 | 19.5 | -20.6 | 0.105 | ||||||
| 18:21:55.98 | 64:21: 0.8 | 0.29160 | 150 | 19.8 | -20.9 | 0.101 | ||||||
| 18:21:59.36 | 64:19:49.2 | 0.29360 | 300 | 21.4 | -19.2 | 0.191 | ||||||
| 18:21:54.23 | 64:20:13.4 | 0.29860 | 300 | 0.117 | ||||||||
| 18:21:52.80 | 64:20:43.9 | 0.30060 | 300 | 21.3 | -19.4 | 0.118 | ||||||
| 18:21:54.97 | 64:21:17.1 | 0.30310 | 300 | 19.0 | -21.7 | 0.174 | ||||||
| Redshifts from Le Brun et al. (1996) | ||||||||||||
| 18:22:20.16 | 64:21:46.7 | 0.17850 | 20.8 | -18.8 | 0.447 | |||||||
| 18:22: 4.57 | 64:20:52.5 | 0.28440 | 0.193 | |||||||||
| 18:21:30.35 | 64:20:44.8 | 0.29090 | 20.8 | -19.8 | 0.677 | |||||||
| 18:22:10.61 | 64:20:29.0 | 0.29170 | 0.339 | |||||||||
| 18:21:47.72 | 64:20: 8.9 | 0.29200 | 0.262 | |||||||||
| 18:21:55.01 | 64:20: 4.7 | 0.29300 | 0.134 | |||||||||
| 18:21:51.21 | 64:20:52.1 | 0.29380 | 0.164 | |||||||||
| 18:22: 1.07 | 64:20:29.0 | 0.29500 | 0.102 | |||||||||
| 18:22:28.30 | 64:20:39.5 | 0.29530 | 0.791 | |||||||||
| 18:21:34.30 | 64:21: 0.9 | 0.29660 | 0.592 | |||||||||
| 18:22:13.61 | 64:20:14.5 | 0.29690 | 0.427 | |||||||||
| 18:21:44.59 | 64:21:18.5 | 0.29700 | 19.9 | -20.8 | 0.363 | |||||||
| 18:21:17.91 | 64:21:23.5 | 0.29770 | 1.022 | |||||||||
| 18:21:27.64 | 64:21:59.6 | 0.29980 | 0.828 | |||||||||
| 18:22:20.16 | 64:20:39.8 | 0.30000 | 0.590 | |||||||||
| 18:22:31.94 | 64:19:34.7 | 0.30100 | 0.927 | |||||||||
| 18:22:34.80 | 64:20:51.6 | 0.30100 | 0.970 | |||||||||
| 18:21:57.96 | 64:20:44.1 | 0.30130 | 20.9 | -19.8 | 0.037 | |||||||
| 18:22: 6.59 | 64:19:50.2 | 0.30180 | 0.303 | |||||||||
| Redshifts from Bowen et al. (1998) | ||||||||||||
| 18:23:16.01 | 64: 4:52.9 | 0.02754 | 16.6 | -18.9 | 0.550 | |||||||
| 18:20: 2.47 | 64:18:53.0 | 0.02788 | 18.5 | -17.0 | 0.390 | |||||||
| 18:22:36.11 | 64:45:44.9 | 0.04970 | 1.370 | |||||||||
| 18:22: 7.61 | 64:39:32.4 | 0.05039 | 18.1 | -18.7 | 1.033 | |||||||
| 18:24:34.11 | 64:19: 4.1 | 0.05050 | 17.2 | -19.7 | 0.931 | |||||||
| 18:23:34.34 | 64:18:35.1 | 0.05099 | 17.8 | -19.0 | 0.590 | |||||||
| 18:21:21.38 | 64:49:40.4 | 0.05683 | 18.5 | -18.5 | 1.784 | |||||||
| 18:22:47.01 | 63:59:28.6 | 0.07201 | 17.3 | -20.3 | 1.646 | |||||||
| 18:23:41.16 | 64: 1: 8.3 | 0.07249 | 17.8 | -19.8 | 1.710 | |||||||
| 18:26: 1.05 | 64:23:16.4 | 0.07623 | 17.7 | -20.0 | 2.106 | |||||||
| 18:17:26.18 | 64:19:43.7 | 0.08210 | 18.6 | -19.3 | 2.492 | |||||||
| 18:22: 9.95 | 64: 9:36.9 | 0.08410 | 18.3 | -19.6 | 0.960 | |||||||
| 18:19:10.44 | 64: 7:27.4 | 0.09458 | 18.6 | -19.5 | 2.152 | |||||||
| 18:25:26.87 | 64:36:39.1 | 0.09517 | 18.4 | -19.8 | 2.678 | |||||||
| 18:25: 4.56 | 64:40:35.8 | 0.09583 | 18.4 | -19.8 | 2.761 | |||||||
| 18:24:33.84 | 64:38:51.2 | 0.09605 | 17.4 | -20.8 | 2.421 | |||||||
| 18:24:40.55 | 64: 2:45.1 | 0.09681 | 17.5 | -20.8 | 2.471 | |||||||
| 18:25:20.57 | 64:16:35.7 | 0.09697 | 18.8 | -19.5 | 2.201 | |||||||
| 18:20:53.45 | 64:19:37.1 | 0.11155 | 18.6 | -20.0 | 0.773 | |||||||
| 18:22:40.55 | 64: 9:43.7 | 0.12050 | 18.5 | -20.2 | 1.402 | |||||||
| 18:18: 2.25 | 64:14: 4.2 | 0.12103 | 17.9 | -20.8 | 3.124 | |||||||
| 18:25: 8.16 | 64: 9:17.3 | 0.13853 | 18.5 | -20.5 | 3.139 | |||||||
| 18:21: 8.73 | 63:52: 9.0 | 0.15039 | 18.4 | -20.8 | 4.111 | |||||||
| 18:19:34.62 | 64:42:21.0 | 0.16410 | 19.3 | -20.1 | 4.054 | |||||||
| 18:18:28.71 | 64:38: 3.6 | 0.16550 | 18.9 | -20.5 | 4.362 | |||||||
| 18:19:40.64 | 64:30:38.5 | 0.17955 | 18.7 | -20.9 | 2.916 18:18:17.71 | 64:16:15.9 | 0.18002 | 18.2 | -21.4 | 3.962 | ||
| 18:21:35.27 | 64:25:24.0 | 0.18900 | 0.911 | |||||||||
| 18:23:15.55 | 64:33: 5.6 | 0.19188 | 19.4 | -20.3 | 2.596 | |||||||
| 18:21:25.61 | 64: 2:11.0 | 0.19406 | 18.2 | -21.5 | 3.253 | |||||||
| 18:21: 0.73 | 64:37:54.3 | 0.26650 | 19.0 | -21.5 | 4.016 | |||||||
| RA | Dec | aaWeighted mean and weighted uncertainty based on redshifts measured with 2-3 templates (see §2.3). All redshifts are heliocentric. | aaWeighted mean and weighted uncertainty based on redshifts measured with 2-3 templates (see §2.3). All redshifts are heliocentric. | POSS II bbFor a few objects, no magnitude is available from the POSS II database. In most cases, this indicates that the object is too faint to be detected in the POSS II survey. However, in some cases this may be due to misclassification in the POSS II database or close proximity to a bright star. | ccAbsolute magnitude calculated using interstellar extinction corrections based on from Lockman & Savage (1995) and the K- correction from Peebles(1993), = 2.5 log . | ddImpact parameter (i.e., projected distance to sight line). The QSO coordinates (J2000) are RA = 11:19:08.7, Dec = +21:19:18. |
|---|---|---|---|---|---|---|
| (J2000) | (km s-1) | (Mpc) | ||||
| 11:20:46.06 | 21:11:15.2 | 0.02053 | 42 | 17.6 | -17.1 | 0.557 |
| 11:19:16.67 | 20:48:49.3 | 0.02077 | 34 | 13.8 | -20.9 | 0.715 |
| 11:21: 0.27 | 21:20:13.8 | 0.02122 | 26 | 14.4 | -20.3 | 0.622 |
| 11:18:44.44 | 21:33:51.6 | 0.02128 | 34 | 15.1 | -19.6 | 0.374 |
| 11:18:45.81 | 21:28:27.9 | 0.02131 | 54 | 16.3 | -18.4 | 0.254 |
| 11:19: 1.68 | 21:46: 6.3 | 0.02140 | 37 | 17.1 | -17.6 | 0.647 |
| 11:18:22.07 | 21:30: 4.3 | 0.02153 | 48 | 18.2 | -16.6 | 0.371 |
| 11:20:38.52 | 21:11:36.8 | 0.02156 | 45 | 18.0 | -16.8 | 0.541 |
| 11:18:46.12 | 21: 1:55.3 | 0.02612 | 37 | 18.9 | -16.2 | 0.531 |
| 11:18:43.36 | 21:27:23.6 | 0.03235 | 44 | 17.1 | -18.5 | 0.359 |
| 11:20:38.81 | 21: 0:49.8 | 0.03744 | 35 | 17.1 | -18.8 | 1.153 |
| 11:21:29.42 | 21:35:32.2 | 0.04107 | 51 | 16.6 | -19.5 | 1.643 |
| 11:19: 9.67 | 21: 2:43.2 | 0.04108 | 47 | 17.9 | -18.2 | 0.746 |
| 11:19:24.29 | 21:10:30.3 | 0.05916 | 40 | 16.6 | -20.4 | 0.601 |
| 11:18:33.69 | 21:13: 0.8 | 0.05963 | 68 | 17.2 | -19.7 | 0.655 |
| 11:19:59.04 | 21:31:53.8 | 0.05976 | 20 | 18.1 | -18.9 | 1.096 |
| 11:21:25.04 | 20:58:37.3 | 0.05986 | 43 | 17.9 | -19.1 | 2.420 |
| 11:16:55.43 | 21: 8:59.8 | 0.06003 | 51 | 15.6 | -21.4 | 2.094 |
| 11:21:24.08 | 21:14: 2.0 | 0.06016 | 38 | 16.8 | -20.1 | 2.050 |
| 11:19:43.67 | 21:26:52.0 | 0.06055 | 45 | 16.6 | -20.4 | 0.717 |
| 11:21: 9.19 | 21:40:43.0 | 0.06056 | 38 | 18.6 | -18.4 | 2.275 |
| 11:21:29.82 | 21:37: 7.4 | 0.06076 | 71 | 18.0 | -19.0 | 2.417 |
| 11:19:42.06 | 21:26:10.7 | 0.06134 | 36 | 19.2 | -17.8 | 0.677 |
| 11:21:32.33 | 20:42: 2.3 | 0.06750 | 87 | 17.2 | -20.0 | 3.568 |
| 11:21:35.88 | 21:26:52.5 | 0.07017 | 56 | 17.9 | -19.4 | 2.587 |
| 11:21:39.67 | 20:58:11.5 | 0.07048 | 75 | 16.9 | -20.5 | 3.039 |
| 11:18: 5.82 | 20:59:42.8 | 0.08076 | 24 | 2.046 | ||
| 11:19:52.05 | 21:30: 2.7 | 0.08247 | 53 | 17.4 | -20.3 | 1.256 |
| 11:20:39.86 | 21: 0: 4.4 | 0.08353 | 42 | 18.0 | -19.7 | 2.470 |
| 11:18:54.00 | 21: 5:38.1 | 0.08369 | 27 | 17.6 | -20.1 | 1.216 |
| 11:18:23.11 | 21: 7:17.4 | 0.08373 | 50 | 16.8 | -20.9 | 1.385 |
| 11:20:30.00 | 21:31:31.7 | 0.08442 | 49 | 16.7 | -21.0 | 1.960 |
| 11:18:51.61 | 21: 4:42.6 | 0.09181 | 91 | 17.5 | -20.4 | 1.417 |
| 11:19: 0.09 | 21: 6:39.8 | 0.09195 | 35 | 16.7 | -21.2 | 1.200 |
| 11:19:10.35 | 21: 4:31.2 | 0.09282 | 33 | 17.2 | -20.7 | 1.398 |
| 11:21:40.80 | 21:29: 0.7 | 0.10225 | 77 | 18.2 | -19.9 | 3.776 |
| 11:21:53.61 | 20:50:37.8 | 0.10252 | 38 | 17.4 | -20.7 | 4.946 |
| 11:17:12.60 | 21:35:39.9 | 0.11236 | 52 | 17.9 | -20.5 | 3.522 |
| 11:19: 5.59 | 21:34: 9.2 | 0.11492 | 73 | 17.6 | -20.8 | 1.690 |
| 11:19: 2.35 | 21:34:58.2 | 0.11542 | 48 | 17.4 | -20.9 | 1.796 |
| 11:17:21.62 | 21:28:38.6 | 0.11767 | 44 | 17.6 | -20.9 | 3.087 |
| 11:20: 3.85 | 21:43:48.5 | 0.11786 | 61 | 18.1 | -20.3 | 3.212 |
| 11:17:31.41 | 20:38:53.6 | 0.13213 | 143 | 17.3 | -21.4 | 5.923 |
| 11:20: 9.44 | 21: 8:28.8 | 0.13398 | 36 | 18.7 | -20.0 | 2.303 |
| 11:19:13.61 | 21:34:44.7 | 0.13450 | 48 | 17.9 | -20.8 | 2.008 |
| 11:19: 5.08 | 21:15: 3.0 | 0.13736 | 70 | 18.6 | -20.2 | 0.572 |
| 11:19: 6.67 | 21:18:28.3 | 0.13814 | 50 | 18.4 | -20.4 | 0.127 |
| 11:18:50.00 | 21:16:11.0 | 0.13845 | 28 | 19.8 | -19.0 | 0.711 |
| 11:18:46.04 | 21: 6:11.2 | 0.13861 | 30 | 19.2 | -19.6 | 1.879 |
| 11:19:47.84 | 21:15:44.7 | 0.13863 | 40 | 18.1 | -20.7 | 1.301 |
| 11:20:58.83 | 20:39:38.2 | 0.14004 | 82 | 19.2 | -19.6 | 6.336 |
| 11:21:26.73 | 20:41:58.9 | 0.14021 | 65 | 18.5 | -20.4 | 6.615 |
| 11:19:44.75 | 21:32:11.3 | 0.14058 | 38 | 2.068 | ||
| 11:21:10.72 | 20:39:17.9 | 0.14072 | 60 | 19.5 | -19.3 | 6.609 |
| 11:18:57.41 | 21:44:42.3 | 0.14096 | 45 | 18.5 | -20.3 | 3.442 |
| 11:17:35.31 | 21:26:34.1 | 0.14481 | 46 | 18.2 | -20.7 | 3.159 |
| 11:18: 5.00 | 21: 9:47.8 | 0.14549 | 53 | 18.4 | -20.5 | 2.438 |
| 11:21:16.99 | 20:51:34.1 | 0.14616 | 59 | 18.2 | -20.7 | 5.664 |
| 11:20:20.93 | 20:48:28.0 | 0.14652 | 66 | 19.0 | -19.9 | 4.888 |
| 11:20: 8.52 | 20:51:14.5 | 0.14656 | 63 | 18.2 | -20.7 | 4.360 |
| 11:19:59.62 | 21:12: 9.8 | 0.14695 | 79 | 18.6 | -20.4 | 1.930 |
| 11:18: 0.70 | 21:23:50.2 | 0.14828 | 40 | 19.4 | -19.5 | 2.313 |
| 11:19:16.56 | 21: 1:50.6 | 0.15010 | 63 | 18.1 | -20.8 | 2.490 |
| 11:18: 1.86 | 20:56:26.6 | 0.15263 | 41 | 18.0 | -21.0 | 3.978 |
| 11:19:26.00 | 21:12:30.7 | 0.16362 | 35 | 18.0 | -21.2 | 1.200 |
| 11:20:27.74 | 21:10:57.0 | 0.16431 | 34 | 19.7 | -19.5 | 3.084 |
| 11:20:20.20 | 21: 9:53.2 | 0.16444 | 67 | 20.3 | -18.9 | 2.920 |
| 11:20:21.95 | 21: 6:43.4 | 0.16478 | 54 | 18.6 | -20.6 | 3.241 |
| 11:20: 9.85 | 21:21:30.6 | 0.16487 | 20 | 18.9 | -20.3 | 2.203 |
| 11:20:13.05 | 21: 9:44.7 | 0.16496 | 64 | 18.6 | -20.6 | 2.720 |
| 11:19: 3.12 | 21:11: 2.6 | 0.16535 | 69 | 17.6 | -21.6 | 1.281 |
| 11:20:52.18 | 21:21:56.1 | 0.16540 | 110 | 19.3 | -19.9 | 3.716 |
| 11:20:24.16 | 20:58:54.0 | 0.16552 | 60 | 17.8 | -21.4 | 4.132 |
| 11:19:18.07 | 21:15: 3.5 | 0.16581 | 51 | 18.3 | -20.8 | 0.733 |
| 11:18:34.78 | 21:25:37.0 | 0.16604 | 64 | 18.9 | -20.3 | 1.555 |
| 11:19:19.33 | 21:12:42.4 | 0.16627 | 63 | 18.9 | -20.3 | 1.084 |
| 11:20:14.66 | 20:44:30.1 | 0.16645 | 38 | 18.2 | -21.0 | 5.863 |
| 11:18:43.84 | 20:44: 6.7 | 0.16660 | 72 | 18.7 | -20.5 | 5.499 |
| 11:19:23.36 | 21: 2:27.7 | 0.16661 | 71 | 18.6 | -20.6 | 2.649 |
| 11:18:46.74 | 20:43:36.2 | 0.16696 | 134 | 18.7 | -20.5 | 5.570 |
| 11:18:59.62 | 20:39: 3.1 | 0.16712 | 36 | 18.7 | -20.5 | 6.230 |
| 11:20: 1.20 | 21:35:54.4 | 0.16934 | 71 | 18.6 | -20.7 | 3.220 |
| 11:18: 4.50 | 21:35:55.0 | 0.16995 | 47 | 18.4 | -20.8 | 3.500 |
| 11:19:19.27 | 21: 5: 7.0 | 0.17305 | 30 | 19.3 | -20.0 | 2.287 |
| 11:19:25.97 | 21: 6:47.9 | 0.17311 | 44 | 18.5 | -20.8 | 2.087 |
| 11:19:53.62 | 21: 7:29.0 | 0.17321 | 89 | 18.7 | -20.6 | 2.510 |
| 11:18:55.59 | 21: 3:56.6 | 0.17365 | 36 | 18.6 | -20.7 | 2.494 |
| 11:18:53.56 | 21: 2:42.6 | 0.17503 | 53 | 18.4 | -20.9 | 2.719 |
| 11:18:17.00 | 21:33:47.9 | 0.17522 | 52 | 18.4 | -20.9 | 3.023 |
| 11:19:27.74 | 21: 6:36.9 | 0.17523 | 58 | 18.3 | -21.0 | 2.156 |
| 11:21:23.89 | 21: 7:59.2 | 0.17532 | 41 | 19.0 | -20.3 | 5.373 |
| 11:18:17.59 | 20:57:40.0 | 0.17532 | 57 | 18.9 | -20.4 | 3.964 |
| 11:19:31.52 | 21:18: 6.5 | 0.17585 | 34 | 18.9 | -20.4 | 0.876 |
| 11:18:29.05 | 21:39:46.0 | 0.17605 | 91 | 18.7 | -20.6 | 3.615 |
| 11:19:23.63 | 21: 7: 3.6 | 0.17625 | 49 | 19.1 | -20.2 | 2.051 |
| 11:18:51.14 | 21:35:16.3 | 0.17640 | 100 | 18.8 | -20.5 | 2.659 |
| 11:18:41.96 | 21:28:28.4 | 0.17784 | 71 | 18.7 | -20.6 | 1.799 |
| 11:18: 0.53 | 21:36:44.8 | 0.17895 | 53 | 18.7 | -20.6 | 3.846 |
| 11:18:34.04 | 21:31:35.3 | 0.17915 | 71 | 18.2 | -21.2 | 2.400 |
| 11:17:59.33 | 21:36:29.6 | 0.17928 | 99 | 18.6 | -20.7 | 3.852 |
| 11:19:34.11 | 21:37:20.7 | 0.17997 | 74 | 18.7 | -20.7 | 3.111 |
| 11:19:16.68 | 21:18:58.3 | 0.18018 | 36 | 19.3 | -20.1 | 0.309 |
| 11:18:35.21 | 21:48:31.9 | 0.18083 | 85 | 18.1 | -21.3 | 4.974 |
| 11:20:24.89 | 20:50:32.3 | 0.18821 | 57 | 5.734 | ||
| 11:20:35.98 | 21: 5:38.0 | 0.18884 | 64 | 18.9 | -20.6 | 4.166 |
| 11:20:54.43 | 20:42:16.8 | 0.20676 | 77 | 19.7 | -20.0 | 8.104 |
| 11:20:12.33 | 21:50:47.0 | 0.21159 | 56 | 18.4 | -21.3 | 6.447 |
| 11:18: 0.69 | 21: 7: 2.9 | 0.21189 | 61 | 19.8 | -20.0 | 3.717 |
| 11:20:25.71 | 21: 2:36.0 | 0.21236 | 114 | 18.7 | -21.0 | 4.556 |
| 11:19:47.13 | 21:28:56.1 | 0.21409 | 65 | 19.2 | -20.5 | 2.458 |
| 11:21:44.40 | 20:56:12.0 | 0.21418 | 88 | 18.6 | -21.2 | 8.048 |
| 11:20:42.03 | 20:39:46.6 | 0.21465 | 59 | 19.1 | -20.7 | 8.453 |
| 11:19:45.21 | 21:31: 9.9 | 0.22931 | 63 | 18.9 | -21.0 | 2.870 |
| 11:19:18.91 | 21:39:52.4 | 0.25950 | 68 | 18.8 | -21.3 | 4.450 |
| 11:19:10.61 | 21:43: 2.3 | 0.25982 | 67 | 19.3 | -20.8 | 5.106 |
| 11:21:23.82 | 21:33:49.3 | 0.27284 | 62 | 19.2 | -21.1 | 7.706 |
| 11:20:32.81 | 21:25:42.8 | 0.27577 | 39 | 19.5 | -20.8 | 4.619 |
| 11:20:20.17 | 21:36: 1.3 | 0.27807 | 37 | 18.9 | -21.4 | 5.317 |
| 10’ Radius | 20’ Radius | 30’ Radius | |||||
|---|---|---|---|---|---|---|---|
| Magnitude | aaRedshift at which the limiting magnitude corresponds to a 1 galaxy. | CompletenessbbPercentage of targets for which redshifts were obtained. | Scale | CompletenessbbPercentage of targets for which redshifts were obtained. | Scale | CompletenessbbPercentage of targets for which redshifts were obtained. | Scale |
| Limit | (Mpc) | (Mpc) | (Mpc) | ||||
| 17.0 | 0.048 | 100% | 0.5 | 100% | 1.0 | 83.3% | 1.6 |
| 18.0 | 0.076 | 85.7% | 0.8 | 85.0% | 1.6 | 81.1% | 2.4 |
| 19.0 | 0.121 | 88.2% | 1.2 | 86.9% | 2.4 | 78.1% | 3.6 |
| 20.0 | 0.191 | 70.4% | 1.7 | 68.5% | 3.4 | 63.8% | 5.1 |
| Wavelength | Identification | |||||||||
|---|---|---|---|---|---|---|---|---|---|---|
| (Å) | (mÅ) | (km s-1) | ||||||||
| 1253.66 | 15311 | S II 1253.81 | 0.0 | -51 | ||||||
| 1256.43 | 47712 | H I 1025.72 | 0.22484 | |||||||
| 1260.15 | 137918bbStrongly blended line. The individual equivalent widths derived from profile parameters measured with VPFIT are listed in parentheses following the total equivalent width of the blend. | (214) | S II 1259.52 | 0.0 | -51 | |||||
| (1105) | Si II 1260.42 | 0.0 | -68 | |||||||
| (243) | H I 972.54 | 0.29678 | ||||||||
| 1264.11 | 15714 | O VI 1031.93 | 0.22501 | |||||||
| 1266.92 | 24612 | C III 977.02 | 0.29676 | |||||||
| 1271.00 | 10710 | O VI 1037.62 | 0.22501 | |||||||
| 1277.21 | 10015 | C I 1277.46ccThis ISM line may be blended with an extragalactic H I Ly line (see text §3.1.1), which could cause this ISM line to have a more positive velocity than the other ISM lines. | 0.0 | +21 | ||||||
| 1284.82 | 9215 | H I 1215.67 | 0.05704 | |||||||
| 1293.55 | 6616 | H I 1215.67 | 0.06432 | |||||||
| 1297.39 | 17014 | H I 1215.67 | 0.06722 | |||||||
| 1302.04ddContaminated by geocoronal O I emission. | 92116 | O I 1302.17 | 0.0 | -29 | ||||||
| 1304.08ddContaminated by geocoronal O I emission. | 54211 | Si II 1304.37 | 0.0 | -68 | ||||||
| 1317.20 | 16119 | Ni II 1317.22 | 0.0 | -46 | ||||||
| 1323.93 | 5112 | H I 1215.67 | 0.08910 | |||||||
| 1328.96 | 7210 | C I 1329.34 | 0.0 | +21 | ||||||
| 1330.09 | 42213 | H I 1025.72 | 0.29677 | |||||||
| 1334.25 | 87310 | C II 1334.53 | 0.0 | -63 | ||||||
| 1335.43 | 1749 | C II* 1335.71 | 0.0 | -31 | ||||||
| 1338.60 | 21416 | O VI 1031.93 | 0.29676 | |||||||
| 1346.01 | 12314 | O VI 1037.62 | 0.29676 | |||||||
| 1351.19 | 7311 | H I 1215.67 | 0.11152 | |||||||
| 1361.16 | 11410 | H I 1215.67 | 0.11974 | |||||||
| 1363.15 | 71919bbStrongly blended line. The individual equivalent widths derived from profile parameters measured with VPFIT are listed in parentheses following the total equivalent width of the blend. | (438) | H I 1215.67 | 0.12123 | ||||||
| (396) | H I 1215.67 | 0.12157 | ||||||||
| 1366.23 | 3913 | H I 1215.67 | 0.12385 | |||||||
| 1368.44 | 4915 | H I 1215.67 | 0.12566 | |||||||
| 1369.86 | 8915 | Ni II 1370.13 | 0.0 | -46 | ||||||
| 1370.91 | 4615 | H I 1215.67 | 0.12781 | |||||||
| 1393.40 | 45220 | Si IV 1393.76 | 0.0 | -75 | ||||||
| 1395.08 | 26317 | H I 1215.67 | 0.14760 | |||||||
| 1402.26 | 20021 | Si IV 1402.77 | 0.0 | -75 | ||||||
| 1407.17 | 7917 | H I 1215.67 | 0.15727 | |||||||
| 1414.41 | 6310 | H I 1215.67 | 0.16350 | |||||||
| 1422.21 | 61220 | H I 1215.67 | 0.16990 | |||||||
| 1433.46 | 8413 | H I 1215.67 | 0.17915 | |||||||
| 1435.09 | 8915 | H I 1215.67 | 0.18049 | |||||||
| 1454.67 | 8620 | Ni II 1454.84 | 0.0 | -46 1456.33 | 6918 | H I 1215.67 | 0.19794 | |||
| 1457.67 | 3514 | H I 1215.67: | 0.19905 | |||||||
| 1470.44 | 3915 | H I 1215.67: | 0.20961 | |||||||
| 1473.03 | 12617 | H I 1215.67 | 0.21176 | |||||||
| 1474.87 | 58622 | H I 1215.67 | 0.21325 | |||||||
| 1478.27 | 17718 | H I 1215.67eeThe identification of this line is ambiguous; this could be Si III 1206.5 associated with the O VI absorber at = 0.22503. However, for reasons noted in the text (§3.1.2, see also Savage et al. 1998), we believe the absorption is dominated by H I Ly. | 0.21577 | |||||||
| 1488.90 | 90527 | H I 1215.67 | 0.22484 | |||||||
| 1490.56 | 34325 | H I 1215.67 | 0.22621 | |||||||
| 1492.61 | 8714 | H I 1215.67 | 0.22782 | |||||||
| 1506.05 | 5719 | H I 1215.67 | 0.23864 | |||||||
| 1509.05 | 9820 | H I 1215.67 | 0.24132 | |||||||
| 1513.28 | 9820 | H I 1215.67 | 0.24514 | |||||||
| 1526.39 | 90232 | Si II 1526.71 | 0.0 | -51 | ||||||
| 1529.75 | 14442 | H I 1215.67 | 0.25822 | |||||||
| 1533.36 | 22943 | H I 1215.67 | 0.26163 |
| Wavelength | bbAs discussed in the text (§3.1.2), the ISM N V 1238.80, Mg II 1239.93, and Mg II 1240.39 Å lines are all located near this feature. However, as argued in §3.1.2, we believe this absorption is dominated by an extragalactic Ly line at = 0.01950. | Identification | |||
|---|---|---|---|---|---|
| (Å) | (mÅ) | (km s-1) | |||
| 1235.41 | 11229 | H I 1215.67 | 0.01639 | ||
| 1239.40 | 17024 | H I 1215.67bbAs discussed in the text (§3.1.2), the ISM N V 1238.80, Mg II 1239.93, and Mg II 1240.39 Å lines are all located near this feature. However, as argued in §3.1.2, we believe this absorption is dominated by an extragalactic Ly line at = 0.01950. | 0.01950 | ||
| 1250.30 | 32228ccStrongly blended line. The individual equivalent widths derived from profile parameters measured with VPFIT are listed in parentheses following the total equivalent width of the blend. | (173) | H I 1215.67 | 0.02845 | |
| (72) | S II 1250.58 | 0.0 | +14 | ||
| 1253.86 | 18923 | S II 1253.81 | 0.0 | +14 | |
| 1255.00 | 9517 | H I 1215.67 | 0.03223 | ||
| 1260.51 | 107728c,dc,dfootnotemark: | (196) | S II 1259.52 | 0.0 | +14 |
| (851) | Si II 1260.42 | 0.0 | +60 | ||
| 1265.66 | 17137 | H I 1215.67 | 0.04125 | ||
| 1287.46 | 16624 | H I 1215.67 | 0.05905 | ||
| 1289.55 | 6622 | H I 1215.67 | 0.06079 | ||
| 1302.30 | 46733 | O I 1302.17 | 0.0 | +35 | |
| 1304.51 | 46630 | Si II 1304.37 | 0.0 | +60 | |
| 1314.42 | 11919 | H I 1215.67 | 0.08118 | ||
| 1317.42 | 14728 | Ni II 1317.21 | 0.0 | +26 | |
| 1328.46 | 7023 | H I 1215.67 | 0.09279 | ||
| 1335.00 | 104835ccStrongly blended line. The individual equivalent widths derived from profile parameters measured with VPFIT are listed in parentheses following the total equivalent width of the blend. | (845) | C II 1334.53 | 0.0 | +61 |
| (176) | C II* 1335.71 | 0.0 | +54 | ||
| 1360.48 | 13225 | H I 1215.67 | 0.11910 | ||
| 1373.69 | 9116 | Si III 1206.50 | 0.13852 | ||
| 1375.70 | 6115 | H I 1215.67 | 0.13159 | ||
| 1384.16 | 54332ccStrongly blended line. The individual equivalent widths derived from profile parameters measured with VPFIT are listed in parentheses following the total equivalent width of the blend. | (509) | H I 1215.67 | 0.13861 | |
| (96) | H I 1215.67 | 0.13862 | |||
| 1393.83 | 48436ddThe Milky Way lines of Si II 1260.42 Å and Si IV 1393.76, 1402.77 Å contain substructure implying the detection of a high velocity cloud at 200 km s-1. This cloud was not detected in the wideband H I 21 cm observations of Lockman & Savage (1995). | Si IV 1393.76 | 0.0 | +43 | |
| 1402.88 | 22829ddThe Milky Way lines of Si II 1260.42 Å and Si IV 1393.76, 1402.77 Å contain substructure implying the detection of a high velocity cloud at 200 km s-1. This cloud was not detected in the wideband H I 21 cm observations of Lockman & Savage (1995). | Si IV 1402.77 | 0.0 | +43 | |
| 1417.78 | 86524ccStrongly blended line. The individual equivalent widths derived from profile parameters measured with VPFIT are listed in parentheses following the total equivalent width of the blend. | (177) | H I 1215.67 | 0.16547 | |
| (121) | H I 1215.67 | 0.16616 | |||
| (314) | H I 1215.67 | 0.16697 | |||
| 1426.81 | 30815 | H I 1215.67 | 0.17366 | ||
| 1435.10 | 4615 | Si II 1260.42: | 0.13858 | ||
| 1448.43 | 6714 | UID |
| Wavelength | Identification | Referencebb References: (1) Savage, Sembach, & Lu (1995). These measurements are from GHRS G160M observations with a resolution of 18 km s-1 and a 3 detection limit of 50 mÅ; (2) Bahcall et al. (1993). These measurements are from FOS observations with a resolution of 300 km s-1 with a 3 detection limit of 150 mÅ for 1550 Å. | ||
|---|---|---|---|---|
| (Å) | (mÅ) | |||
| 1244.466 | 18323 | H I 1025.72 | 0.213260.00003 | 1 |
| 1245.500 | 29723 | H I 1215.67 | 0.024540.00001 | 1 |
| 1247.858 | 05216 | H I 1025.72 | 0.216560.00004 | 1 |
| 1256.400 | 45927 | H I 1025.72 | 0.224890.00001 | 1 |
| 1261.124 | 22716 | H I 972.54 | 0.296740.00002 | 1 |
| 1264.138 | 20618 | O VI 1031.93 | 0.225030.00001 | 1 |
| 1265.579 | 04714 | H I 1215.67 | 0.041050.00002 | 1 |
| 1266.917 | 24719 | C III 977.02 | 0.296720.00001 | 1 |
| 1529.486 | 16821 | H I 1215.67 | 0.258140.00003 | 1 |
| 1533.635 | 20617 | H I 1215.67 | 0.261560.00002 | 1 |
| 1539.773 | 20622 | H I 1215.67 | 0.266600.00002 | 1 |
| 1576.93 | 68010 | H I 1215.67 | 0.2972 | 2 |
| aaRest equivalent width. | DistancebbAbsorber-galaxy three-dimensional and projected distances assuming = 75 km s-1 Mpc-1 and neglecting any departures from a pure Hubble flow. | Projected | cc where is the mean of and . | RA(gal) | Dec(gal) | ||
|---|---|---|---|---|---|---|---|
| (mÅ) | (Mpc) | DistancebbAbsorber-galaxy three-dimensional and projected distances assuming = 75 km s-1 Mpc-1 and neglecting any departures from a pure Hubble flow. (Mpc) | (km s-1) | (2000) | (2000) | ||
| 0.02454 | 290 | 2.103 | 0.783 | 146 | 18:21:41.17 | 63:51:38.0 | 0.02404 |
| 0.04105 | 45 | 33.136 | 1.370 | -2481 | 18:22:36.11 | 64:45:44.9 | 0.04970 |
| 0.05704 | 87 | 1.954 | 1.784 | 60 | 18:21:21.38 | 64:49:40.4 | 0.05683 |
| 0.06432 | 62 | 5.405 | 2.916 | -341 | 18:16:31.37 | 64:43:54.6 | 0.06553 |
| 0.06722 | 159 | 6.985 | 2.916 | 475 | 18:16:31.37 | 64:43:54.6 | 0.06553 |
| 0.08910 | 47 | 1.043 | 0.739 | -55 | 18:20:42.96 | 64:19:45.8 | 0.08930 |
| 0.11152 | 66 | 0.780 | 0.773 | -8 | 18:20:53.45 | 64:19:37.1 | 0.11155 |
| 0.11974 | 102 | 2.520 | 2.445 | 46 | 18:25: 4.45 | 64:25:22.9 | 0.11957 |
| 0.12123 | 391 | 1.122 | 0.144 | -83 | 18:22: 2.65 | 64:21:39.3 | 0.12154 |
| 0.12157 | 353 | 0.180 | 0.144 | 8 | 18:22: 2.65 | 64:21:39.3 | 0.12154 |
| 0.12385 | 35 | 4.871 | 1.740 | 339 | 18:23:58.19 | 64:26:52.3 | 0.12258 |
| 0.12566 | 44 | 11.164 | 1.740 | 821 | 18:23:58.19 | 64:26:52.3 | 0.12258 |
| 0.12781 | 41 | 18.790 | 1.740 | 1393 | 18:23:58.19 | 64:26:52.3 | 0.12258 |
| 0.14760 | 229 | 10.627 | 4.111 | -728 | 18:21: 8.73 | 63:52: 9.0 | 0.15039 |
| 0.15727 | 68 | 9.319 | 1.741 | 679 | 18:22: 4.38 | 64: 8:38.5 | 0.15465 |
| 0.16350 | 54 | 1.263 | 0.882 | -67 | 18:22:49.76 | 64:19:28.6 | 0.16376 |
| 0.16990 | 523 | 3.340 | 0.373 | -246 | 18:21:36.61 | 64:21:25.0 | 0.17086 |
| 0.17915 | 71 | 2.278 | 0.447 | 165 | 18:22:20.16 | 64:21:46.7 | 0.17850 |
| 0.18049 | 75 | 3.455 | 3.213 | 94 | 18:19:55.22 | 64:35: 8.4 | 0.18012 |
| 0.19794 | 58 | 9.446 | 3.134 | -657 | 18:22:14.04 | 64: 3: 5.4 | 0.20057 |
| 0.19905 | 29 | 6.027 | 3.134 | -380 | 18:22:14.04 | 64: 3: 5.4 | 0.20057 |
| 0.20961 | 32 | 30.669 | 3.134 | 2249 | 18:22:14.04 | 64: 3: 5.4 | 0.20057 |
| 0.21176 | 104 | 37.867 | 3.134 | 2781 | 18:22:14.04 | 64: 3: 5.4 | 0.20057 |
| 0.21326 | 483 | 41.249 | 0.105 | -3034 | 18:21:54.40 | 64:20: 9.3 | 0.22560 |
| 0.21656 | 145 | 30.185 | 0.105 | -2219 | 18:21:54.40 | 64:20: 9.3 | 0.22560 |
| 0.22489 | 739 | 2.367 | 0.105 | -174 | 18:21:54.40 | 64:20: 9.3 | 0.22560 |
| 0.22621 | 280 | 1.040 | 0.388 | -71 | 18:21:38.82 | 64:20:31.7 | 0.22650 |
| 0.22782 | 71 | 4.407 | 0.388 | 322 | 18:21:38.82 | 64:20:31.7 | 0.22650 |
| 0.23864 | 46 | 18.822 | 0.462 | -1379 | 18:21:56.28 | 64:22:50.4 | 0.24435 |
| 0.24132 | 79 | 9.987 | 0.462 | -731 | 18:21:56.28 | 64:22:50.4 | 0.24435 |
| 0.24514 | 79 | 1.882 | 0.625 | -130 | 18:22:19.11 | 64:18:43.5 | 0.24568 |
| 0.25814 | 134 | 21.884 | 1.950 | 1594 | 18:20:31.50 | 64:20:24.0 | 0.25147 |
| 0.26156 | 163 | 16.547 | 4.016 | -1172 | 18:21: 0.73 | 64:37:54.3 | 0.26650 |
| 0.26660 | 163 | 0.847 | 0.795 | -21 | 18:22:10.26 | 64:17:15.6 | 0.26669 |
| 0.29674 | 524 | 0.665 | 0.427 | -37 | 18:22:13.61 | 64:20:14.5 | 0.29690 |
| aaRest equivalent width. | DistancebbAbsorber-galaxy three-dimensional and projected distances assuming = 75 km s-1 Mpc-1 and neglecting any departures from a pure Hubble flow. | Projected | cc where is the mean of and . | RA(gal) | Dec(gal) | ||
|---|---|---|---|---|---|---|---|
| (mÅ) | (Mpc) | DistancebbAbsorber-galaxy three-dimensional and projected distances assuming = 75 km s-1 Mpc-1 and neglecting any departures from a pure Hubble flow. (Mpc) | (km s-1) | (2000) | (2000) | ||
| 0.01639 | 110 | 16.261 | 0.557 | -1219 | 11:20:46.06 | 21:11:15.2 | 0.02053 |
| 0.01950 | 167 | 4.075 | 0.557 | -303 | 11:20:46.06 | 21:11:15.2 | 0.02053 |
| 0.02845 | 168 | 9.085 | 0.531 | 680 | 11:18:46.12 | 21: 1:55.3 | 0.02612 |
| 0.03223 | 92 | 0.588 | 0.359 | -35 | 11:18:43.36 | 21:27:23.6 | 0.03235 |
| 0.04125 | 164 | 0.991 | 0.746 | 49 | 11:19: 9.67 | 21: 2:43.2 | 0.04108 |
| 0.05905 | 157 | 0.731 | 0.601 | -31 | 11:19:24.29 | 21:10:30.3 | 0.05916 |
| 0.06079 | 62 | 1.155 | 0.717 | 68 | 11:19:43.67 | 21:26:52.0 | 0.06055 |
| 0.08118 | 110 | 2.572 | 2.046 | 116 | 11:18: 5.82 | 20:59:42.8 | 0.08076 |
| 0.09279 | 64 | 1.402 | 1.398 | -8 | 11:19:10.35 | 21: 4:31.2 | 0.09282 |
| 0.11910 | 118 | 5.496 | 3.212 | 332 | 11:20: 3.85 | 21:43:48.5 | 0.11786 |
| 0.13159 | 54 | 6.227 | 5.923 | -143 | 11:17:31.41 | 20:38:53.6 | 0.13213 |
| 0.13861 | 447 | 0.909 | 0.711ddIn the perturbed Hubble flow model (see §5.1), the nearest neighbor is the galaxy at = 0.13814 with = 0.127 Mpc and = 125 km s-1. | 42ddIn the perturbed Hubble flow model (see §5.1), the nearest neighbor is the galaxy at = 0.13814 with = 0.127 Mpc and = 125 km s-1. | 11:18:50.00 | 21:16:11.0 | 0.13845 |
| 0.13862 | 84 | 0.932 | 0.711ddIn the perturbed Hubble flow model (see §5.1), the nearest neighbor is the galaxy at = 0.13814 with = 0.127 Mpc and = 125 km s-1. | 45ddIn the perturbed Hubble flow model (see §5.1), the nearest neighbor is the galaxy at = 0.13814 with = 0.127 Mpc and = 125 km s-1. | 11:18:50.00 | 21:16:11.0 | 0.13845 |
| 0.16547 | 152 | 1.347 | 1.281 | 31 | 11:19: 3.12 | 21:11: 2.6 | 0.16535 |
| 0.16616 | 104 | 1.149 | 1.084 | -28 | 11:19:19.33 | 21:12:42.4 | 0.16627 |
| 0.16697 | 269 | 2.658 | 1.084 | 180 | 11:19:19.33 | 21:12:42.4 | 0.16627 |
| 0.17366 | 262 | 2.495 | 2.494 | 3 | 11:18:55.59 | 21: 3:56.6 | 0.17365 |
| Galaxy | Nearest Lyman Absorber | |||||||
|---|---|---|---|---|---|---|---|---|
| RA | Dec | aaImpact parameter (i.e., projected distance) calculated assuming = 75 km s-1 Mpc-1 and = 0. | bbRest equivalent width. Ly lines within 350 km s-1 of each other are treated as a single absorber. Equivalent widths of individual components in these blends are listed in Tables 4 and 5. | cc where is the mean of and . For blended Ly lines, the equivalent width weighted mean redshift was used for . | Metals? | |||
| (J2000) | (kpc) | (mÅ) | (km s-1) | |||||
| PG 1116+215 | ||||||||
| 11:20:46.06 | 21:11:15.2 | 0.02053 | 557 | 0.01950 | 167ddThis line may be blended with the Galactic Mg II 1239.9, 1240.4 Å doublet and possibly Galactic N V 1238.8 Å (see §3.1.2). | -303 | ||
| 11:18:43.36 | 21:27:23.6 | 0.03235 | 359 | 0.03223 | 92eeBlended with Galactic S II 1253.8 Å. | -35 | ||
| 11:19:09.67 | 21:02:43.2 | 0.04108 | 746 | 0.04125 | 164 | 49 | ||
| 11:19:24.29 | 21:10:30.3 | 0.05916 | 601 | 0.05905 | 157 | -31 | ||
| 11:19:42.06 | 21:26:10.7 | 0.06134 | 677 | 0.06079 | 62 | -155 | ||
| 11:19:06.67 | 21:18:28.3 | 0.13814 | 127 | 0.13861,0.13862 | 531 | 125 | Si II, Si III | |
| H 1821+643 | ||||||||
| 18:21:41.17 | 63:51:38.0 | 0.02404 | 783 | 0.02454 | 290 | 146 | ||
| 18:20:42.96 | 64:19:45.8 | 0.08930 | 739 | 0.08910 | 47 | -55 | ||
| 18:20:53.45 | 64:19:37.1 | 0.11155 | 773 | 0.11152 | 66 | -8 | ||
| 18:22:02.65 | 64:21:39.3 | 0.12154 | 144 | 0.12123,0.12157 | 846 | -40 | ||
| 18:22:49.76 | 64:19:28.6 | 0.16376 | 882 | 0.16350 | 54 | -67 | ||
| 18:21:36.61 | 64:21:25.1 | 0.17086 | 373 | 0.16990 | 523 | -246 | ||
| 18:22:20.16 | 64:21:46.7 | 0.17850 | 447 | 0.17915,0.18049 | 146 | 340 | ||
| 18:21:54.40 | 64:20:09.3 | 0.22560 | 105 | 0.22489,0.22621 | 1019 | -85 | O VIffSee Savage, Tripp, & Lu (1998). | |
| 18:21:38.82 | 64:20:31.7 | 0.22650 | 388 | 0.22782 | 71 | 322 | ||
| 18:21:56.28 | 64:22:50.4 | 0.24435 | 462 | 0.24514 | 79 | 190 | ||
| 18:22:10.26 | 64:17:15.6 | 0.26669 | 795 | 0.26660 | 163 | -21 | ||
| Ly SampleaaSee §5.1 for a description of the samples. | Hubble Flow | Data Set 1 | Data Set 2 | KS D | KS ProbabilitybbProbability that Data Set 1 and Data Set 2 are drawn from the same distribution. |
|---|---|---|---|---|---|
| Total | Perturbed | Galaxy-Ly | Galaxy-Random | 0.305 | 1.4 |
| Total | Pure | Galaxy-Ly | Galaxy-Random | 0.250 | 6.5 |
| Complete | Perturbed | Galaxy-Ly | Galaxy-Random | 0.340 | 1.5 |
| Complete | Pure | Galaxy-Ly | Galaxy-Random | 0.285 | 5.2 |
| “1 Mpc” Complete | Perturbed | Galaxy-Ly | Galaxy-Random | 0.368 | 2.4 |
| “1 Mpc” Complete | Pure | Galaxy-Ly | Galaxy-Random | 0.299 | 1.2 |
| Total | Perturbed | Galaxy-Ly | Galaxy-Galaxy | 0.209 | 0.016 |
| Total | Pure | Galaxy-Ly | Galaxy-Galaxy | 0.239 | 3.8 |
| Complete | Perturbed | Galaxy-Ly | Galaxy-Galaxy | 0.135 | 0.38 |
| Complete | Pure | Galaxy-Ly | Galaxy-Galaxy | 0.200 | 0.05 |
| “1 Mpc” Complete | Perturbed | Galaxy-Ly | Galaxy-Galaxy | 0.118 | 0.67 |
| “1 Mpc” Complete | Pure | Galaxy-Ly | Galaxy-Galaxy | 0.188 | 0.14 |
| Ly SampleaaSee §5.1 for a description of the samples. | Hubble Flow | Data Set 1 | Data Set 2 | KS D | KS ProbabilitybbProbability that Data Set 1 and Data Set 2 are drawn from the same distribution. |
|---|---|---|---|---|---|
| Complete | Perturbed | Galaxy-Ly 100 mÅ) | Galaxy-Random | 0.380 | 3.2 |
| Complete | Perturbed | Galaxy-Ly 100 mÅ) | Galaxy-Random | 0.308 | 7.6 |
| Complete | Pure | Galaxy-Ly 100 mÅ) | Galaxy-Random | 0.345 | 9.9 |
| Complete | Pure | Galaxy-Ly 100 mÅ) | Galaxy-Random | 0.288 | 0.015 |
| Complete | Perturbed | Galaxy-Ly 100 mÅ) | Galaxy-Galaxy | 0.133 | 0.85 |
| Complete | Perturbed | Galaxy-Ly 100 mÅ) | Galaxy-Galaxy | 0.160 | 0.48 |
| Complete | Pure | Galaxy-Ly 100 mÅ) | Galaxy-Galaxy | 0.255 | 0.13 |
| Complete | Pure | Galaxy-Ly 100 mÅ) | Galaxy-Galaxy | 0.229 | 0.11 |
| Complete | Perturbed | Galaxy-Ly 200 mÅ) | Galaxy-Random | 0.544 | 5.5 |
| Complete | Perturbed | Galaxy-Ly 200 mÅ) | Galaxy-Random | 0.333 | 1.9 |
| Complete | Pure | Galaxy-Ly 200 mÅ) | Galaxy-Random | 0.283 | 6.0 |
| Complete | Pure | Galaxy-Ly 200 mÅ) | Galaxy-Random | 0.277 | 3.3 |
| Complete | Perturbed | Galaxy-Ly 200 mÅ) | Galaxy-Galaxy | 0.366 | 0.15 |
| Complete | Perturbed | Galaxy-Ly 200 mÅ) | Galaxy-Galaxy | 0.143 | 0.43 |
| Complete | Pure | Galaxy-Ly 200 mÅ) | Galaxy-Galaxy | 0.200 | 0.054 |
| Complete | Pure | Galaxy-Ly 200 mÅ) | Galaxy-Galaxy | 0.213 | 0.064 |