THE OPACITY OF NEARBY GALAXIES
FROM COLORS AND COUNTS OF BACKGROUND GALAXIES:
I. The Synthetic Field Method and its Application
to NGC 4536 & NGC 366411affiliation: Based on observations with the NASA/ESA Hubble
Space Telescope obtained at the Space Telescope Science Institute, which is
operated by the Association of Universities for Research in Astronomy, Incorporated, under NASA contract NAS5-26555.
Abstract
We describe a new, direct method for determining the opacity of foreground galaxies which does not require any a priori assumptions about the spatial distribution or the reddening law of the obscuring material. The method is to measure the colors and counts of background galaxies which can be identified through the foreground system. The method is calibrated, and the effects of confusion and obscuration are decoupled by adding various versions of a suitable deep reference frame containing only field galaxies with known properties into the image of the foreground galaxy, and analyzing these “synthetic field” images in the same way as the real images.
We test the method on HST WFPC2 archived images of two galaxies which are quite different: NGC 4536 is a large Sc spiral, and NGC 3664 is a small Magellanic irregular. The reference frames are taken from the Hubble Deep Field.
From the background galaxy counts, NGC 4536 shows an extinction 1 mag in the northwestern arm region, and lower than 0.5 mag in the corresponding interarm region (no correction for inclination has been attempted). However, from the galaxy colors, the same reddening of is observed in both the arm and the interarm regions. In the interarm region, the combination of extinction and reddening can be explained by a diffuse component with a Galactic reddening law (). In the spiral arm, however, the same diffuse, low opacity component seems to coexist with regions of much higher opacity. Since the exposures are shorter the results for NGC 3664 are less clear, but also appear to be consistent with a two component distribution.
keywords:
galaxies:individual (NGC 4536) – galaxies:individual (NGC 3664) – galaxies:irregular – galaxies:ISM – galaxies:photometry – galaxies:spiral – galaxies:statistics – ISM:dust,extinction – ISM:structure50610 October 1998 \slugcommentTo appear in ApJ number 506 \leftheadRosa A. González et al. \rightheadThe Opacity of Galaxies
1 INTRODUCTION
1.1 Historical background
The issue of whether galaxy disks are significantly opaque is a lively topic of current research and debate (e.g., Davies & Burstein 1995, and papers therein), and the conclusions of different workers often differ widely. Statistical evidence that most large presented by Valentijn (1990) based on a diameter-selected sample of galaxies from the ESO survey. Valentijn’s result indicated that the bright galaxies are substantially opaque right out to the 25 mag arcsec-2 isophote. This conclusion has been challenged by Burstein and others, who initially questioned the selection effects inherent in the sample used by Valentijn, and have maintained that very little extinction is present. More detailed studies on individual galaxies have generally concluded in favor of at least some extinction (e.g., studies of multicolor optical and infrared images by Block et al. 1994, and Peletier et al. 1994). There is also some indication that even galaxy halos may contain dust; Zaritski (1994) compared faint galaxies in fields bordering nearby spirals (NGC 2835 and NGC 3521) and in control fields further away on the sky, and found a small difference in the average colors. However, from analysis of surface photometry on a sample of 1700 galaxies, Giovanelli et al. (1995) have recently concluded that less luminous galaxies are completely transparent, and that even the most luminous spirals suffer from only small amounts of extinction (0.1 mag) at an isophotal radius of 23.5 mag arcsec-2 in .
Tests of the opacity of spiral disks which rely on intrinsic properties of the galaxies (surface brightness, inclination angle, isophotal profiles) are strongly dependent on the necessary assumption of just how the dust is distributed within the galaxy (Witt, Thronson, & Capuano 1992; Witt & Gordon 1996). For instance, layered models with a physically thin but optically thick dust layer behave like optically thin disks (Disney, Davies, & Phillips 1989). In the case of edge-on galaxies, surface photometry can help determine the geometrical dust distribution (Kylafis & Bahcall 1987), but in more general cases the results are inconclusive. The use of stars or star clusters embedded in the galaxy can only tell us something about the remaining opacity between us and the star, and is clearly biased to low opacities. HII regions have also been used; they have the same bias, but in addition those bright enough to be easily observed may alter the surrounding ISM so drastically that they are poor test objects (e.g., Allen et al. 1997).
A more direct approach has been proposed by White & Keel (1992), and followed up by White, Keel, & Conselice (1996) and Berlind et al. (1997). They have looked at partially-overlapping galaxy pairs, the first two studies at optical wavelengths, the last one in both the optical and the near-infrared. Assuming that the background galaxy isophotes are smooth and/or symmetric, they use the unobscured part of the background galaxy to calculate the amount of background light that is lost in crossing the foreground disk. All three studies have found higher extinction in the arms than in the interarm regions, and extinction curves flatter than Galactic, consistent with a patchy dust distribution in the foreground galaxy.
The use of background illuminating objects has the advantage that no assumptions need to be made about the relative distribution of dust and light in the foreground galaxy. Also, the overlapping-galaxy method in particular provides results with good spatial resolution. However, it is necessary to assume that the light distribution in the background galaxy image is smooth and centrally symmetric. In addition, there is an uncertain contribution of scattered light from the background galaxy into the line of sight. But perhaps the biggest disadvantage is that there are only about two dozen galaxy pairs which offer the right geometry for the method to be applied (White et al. 1996).
1.2 Distant field galaxies as probes
A potentially more general way to establish the opacity of a galaxy is to look for effects on the counts, colors, and morphologies of distant field galaxies seen through the disk of the foreground galaxy. This conceptually simple approach unfortunately suffers from an equally simple problem; the general distribution of disk stars in the foreground galaxy reduces the contrast on background galaxy images, and foreground star clusters and HII regions add strongly to the confusion. High sensitivity is required in order to reach a surface density of background galaxies which is large enough to derive a statistically significant result. High angular resolution and color information are required to assist with the separation and identification of background galaxy images from objects in the foreground galaxy.
Hubble Space Telescope (HST) Wide-Field Planetary Camera 2 (WFPC2) images offer a significant advantage over images from ground-based telescopes in their greatly improved resolution. This reduces the perturbation of faint galaxy images by nearby foreground objects, and facilitates the separation of stellar objects from galaxies. Color information is also important; a foreground compact HII region will be blue compared to the image of a distant galaxy, whether or not there is any amount of obscuration. Once galaxies have been identified, their counts and colors can be compared with counts and colors of galaxies in reference fields not covered by a foreground galaxy.
1.3 The data analysis problem
The HST WFPC2 Archive contains many images of background galaxy fields and of fields covering parts of nearby galaxies. As an example of the data available for this study, and an illustration of the analysis problems which must be overcome before quantitative results can be obtained, we show in the left panel of Figure 1 one WF frame (WF3, 13 13 in size) from a typical reference field (the Hubble Deep Field)111Noise has been added in order to approximate the shorter integration times used for the exposures of NGC 4536, as well as the higher sky background at the position of the spiral. The mosaic is displayed in the same scale as the NGC 4536 color image., and in the right panel a similar-sized portion of a deep exposure on NGC 4536. We shall describe both of these images in more detail in following sections of this paper. For the moment it is sufficient to note that the differences in the counts and colors of background galaxies visible in the two panels contain the information we seek on the opacity of the foreground galaxy. Only a few background galaxies can be discerned visually with any certainty in the right panel. However, before we can conclude that the foreground galaxy is quite opaque, we obviously need to understand quantitatively how the data analysis methods we use to determine the counts and colors of the background galaxies are affected by structural features in the foreground galaxy.
1.4 The “Synthetic Field” Method
In this paper we describe a new method, the Synthetic Field Method, which permits us to quantify and calibrate the effects of crowding and confusion and to determine the accuracy with which statements can be made about the total opacity and reddening of an average line of sight through the foreground galaxy. These synthetic fields are obtained by adding the HDF reference field images into the foreground galaxy image; the combined image is then processed in the same way as the original foreground galaxy image alone. The procedure is repeated with different values of extinction applied to the reference field, and a plot drawn of the final number counts in each simulation versus the assumed extinction in order to ascertain the “best” fit to the actual counts of real background galaxies. can be estimated separately from the biases owing to confusion and crowding in the foreground galaxy field. Finally, a comparison between the average colors of, respectively, the control HDF galaxies and the real background galaxies will allow an estimate of the degree of reddening.
Compared to the foreground galaxy fields we analyze, the HDF frames are virtually noiseless; synthetic fields can therefore be constructed by adding suitably attenuated versions of them directly into the foreground galaxy images, without degrading the sensitivity of the data.
Figure 2 shows 4 cumulative histograms of galaxy counts in images which illustrate the steps in the Synthetic Field Method: Histogram a is for field galaxies in a version of the HDF to which noise has been added in order to approximate the shorter integration time used for the exposures of NGC 4536, as well as the higher sky background at the position of the spiral; b is for HDF “control” galaxies in an un-extincted NGC 4536 simulation222That is to say a WF field of NGC 4536 into which the WF fields from the HDF have been added.; c is for HDF galaxies in a simulation with 0.6 mag of extinction at 333The control field has been attenuated to mimic 0.6 mag of extinction.; and finally d is for real background galaxies in the NGC 4536 field. From the figure, we would conclude that there is about 1 mag of extinction at averaged over the WF2 and WF3 fields in this region of the foreground galaxy444The results for each separate field do not differ significantly; the numbers of galaxies have been normalized to the area of one WF field., and about 0.1 mag of average extinction at in the region of NGC 4536 covered by the WF4 field.
1.5 Limitations of the method
Clearly, one major limitation of our method is that the results are only statistical in nature, i.e., the method does not give an answer for the extinction and reddening along any specific line of sight through the foreground galaxy, but only a statistical estimate of these quantities averaged over some substantial fraction of the foreground galaxy image. The accuracy of the method is limited not only by the counting statistics of background galaxies, but also by the intrinsic inhomogeneities in their spatial distribution. These uncertainties must also be quantified in order to provide a convincing result. In addition, there are several smaller selection effects which plague the analysis and which will be discussed later; for instance, the fact that field galaxies also show a mild color–magnitude dependence (Tyson 1988; Williams et al. 1996) must also be taken into account.
Another limitation is that, while the numbers of galaxies probe the whole disk (there is useful information in both detecting or not detecting a background galaxy), the conclusions from the colors of the galaxies will be biased in favor of regions of lower opacity (because we need to detect the galaxies in order to measure there colors). Therefore, it is possible to determine an extinction law by combining the number-count and color information only when we can safely assume that nowhere in the region of interest is the extinction so high that we cannot sample it with background galaxies (see Appendix).
1.6 Plan for this paper
In this paper we present a description of the Synthetic Field Method through a detailed application to deep WFPC2 images of the Sc spiral NGC 4536. In order to examine the range of applicability of the method, we also analyze shallow images of the SBm Magellanic dwarf irregular NGC 3664 (DDO95). We find substantial opacity in both galaxies, although the precision of the result is low for NGC 3664, a consequence of the shorter exposure time used for the observations of this galaxy. In future papers we intend to apply the method to images of other nearby galaxies drawn from the HST archives.
We begin in §2 with a discussion of the reference field and the processing necessary in order to render it useful for our present purposes. Next in §3 we describe the data on the foregound galaxy NGC 4536 which we have chosen to illustrate the method. Section 4 describes the methods we use to identify and measure the magnitudes of field galaxies. Section 5 presents the synthetic field simulations and the results on extinction through the disk of NGC 4536. Section 6 presents an abbreviated discussion applying the method to NGC 3664. In §7 we examine the various sources of errors and biases we have been able to identify. Finally, we summarize and discuss our results on the extinction and reddening through these two galaxies in §8.
2 THE REFERENCE FIELD
The choice of the reference field is clearly of prime importance to this method. For simplicity, images of this field ought to be available with the same camera and range of colors as the images of the foreground galaxy, and ought to be entirely representative of the sky in areas free of large nearby foreground galaxies. There are by now many fields observed with the WFPC2 which could satisfy these criteria, including the Medium Deep Survey fields (typically exposures of 5000 s in the F606W and F814W passbands; Griffiths et al. 1994; Ratnatunga, Griffiths, & Ostrander 1998) and the field around the weak radio-galaxy 53W002 (24 orbits in 3 colors; e.g., Pascarelle et al. 1996a,b). However, the Hubble Deep Field (HDF; 150 orbits in 4 colors, Williams et al. 1996) offers the deepest set of images. Its properties are also presently the object of intense scrutiny by many workers, and detailed analyses of the counts, colors, and redshifts of the galaxies visible in it are becoming available (e.g., Cohen et al. 1996; Gwyn & Hartwick 1996; Villumsen, Freudling, & Da Costa 1997; Colley et al. 1996; Madau et al. 1996). The question as to what extent our chosen reference field is “representative” can therefore be answered with considerable certainty. For example, at 26 (appropriate to the present work), the number-counts of the HDF galaxies are known to be complete, and the galaxy number-magnitude relation is similar to that of other fields (Williams et al. 1996). The HDF therefore provides an excellent reference field for our purposes.
2.1 Processing of the HDF data
We used the Version 2 Release WFC images of the HDF (Williams et al. 1996) retrieved from the STScI/HST archive. This release of the HDF was made from dithered exposures using the “drizzling” method (Fruchter & Hook 1997). There are 3 contiguous WFC fields in this data set (and one PC field which we do not use here). Each WFC field was recorded in the 4 photometric bands designated F300W, F450W, F606W, and F814W (cf. the HST Data Handbook); we have not used the images in the UV band F336W.
Several processing steps were carried out on the HDF data set in order to render it compatible with the images of NGC 4536 and NGC 3664. First, the HDF images were all re-binned to their original pixel size of 01 since this is the scale of the (un-dithered) exposures of NGC 4536 and NGC 3664 (and most other exposures of nearby galaxies in the HST archives).
Second, since there is no HDF image in the F555W passband used for the foreground galaxies, we created one by interpolating linearly between the existing F450W and F606W images, taking into account the differing responses of the three filters. This procedure will produce the right result for galaxies that have a linear spectrum between 4520 and 5935 , and an error in the flux at 5400 proportional to the deviation of a galaxy spectrum from linear in this wavelength range. For redshifts lower than = 0.13 (v 40000 km s-1), the 4000 break is blueward of the interpolation range, and the spectra should be fairly linear. However, a significant fraction of the HDF galaxies recovered in the simulations have . Most of the recovered HDF galaxies have an observed (isophotal) brighter than 25 (Figure 3). From the estimates of Villumsen et al. (1997) for magnitude limits, and assuming (Smail et al. 1995), the recovered HDF galaxies should be at redshifts . These galaxies are also mostly brighter than = 26 (Figure 4). The majority of HDF galaxies brighter than = 26 are bluer than 1.5 in () (Williams et al. 1996, their Figure 32). These estimates allow us to model the error in our interpolated F555W image by using stellar population synthesis models (Babul & Ferguson 1996) in order to produce spectra of galaxies with different star formation rates. From the results for the synthetic spectra, galaxies with 1 and () 1.5 could suffer from a systematic shift of -0.03 mag in . The error will be in the sense of very slightly overestimating the reddening of the real galaxies relative to the simulations. However, the dispersion in () is 0.08 mag, of the same order as the dispersion of the mean () color between the 3 HDF WFC fields. We conclude that the error introduced into the interpolated F555W image is negligible.
2.2 Making synthetic fields with the HDF
The HDF images at the full sensitivity of the original observations are added directly to the images of the foreground galaxies in order to create the synthetic fields. The signal-to-noise ratio of the HDF is so high that this simple addition results in an image which retains the noise level of the foreground galaxy image. Before the addition, the HDF can be attenuated and reddened by any amount in order to create a set of synthetic images in which one can search for and measure “real” background galaxies as well as the HDF “control” galaxies.
In order to provide a visual demonstration of how many galaxies in a “representative” field are lost to both crowding and extinction, we have also created a special version of the HDF, simply by adding an appropriate amount of noise to it. We refer to this as the “degraded” HDF. After adding the noise, its signal-to-noise ratio is the same as that of the images of the foreground galaxy, which have a shorter exposure time and a higher sky background. The WF3 frame from the “degraded” HDF image is shown in Figure 1 (left panel). We produced this color image by combining together the frame as blue, the frame as red, and an average of the two as green. The image is displayed in a square root scale which favors the dynamic range of the NGC 4536 color image; this latter image is shown in the right panel of Figure 1. The “degraded” HDF represents the number of galaxies that would be recovered in the total absence of any foreground galaxy, and hence without confusion with globular clusters, HII regions, and stars, but at the same position in the sky and with the same exposure time as the images of NGC 4536.
The differences in the numbers of background gal- axies which can be recognized between the two frames in Figure 1 is largely due to crowding and confusion, as will be seen in §5.1 from the comparison between the “degraded” HDF and the synthetic images without extinction555Synthetic fields produced by adding the HDF with zero attenuation to the NGC 4536 frames.. These data, however, also imply a significant amount of extinction, as we shall subsequently show. The power of the synthetic field method resides in its ability to separate the effects of extinction from those of confusion and crowding; such a large number of galaxies is lost to crowding only, and it has such significant effects on the photometry (§7.5), that it would be impossible to do this project without accounting properly for it.
3 DEEP IMAGES OF NGC 4536
3.1 Observations
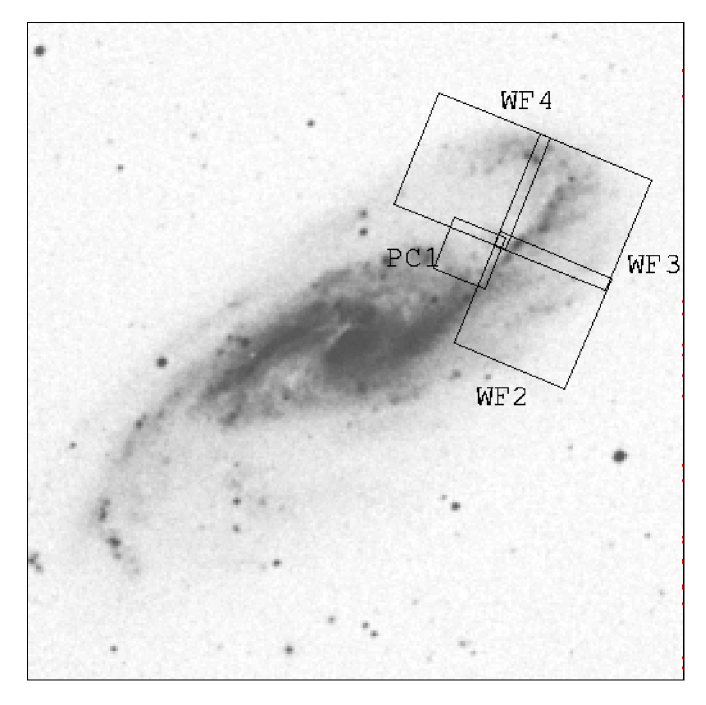
The images of NGC 4536 were originally acquired with the Hubble Space Telescope (HST) Wide-Field Planetary Camera 2 (WFPC2; Holtzman et al. 1995) for the Distance Scale Key Project; they have already been published by Saha et al. (1996), who give a very detailed account of the observations and the pipeline calibration of the data. The WFPC2 field is shown in Figure 5, overlaid on an STScI Digitized Sky Survey image of the galaxy. We do not use the PC frame (WF1) in this work.
NGC 4536 is a bright spiral galaxy Sbc(rs)I-II (de Vaucouleurs et al. 1991), with = 379, in the direction of Virgo, at a distance of 16.2 Mpc (Saha et al. 1996). This yields a spatial resolution of 8 pc per WF pixel. The Galactic extinction towards NGC 4536 is = 0.00 (de Vaucouleurs et al. 1991).
There are 34 individual exposures in the F555W passband, taken at 17 discrete epochs between 1994 June 3 and 1994 August 9; in the F814W passband, 10 images were taken at 5 discrete epochs, over the same two-month period. For each filter, two individual exposures 2000 seconds long were taken back-to-back in each epoch, to allow for cosmic ray (CR) removal by an anti-coincidence technique described in Anderson et al. 1995 and in Saha et al. 1996.
3.2 Further processing
We began working on the images as retrieved from the archive, i.e., bias-subtracted and flat-fielded. The values of “warm” pixels (identified in the calibration pipeline as having a moderately high dark count during the time of observation) were repaired by replacing the measured dark current with the interpolated dark value between two bracketing dark frames (Voit 1997). We then removed the cosmic rays in each image using the “CR-split” procedure (Anderson et al. 1995).
Since we are not looking for time variability, we combined all the data in each passband into a single deep image. Relative shifts between the different epochs were found with a cross-correlation technique. The images at all epochs were nominally taken with the same telescope roll-angle; however, given that distinguishing between point and extended objects is crucial for our project, we also used this technique to check that in fact there were no unintended relative rotations between the frames. Finally, the images were corrected for geometric distortion (Trauger et al. 1995), aligned, and co-added using the “Drizzle” variable-pixel linear reconstruction algorithm (Fruchter & Hook 1997). The resulting images have total exposure times of, respectively, seconds in the F555W passband, and seconds in the F814W passband.
4 BACKGROUND GALAXY
PHOTOMETRY
4.1 Object extraction
We used SExtractor (Bertin & Arnouts 1996) to perform the and photometry on all objects, up to the arcsec-2 isophote in . The parameters for the search and photometry were chosen to optimize the background determination, as judged from the lack of “holes” (oversubtracted regions) in the background-subtracted NGC 4536 images. Likewise, the threshold surface brightness was selected so as not to “find” noise. We performed the search and fixed the threshold in the F814W passband not only because of the actual selection bias in favor of red objects (see below §7.1), but also because our photometry was limited by the shorter exposure time of the frame.
From the list of all objects found by SExtractor, we selected the background galaxies by visual inspection of the images. We used the morphology, the fuzziness and, especially in crowded regions, the color. In crowded regions, we selected preferentially fuzzy objects with . Our search and selection criteria mean that, in principle, from the number-counts we will measure the extinction at .
Figure 6 shows the cumulative histograms of real galaxies found in the background of NGC 4536, in the F814W passband. The left panel of this figure displays the results for the WF2 and WF3 fields combined (the numbers are normalized to the area of one WF field); the right panel shows the results for the WF4 image. We analyzed the WF2 and WF3 images of NGC 4536 together, given that they span most of the northwestern arm of the galaxy. In contrast, the WF4 field covers the northern interarm region and a small area that appears to be beyond the visible disk of the galaxy. We found a total of, respectively, 14 and 16 real background galaxies in the WF2 and WF3 fields, and 35 galaxies in the WF4 field. The difference between the number-counts in this figure and the number-counts of the HDF galaxies (Figure 7) is caused by the combined effects of systematics, crowding and, finally, what we are interested in: extinction.
5 SIMULATIONS AND RESULTS
FOR NGC 4536
Synthetic fields were produced with varying
amounts of (spatially
uniform) attenuation and
reddening (Table 2). The idea is to attenuate the HDF
fields until one recovers the same number of simulated and real
background galaxies. This attenuation,
derived from the number-counts,
should correspond to the average extinction through the disk of NGC
4536 to an uncertainty given by the Poisson and clustering errors.
In practice, what we measure is:
| (1) |
is the normalization, in this case the number of HDF galaxies recovered in the synthetic fields without attenuation, and parametrizes the dependence of the number vs. extinction curve on object selection biases (§5.3).
The reddening suffered by the background galaxies is found by comparing their average color to the average color of the HDF galaxies recovered from the synthetic fields. Because galaxies have a color–magnitude dependence, one must be careful to perform this comparison with simulations that have the same extinction as that measured (from the counts) for the real galaxies or that have the same magnitude limit as the extinction-corrected limit of the real galaxies. The selection biases of the real and synthetic samples of galaxies, and especially the color selection bias (§7.1), should also be the same for the comparison to be meaningful.
To produce the synthetic fields, we: (1) scaled the HDF WFC frames to the exposure times of the NGC 4536 mosaics; (2) attenuated the HDF frames to mimic different amounts of attenuation and reddening; (3) added them in directly to the images of the spiral. To improve the statistics, at each attenuation/reddening we added the three HDF WFC frames, one at a time, to each one of the NGC 4536 WFC frames. What we call one simulation includes the results of repeating the procedure with 3 synthetic fields, one for each HDF WFC frames666In all the figures, the numbers of recovered HDF galaxies are averages of the 3 synthetic fields.. As in the case of the real background galaxies, the photometry on the synthetic frames was done with SExtractor, and the threshold surface brightness was fixed in the image. The identification of control galaxies was done, like that of real background galaxies, by visual inspection of each synthetic frame (as opposed to, for example, through cross-correlation with a list of known HDF galaxies). Systematics and confusion should thereby affect synthetic and real galaxies in the same way.
Since we did not know a priori the extinction law for the disk, we made simulations with both Galactic reddening (Fitzpatrick 1986) and completely grey extinction (i.e., the HDF was attenuated equally in both the F555W and the F814W passbands). We hypothesize that the extinction through galaxy disks will lie somewhere in between these two limiting cases. Another reason to have the two sets of simulations is that they should establish a relative scale that takes into account all possible systematic errors, against which to measure the attenuation and the reddening of the background galaxies. We also constructed synthetic field simulations with a “mixed” extinction law (the HDF frame was more attenuated than the frame, but less than for Galactic reddening), to check that the color scale established by the two limiting cases was roughly linear. We covered a large range in attenuation, from no attenuation at all up to 2.6 mag in both passbands. Since NGC 4536 is inclined at to the line of sight (de Vaucouleurs et al. 1991), we performed these highly-attenuated simulations anticipating the possibility of a face-on optical depth of = 1, both with grey and with Galactic reddening extinction curves. Table 2 shows the input parameters of the simulations, as well as the number and average output color of the HDF galaxies recovered from the NGC 4536 frames; a line indicating the actual NGC 4536 observations is included for comparison.
5.1 Completeness
To assess the effects of crowding alone, we compared the “degraded” HDF frames (§2.2) to the simulation without extinction, i.e., a synthetic field where the HDF was added to the NGC 4536 frames without any attenuation. Figures 8 and 9 compare the average numbers, of HDF galaxies only, recovered from the NGC 4536 frames in the simulation, against the average number per and bin, respectively, of galaxies in the “degraded” HDF. The effect of crowding on the number-counts is, indeed, dramatic.
Given the isophotal brightness limit, while the HDF galaxies in the “degraded” frame are complete to at least = 25, when added to the NGC 4536 they are complete only to = 24 in the WF4 frame and, optimistically, to = 23 in the WF2 and WF3 frames. This is the range where galaxy clustering is most noticeable (§7.4). On the other hand, we were able to detect galaxies up to an integrated (isophotal) magnitude of = 26 in all frames. The histogram shows that we were able to detect many more blue, faint galaxies in the WF4 NGC 4536 field.
The histograms of the recovered synthetic galaxies, however, might suffer from two competing effects: the confusion of faint wings with the foreground disk, and the contamination of the photometric aperture with foreground objects. As described below (§7.2), when using isophotal magnitudes galaxies are measured, on average, 0.1 mag too bright in the F814W bandpass, and up to 0.6 mag in the F555W filter, depending both on the crowding and on the faintness of the object. Fortunately, our investigation does not require absolute or total measurements of the galaxy brightnesses, as long as everything is compared in the same relative scale provided by the simulations.
An absolute measurement of the total magnitude limit is needed only to estimate the expected clustering error. For this purpose, we correct the completeness limit for the faulty background subtraction, and we also assume that total magnitudes are 0.3 brighter than isophotal. After an additional correction for the extinction (§5.3), we set our completeness limits at = 23.7 in the WF4 field, and at = 21.7 in the WF2 and WF3 frames.
5.2 Real vs. control galaxies
Figures 10, 11, and 12 compare the number of real galaxies to the number of HDF “control” galaxies recovered in the simulations without attenuation, per (isophotal) magnitude bin, (isophotal) magnitude bin, and color bin, respectively. The effects of extinction are readily noticeable in the WF2 and WF3 fields, both from the reduction in the number-counts and from the shift to fainter magnitudes of the real galaxies. For the WF4 field, any effects are much less apparent. The reddening, though, is harder to discern from Figure 12, even for the more extincted WF2 and WF3 images.
The relative photometric error for the individual galaxies was estimated by comparing the three measurements we had of each one of the simulated objects in the synthetic fields without attenuation (each HDF frame was added to each NGC 4536 frame). Therefore, it includes the effect of differential crowding, and amounts to 0.16 mag at (isophotal) and 0.26 mag at (isophotal). However, the error in () for each galaxy is only 0.10 mag, given that the color has been measured using a small, fixed aperture of 05 diameter, precisely to minimize the impact of crowding (see §7.2).
5.3 The extinction measurement
Figure 13 shows the comparison between the number of real galaxies (horizontal lines) and the average number of “control” galaxies recovered in the simulations at each given attenuation. The top panel displays the results for the WF2 and WF3 fields; the bottom panel, those for the WF4 image. The solid triangles are for simulations with Galactic reddening; the open triangles, for synthetic fields with grey extinction. The different shapes of the curves for both types of extinction illustrate the dependence of the number-counts on the colors of the galaxies. The actual measurement of the extinction was performed by linearly interpolating between the simulations bracketing the real galaxies. The error bars include Poisson and clustering errors (§7.4).
We find for the arm region of NGC 4536 (WF2 and WF3 fields) an absorption of mag in the case of grey extinction, and mag in the case of a Galactic reddening law. Without the contribution for clustering, the purely Poisson error is mag. For the interarm and outside area (WF4), the results are, respectively, mag ( mag without clustering error) for grey extinction, and 0.52 mag ( mag without clustering error) for Galactic reddening. The error of 0.37 (0.21) mag is already included; the figure shows that the difference between the attenuation inferred from the two models increases with extinction. The difference is in the sense that we expect; it is due to our color selection bias, which favors the detection of faint galaxies (statistically blue) when they are reddened (§7.1). The difference, however, is smaller than the errors.
5.4 The reddening measurement
For the background galaxies, we measure a mean color of in the arm, and of in the interarm and “outside” region. Figure 14 shows the comparison of the color of the background galaxies to those of the simulations. We remind the reader that this is the appropriate comparison, rather than a confrontation between the two samples (i.e., WF2+WF3 and WF4), given their different magnitude limits and all the systematics that come into play in the presence of severe crowding. We also point out that the purpose of this figure is to compare the color of the background galaxies to the synthetic fields closest in extinction and object selection biases; the locus of the real galaxies in the plot does not necessarily imply an extinction law for the obscuring material in the foreground disk, unless we can safely assume that the whole region is sampled by galaxies whose colors we can measure (§8.3 and Appendix). The left panel shows the results for the WF2 and WF3 fields; the right panel, those for WF4. The simulations with Galactic reddening (open triangles) do not follow exactly the theoretical extinction law (solid line) for large absorptions, neither do the simulations with grey extinction (filled triangles) follow a constant line in color. The departure of the grey simulations from the zero-reddening line is due to our selection for red galaxies §7.1, and to the color–magnitude relation of galaxies. As we go to larger extinctions, given our detection magnitude limit we are left with statistically brighter galaxies, which are also intrinsically redder. The deviation of the reddened simulations from the theoretical Galactic reddening line is due to the systematic error in the background subtraction in crowded areas described in §7.2. In the case of WF4, even if it is less crowded, we still see the effect because our magnitude limit is fainter, and faint galaxies are proportionally more affected by the problem. This is also the cause of the relative shift between the scales of the two panels. The WF2 and WF3 images of NGC 4536 are more crowded than the WF4 field; statistically, all galaxies in the former fields have been measured relatively bluer, producing the downward shift of the whole color vs. extinction plot. All these systematic effects will affect the real galaxies in the same way and should not bias the estimate of the reddening, as long as the scale defined by the simulations with the two limiting extinction laws is linear. To check that this is the case we have performed simulations with a “mixed” extinction law777That is, the light of each individual galaxy is more attenuated than the light, but less than in the Galactic reddening case; this type of extinction can be caused by an unresolved clumpy dust distribution (Witt & Gordon 1996). The output of the “mixed” simulations is shown in Figure 15. When compared with their input line, the simulations with a “mixed” reddening law seem more affected by the selection bias that pushes the grey simulations redward than by the background subtraction that pushes the Galactic reddening simulations blueward. The simulations, however, follow the input line within the errors, which shows that the color scale is, indeed, roughly linear.
The background galaxies behind the northwestern arm of NGC 4536 (WF2 and WF3 fields, Figure 14, left) fall in between the lines for the completely grey extinction and the Galactic reddening law in the the color vs. extinction plot. Since, unfortunately, the color line of the grey simulations shows a kink precisely at the location of the real background galaxies, to find the reddening we will rather use the color obtained by interpolating between the grey simulations with = 0.58 mag and = 1.51 mag, at the extinctions (inferred from the grey and Galactic reddening models, respectively) of the background galaxies. The interpolation yields () at = 0.74 mag, and () at = 1.07 mag. Therefore, the background galaxies suffer a reddening of mag (grey extinction model) or mag (Galactic reddening law). The error in the reddening, already included, is 0.18 mag.
The background galaxies in the interarm region (WF4, Figure 14, right), however, seem to follow the Galactic reddening line. Comparing their color to the mean color of the simulation without extinction, they exhibit a reddening of mag, regardless of the attenuation model used.
6 NGC 3664
6.1 Observations and Data Reduction.
NGC 3664 was observed with the WFPC2 in 1996 March 3. The total exposure times are 600 seconds in the F555W passband, 800 seconds in the F814W passband, and 1600 seconds in the F439W passband. NGC 3664 is a Magellanic peculiar (SBm(s)IV-V, de Vaucouleurs et al. 1991). From the recession velocities () cited in this reference for NGC 3664 and NGC 4536, and using the distance to NGC 4536 above (§3.1), NGC 3664 is at a distance of 11.9 Mpc. The data will then have a spatial resolution of 6 pc per WF pixel. We assume the foreground Galactic absorption is = 0.12 mag (de Vaucouleurs et al. 1991).
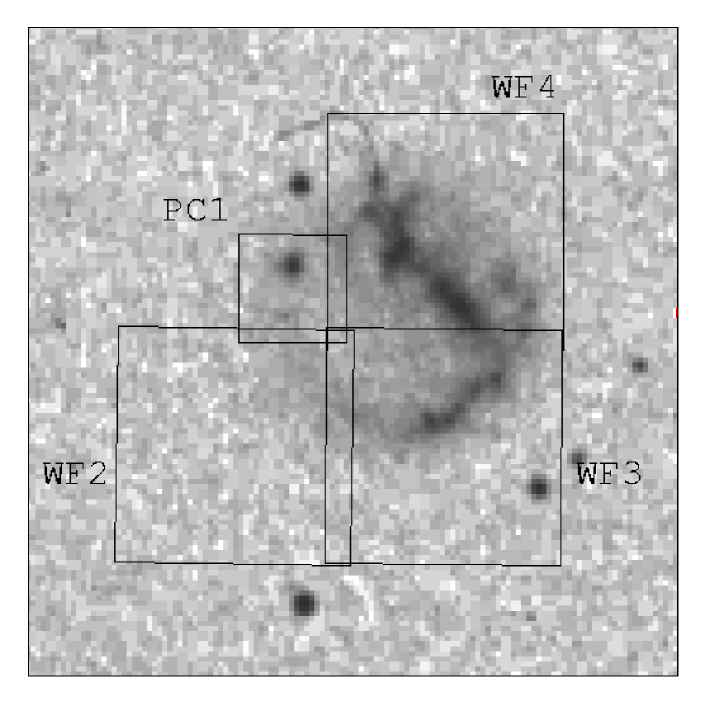
Figure 16 shows the WFPC2 field, overlaid on an STScI Digitized Sky Survey image of the galaxy. Once again, we do not use the PC (WF1) frame. NGC 3664 covers only 45% of the three WFC chips; this decreases the number of galaxies expected to be seen through the disk, but provides a fairly large surrounding field for additional comparison. From its morphology, NGC 3664 is believed to be seen face-on.
Partly because of the shallowness of the data, partly because the work on NGC 3664 started out in a relatively independent way, and also owing to a desire to explore diverse lines of attack, the analysis of the NGC 3664 data differs in the details from that of NGC 4536. The main differences are: (1) the subtraction of the available (and properly scaled) image from the image to facilitate the search for relatively red objects (§6.2); (2) the use of the Rieke & Lebofsky (1985) Galactic reddening curve; (3) the semi-automatic identification of background galaxies, both real and simulated (§6.3). To improve the statistics, we did more simulations at smaller extinction intervals (Table 3). We did not try to fix the warm pixels in the raw images, and cosmic rays were iteratively removed based on the deviation of individual pixel values from the mean. Finally, we adjusted the parameters of SExtractor to minimize the scatter of the difference between the measured brightnesses of the HDF galaxies before and after adding them to the NGC 3664 fields. For the same reason, in what follows we use the “automatic” aperture magnitudes calculated by SExtractor, rather than the isophotal magnitudes888“Automatic” apertures are a constant, in this case 2.5, times the size of the Kron “radius”, i.e., an elliptical aperture that contains the same fraction of the total light for all objects, regardless of their brightness profile..
6.2 Finding background galaxies
To remove most of the bright, blue star-forming regions in the disk of NGC 3664, we subtracted a properly-scaled F439W image from the F814W image. The scaling was done arbitrarily, to remove this blue component without creating substantial “holes” in the residual image. This method is reasonable, because we cannot or can only barely see the background galaxies in the F439W passband. The disadvantage of this procedure is that it increases the noise. However, since background galaxies are identified primarily through their relatively red appearance, the disadvantage is far outweighed by removing the bright, relatively blue, foreground in the first step. The search for galaxies with SExtractor was performed in this artificial, blue-subtracted image. The photometry of the identified galaxies, however, was done in the original F555W and F814W frames.
6.3 The synthetic field simulations
Table 3 shows the input parameters of the simulations, and the number and average output color of the HDF galaxies recovered behind and surrounding NGC 3664; a line indicating the actual NGC 3664 observations is included for comparison. As opposed to what we did in the case of NGC 4536, the selection of galaxies out of the object catalogs produced by SExtractor was done in a semi-automatic fashion. For example, we only selected objects redder than () = 0.17 mag (in the catalog, i.e., several tenths of mag redder in actuality in crowded regions, see §7.2). Other selection criteria were a (SExtractor) star-galaxy separation parameter “class_star” 0.8 (the values go from 0.0 for an unmistakable galaxy to 1.0 for a perfect star); a FWHM of a Gaussian fit to the object profile 02; and an error in the “automatic” aperture magnitude 0.17 mag. In bright foreground star forming regions, the search and measurement of background galaxies is virtually impossible. Therefore, we excluded from the search regions of NGC 3664 with a surface brightness higher than 21 mag arcsec-2 (WF3) and 20.7 mag arcsec-2 (WF4), respectively999These limits were set empirically, with the aid of the simulations, so as to retrieve the maximum number of HDF galaxies and the minimum amount of misidentifications. We still had to exclude by hand saturated stars that were included in the automatic selection of galaxies.
6.4 Real vs. control galaxies
Because of the difficulties in identifying galaxies reliably, we decided to exclude from the sample behind the disk of NGC 3664 all candidates fainter than = 22.8. This reduced our sample of real galaxies found behind the projected disk of NGC 3664 to 8 objects. To the same limiting magnitude of = 22.8, in the simulation without extinction we recovered an average of 17 HDF galaxies within the disk. The discrepancy must be caused by extinction. For the areas outside the visible disk of the galaxy, we kept galaxies up to an integrated magnitude of = 24. We found a total of 38 background galaxies in the surrounding field, vs. an average of 37 control galaxies.
6.5 Extinction in NGC 3664
We find for the disk of NGC 3664 (Figure 17, top) an absorption of mag in the case of grey absorption, and mag in the case of a Galactic reddening law. The purely Poisson error is mag. For the surrounding area (Figure 17, bottom) the results are, respectively, 0.31 mag ( 0.17 mag without clustering error) for grey extinction and 0.30 mag ( 0.16 mag without clustering error) for Galactic reddening law. (The results have been corrected for foreground extinction in the Milky Way.) Table 1 lists the relevant parameters for the calculation of the error in the extinction.
6.6 Reddening in NGC 3664
For the background galaxies, we measure a mean color of () behind the disk of NGC 3664, and of () in the surrounding field. Figure 18 shows how we compare the color and extinction of the background galaxies to the simulations. The left panel exhibits the results for the field covered by the disk of NGC 3664.
As in the case of NGC 4536, the background galaxies behind the disk of NGC 3664 lie in between the lines for the grey and Galactic reddening simulations. To find the reddening, we compare the mean color of the background galaxies to the mean color of the grey simulation with the closest amount of extinction, i.e., the one with = = 0.95 mag. The output mean color of this simulation is (). Therefore, the background galaxies suffer a reddening of mag.
The right panel of Figure 18 shows the results for the galaxies recovered outside the visible disk of NGC 3664. The dashed line follows the color of the grey simulations after correcting for incompleteness: a shift was added to the average color of the recovered galaxies as a function of increasing extinction, so that it would follow the same behavior as the average color of the (un-added) HDF galaxies with a progressively brighter magnitude limit. Although we prefer to use the color without correction, because otherwise the small numbers make the error in the color very large, the line does indicate that we are seeing an incompleteness effect. Conversely, in the case of the simulations with Galactic reddening, the line after correction (not plotted) basically follows the output mean color of the recovered galaxies. This confirms that, given our color selection bias, we can still find relatively faint galaxies, even in the presence of extinction, as long as they are reddened. The result for the background galaxies outside the visible disk of NGC 3664 is that their number and color are consistent with no attenuation.
7 SYSTEMATIC ERRORS AND BIASES
7.1 Color selection and the color–magnitude relation
Because spiral disks are relatively blue, red background galaxies are more readily detected behind a foreground disk. As mentioned above, in crowded regions of NGC 4536 we selected in practice for red galaxies [i.e., with ], to be able to distinguish them from the stellar content and HII regions (which are predominantly bluer) in the foreground galaxy. This bias will be even more noticeable in grey simulations, where (given a certain attenuation at F555W) the F814W passband will be more attenuated than in the corresponding simulation with Galactic reddening. As a result, more faint blue galaxies will be discarded in the grey simulation than in the reddened one, the mean color measured for the outcome of the grey simulation will be redder than otherwise, and the measured color shift between it and a reddened simulation will be smaller (bluer) than the input. The color–magnitude relation of galaxies (intrinsically brighter galaxies tend to be redder) will have an effect in the same direction: at higher extinctions, the statistically brighter galaxies will be detected, and the average color of the sample will be redder.
7.2 Systematic error in the color
measurement
due to the background
As it searches for and measures objects, SExtractor determines the background with a sigma-clipping algorithm, plus a modified mode in crowded areas. In very crowded fields, however, this results in an underestimation of the actual background when using large apertures (larger than 06 in radius for the two galaxies investigated here). The background determination algorithm has the purpose, precisely, of removing bright spots (stars, clusters or HII regions) from the measurement of the background, so that faint, extended objects can be identified. On the other hand, the larger the photometric aperture, the higher the probability that these same bright spots in the foreground galaxy disk will lie within the aperture, and will be included in the measurement of the flux of the object of interest, in this case, the background galaxy.
The difference between the true and the measured background is equal to the difference between the average of the background and its mode. The result of the wrong background determination is equivalent to adding this difference to the galaxy luminosity measurement. We find that, on average, galaxies are measured 0.1 mag brighter in the F814W bandpass simulations when using isophotal magnitudes. In the F555W passband, the shifts depend on the crowding. For NGC 4536, they go from in the WF4 frame to 0.6 mag for many galaxies fainter than in the WF2 frame, the most crowded of the three WFC frames. In short, fainter galaxies will be measured up to 0.5 mag too blue, if using isophotal apertures.
As with the other errors discussed above, this is a systematic error that will affect both the simulations and the real galaxies, and therefore will not affect their mean relative reddening. However, for individual galaxies, the fainter the galaxy the larger the error will be (in magnitudes). Hence, this effect will increase the error in the estimate of the mean background galaxy color. We have reduced this problem by determining the galaxy colors from a fixed aperture of 05 (5 pixel) diameter. The use of this aperture size decreased the shift between the input and the measured color in the simulations by a tenth of a magnitude, and the dispersion in the shift by up to a tenth of a magnitude as well. The error introduced by not measuring possible color gradients over larger background galaxy radii should be much smaller than this error, especially when the measurement of a color gradient depends so critically on an accurate estimation of the background. Much more importantly, by choosing an aperture to perform the color measurement, we are choosing the scale over which we are averaging the effects of the obscuring material (§8.3). At the distance of NGC 4536, 05 is pc; for NGC 3664, the linear size of the aperture is pc.
7.3 Systematic errors and the
derived
extinction law
The systematic errors discussed above in §7.1 and §7.2 will affect the simulations and the real galaxies alike, and hence will not have an effect on the reddening determination. The only error that could have an impact on the determination of the reddening is the interpolation error in the HDF images (§2.1). However, the mean expected shift of -0.03 mag between the interpolated and the real of the HDF galaxies is smaller than (1) the dispersion of the shift; (2) the error in the mean colors of the real galaxies and of the sets of output simulated galaxies (§7.5); and (3) the dispersion in the measurements of individual galaxy colors(§5.2). We conclude that the error introduced by the interpolation will have a negligible effect over both the background galaxy detection and the reddening determination.
7.4 The clustering error
To estimate the contribution from galaxy clustering to the error in the number-counts, we take the two-point correlation function from Roche et al. (1993) or from Brainerd et al. (1995), depending on the completeness magnitude limit of the data. We assume (Smail et al. 1995), since these references list for limits in the -band. Table 1 shows, for each disk (NGC 4536 and NGC 3664) and field, the angular size of the field, the assumed (apparent) magnitude completeness limit, , the number of background galaxies, the derived (reddened and grey) extinction, the total error in the extinction, the error contributed by the Poisson error in the number-counts, and the error owing to clustering errors.
To estimate how the simulations contribute to the clustering error, rather than presenting data for each of the two simulations used in the calculation of the extinction (the simulations with numbers of recovered galaxies immediately above and below the number of real galaxies), we list data for only one fiducial simulation with the same number (per WFC field) of recovered HDF galaxies as the real background galaxies. Even though the 3 HDF WFC fields have been added one at a time to each of the WFC fields of the investigated galaxies, in reality they are of course contiguous, and have to be treated as one single field for the calculation of the clustering error. The errors contributed by the simulations to the final estimation of the extinction will be the numbers given for the fiducial simulation. Except for NGC 4536, WF4, all the other values of (and therefore of the clustering errors) are slightly overestimated, both because we take the correlation function for a square with an area equal to the area under consideration (not a square), and because Roche et al. (1993) include galaxies with in their calculation of the correlation function; these galaxies add very significantly to , but there are none in our sample of background objects (we detect no more than a couple in the simulations without extinction). Conversely, in the case of the NGC 4536 WF2 and WF3 fields (analyzed in a combined fashion), there is a correlated error in the simulations that we have not included, and that is due to the fact that we count the same HDF fields twice.
7.5 Photometric error
If the color distribution of galaxies was Gaussian and we were sampling it in a systematic way, we could confidently equate the error in the mean color to its measured dispersion divided by , where is the number of galaxies used for the color measurement. However, neither of these assumptions is true. The color distribution of galaxies depends on their limiting magnitude and has an intrinsic dispersion that is not Gaussian. Moreover, in our case we have to infer their mean color from the few galaxies that we can find in the presence of crowding. Crowding will have three adverse effects on the color measurement. The color-magnitude distribution of galaxies resembles an inverted triangle (cf. for example Williams et al. [1996]). (1) Crowding will push the completeness limit up to brighter magnitudes, where the intrinsic color dispersion of galaxies is largest. (2) It will reduce the number of galaxies available for the analysis in a dramatic way (Figure 8). (3) Crowding will deplete galaxies in an inhomogeneous fashion: in combination with clustering, it will determine the random sample of background galaxies from which we will try to infer the mean color of all background galaxies.
To check our estimate of the error in the color measurement, we have looked at the dispersion in the mean color of 100 random samples of galaxies (where is equal to the number of background galaxies) taken from the HDF galaxies, to our magnitude limit. We have repeated the procedure with the simulations, and we have found that the predicted error is of the same order as the error found by assuming a Gaussian distribution. Most of the time, the error from bootstrap statistics (Babu & Feigelson 1996) is slightly smaller than the Gaussian error, probably because the latter is calculated from the real sample and therefore includes the effect of clustering and other systematics. In the case of NGC 4536, we adopt the larger of the two error estimates for each simulation, as well as for the real galaxies. In the case of NGC 3664, we use the Gaussian uncertainty.
8 SUMMARY AND DISCUSSION
8.1 NGC 4536
Summarizing the results (errors in parenthesis are Poisson only, no clustering): the northwestern arm of NGC 4536 shows an attenuation of ( 0.26) mag (grey extinction) or ( 0.26) mag (Galactic reddening law), and a reddening of mag (grey extinction) or mag (Galactic reddening law). The error of 0.18 mag is already included in the color uncertainty. For the northern interarm and outside regions, the results are, respectively, 0.46 ( 0.33) mag (grey extinction) or 0.52 ( 0.39) (Galactic reddening), and mag. The extinction values for the interarm region already include a 1 error of 0.37 (0.21) mag. The Poisson errors in parenthesis would be adequate for the extinction if the galaxy density was the same behind NGC 4536 as it is in the HDF.
8.2 NGC 3664
To summarize the results: the disk of NGC 3664 shows an attenuation of ( 0.49) mag (Galactic reddening law) or ( 0.49) mag (grey extinction), and a reddening of mag. The Poisson errors in parenthesis would be adequate for the extinction if the galaxy density was the same behind NGC 3664 as it is in the HDF. As it turns out, in the surrounding field of NGC 3664, this is precisely the case.
8.3 Conclusions and discussion
We have used background galaxy counts and colors, for the first time, to measure the extinction and reddening through two very different galaxy disks. The images also have very different available exposure times, which allowed us to test the limits of the method.
Our principal conclusions are listed below.
(1) In the case of spiral disks, the background galaxy approach is mostly limited by crowding and confusion in the foreground disk, even more than by the background galaxy clustering. We have developed and calibrated the “synthetic field” method to decouple the effects of crowding from those of extinction. The method comprises the production of artificial frames by adding suitable and properly scaled reference fields, in this case the HDF, directly into the spiral galaxy images. The reference frames are attenuated to mimic different amounts of extinction and reddening; the idea is to attenuate the control field until one recovers the same number of simulated galaxies as there are real background galaxies. To ensure that systematics and confusion affect synthetic and real galaxies in the same way, both real and control galaxies are identified in the same fashion (i.e., the known positions of HDF galaxies are never used). The attenuation derived from the number-counts should correspond to the average extinction through the disk of the galaxy. Finally, a comparison between the average colors of, respectively, the control HDF galaxies and the real background galaxies will allow an estimate of the degree of reddening.
(2) We tried slightly different lines of attack with both galaxies, but found them to be fairly equivalent. When a image is available, like for NGC 3664, its subtraction from the image does seem to facilitate the search for galaxies, at least in frames with short exposure times. It would also be desireable to automate as much as possible the final identification of real and synthetic galaxies. Unfortunately, a fully automatic identification might be hard to achieve in frames as crowded as the ones we are studying.
(3) There is a significant amount of dust in NGC 3664, even though it is a Magellanic irregular.
(4) There is more extinction in the northwestern arm of NGC 4536 than in the northern interarm region of the galaxy. The reddenings, however, are comparable. We have mentioned before that we derive both parameters independently: the extinction from the galaxy number-counts, and the reddening from the background galaxy photometry. The method we use to measure the extinction will take into account galaxies that are so attenuated that we cannot see them, while we measure the reddening from galaxies that are attenuated only to a point where we can still observe them. Also, although we average the color excess over a number of background galaxies, the color of each one of these galaxies is measured in an aperture with a linear size of 40 pc at the distance of NGC 4536. It is possible that at this scale the dust distribution is genuinely smooth (Keel & White 1997).
In view of all the above, in principle we prefer to present the results obtained from the number-counts and from the colors independently, and not in the form of a reddening law. The number-counts measure the total average extinction through a whole region; the colors measure the extinction owing to a diffuse component.
On the other hand, if we assume that nowhere in the region of interest the extinction is so high that we cannot sample it with background galaxies, it is possible to determine an extinction law from the two values (Appendix). This seems to be a safe assumption for the northern interarm region of NGC 4536, and there both the extinction and the reddening are consistent with a Galactic reddening law. The similar reddening but significantly higher extinction in the northwestern arm can be explained by the combination of a diffuse obscuring component with regions of higher opacity. If, in spite of the caveats, we use the extinction and the reddening measured in the northwestern arm to derive a reddening law, then the extinction there is greyer than Galactic and can be caused by unresolved clumps (Witt & Gordon 1996), in this case at the scale of 40 pc.
(5) For the interarm region of NGC 4536, the extinction can be deprojected to a face-on 0.22 mag. For the northerm arm of NGC 4536, however, given the patchy dust distribution, it is not possible to derive a number for the face-on extinction in a model-independent way. We can, however, assume that the reddening of the background galaxies behind the arm is caused by a smooth component and follows a Galactic extinction law. In that case, the reddening implies a face-on extinction through the diffuse component in the arm of 0.16 mag.
(6) The usefulness of the background galaxy counts and colors
to measure foreground extinction has been recently confirmed by
their application to the field of the gamma-ray burster
GRB970228 (Fruchter et al. 1998).
In that analysis, we used four different reference frames
to measure the extinction in the F606W passband:
the HDF; the weak radio galaxy 53W002 field;
and two fields located, respectively,
at J(2000) 15:58:49.8, 42:05:23, and at
J(2000) 14:17:43.63, 52:28:41.2
(Westphal, Kristian, & Groth 1994).
Since the GRB970228 field is not crowded, it was not necessary
to produce “synthetic fields”. Under those circumstances,
and assuming a Galactic reddening law, both counts and colors yield the same result
(respectively, 0.420.23 mag, and 0.540.04 mag).
The average of these two measurements
of the Galactic extinction towards the gamma-ray
burster
(0.480.12 mag) is consistent with the value of 0.72
0.24 mag obtained by
Burstein & Heiles (1982), and
with the extinction of 0.690.11 measured from
maps of dust IR emission (Schlegel, Finkbeiner,
& Davis 1997). The marginal systematic difference
in the measurements can be explained by our better
spatial resolution (roughly 1′, vs.
61 of Schlegel et al. and 06 of
Burstein & Heiles), since the burster is located at a
position ( = 188.913∘, )
where the Milky Way exhibits a steep gradient in extinction
(cf. Burstein & Heiles 1982).
(7) From the Cepheids detected in the same NGC 4536 data, Saha et al. (1994) derive a mean extinction of 0.070.05 mag in Kron-Cousins 101010From Figure 12 of Holtzman et al. (1995), the extinction in Kron-Cousins is directly comparable with the extinction in .. Likewise, they estimate the differential extinction between the arm and the interarm regions to be 0.050.10 mag. These numbers imply for the arm of NGC 4536 an extinction 0.2 mag, much lower than what we find from the galaxy number-counts. More importantly, the detected Cepheids span a range of at least 2 magnitudes in brightness; Saha and co-workers had the capability to measure an extinction much higher than 0.2 mag. The fact that they did not implies that the Cepheids detected in the arm lie preferentially either in areas of low extinction or on top of the obscuring material. Together with the extinction derived from the galaxy number-counts, the Cepheid reddening is consistent with the existence of regions of significant opacity in the arm of NGC 4536. On the other hand, the extinction measured from the Cepheids agrees with the one we find for the interarm region and, from the galaxy colors, for the diffuse component in the arm (0.52 and 0.42 mag, respectively, for a Galactic reddening model). Lastly, since the Cepheids are embedded in the disk, statistically they should suffer only about half of the total extinction, which background illuminating objects can probe; our measurements and those by Saha and collaborators are consistent with this picture.
(8) That in the case of spiral galaxy disks we are totally dominated by crowding is demonstrated by the fact that there is less than 30 percent improvement in the extinction errors for NGC 4536, relative to NGC 3664, even though we have 5 times better signal-to-noise ratio in and more than 10 times better signal-to-noise ratio in . Likewise, the color errors are only 20 percent better for NGC 4536. Perhaps even more telling, the accuracy of both the extinction and the color measurements is the same in the less obscured regions of the galaxies, despite the enormous difference in exposure times.
We can both reduce the contribution to the relative errors from the control fields, and perhaps even measure the clustering error directly, by using an increasing number of them. And since the dominating source of error is crowding, it certainly will not matter if we use reference fields with shorter exposure times than the HDF to produce the “synthetic fields”. However, even if we manage to determine very accurately the mean and the dispersion of the number of galaxies in a typical WFPC2 reference field, we will still be left with the larger source of error: the studied galaxies themselves, with their “single realization” background fields. If NGC 4536 and NGC 3664 are representative, the extinction errors will go from 0.3 mag in galaxies with exposures of several 104 seconds, to 0.5 mag in galaxies with shallow exposures of a few 103 seconds; the error in the color will amount to 0.1 mag in all cases. In the future we will try to reduce this source of error by combining together the results from background galaxies behind spirals of similar Hubble type, inclination, and distance to the Milky Way.
Acknowledgements.
R.A. González is grateful to Jay Anderson for his cosmic-ray removal program, to Abi Saha for his advice on how to deal with the images of NGC 4536, and to Stefano Casertano and Andy Fruchter for useful discussions on galaxy clustering and bootstrap statistics. Larry Petro kindly confirmed that the images of NGC 4536 were not affected by scattered light. We want to thank M. Dahlem and S. M. Baggett for providing the image of NGC 3664. B. Dirsch is especially grateful to S. M. Baggett for her help in the reduction of the WFPC2 images of NGC 3664. We thank the referee, W.E. Keel, whose comments helped us improve the presentation of the manuscript. Support for this work was provided partly by NASA through grant AR-06400.01-95A and partly by the Director’s Discretionary Research Fund at the Space Telescope Science Institute.APPENDIX
METHOD-DEPENDENT GREYNESS?
The reddening and the attenuation are derived independently with our approach. In what follows, we discuss the limitations of the method for the derivation of a meaningful extinction law.
Let us consider the case where each of the background galaxies used to derive the “average” extinction through the disk suffers from a different amount of Galactic reddening. Our method will derive a reddening law that can be described by the following equation:
| (2) |
where denotes the extinction derived from the number-counts and is the average reddening of the recovered galaxies. can also be written as:
| (3) |
where the summation encompasses all the background galaxies.
The extinction, on the other hand, can be expressed as (§5):
| (4) |
where describes selection biases and is the normalization.
If is the probability (0 or 1) of finding a galaxy with magnitude and suffering an attenuation , we can rewrite the above equation as:
| (5) |
To obtain the attenuation in a fractional area , with attenuation , of the original image, the equation becomes:
| (6) |
Splitting the summation in equation (4) into two summations, one running over the areas with a given attenuation , the other running over all galaxies in each of these areas, equation (4) becomes:
| (7) |
Using the value of from equation (5), and assuming that , we finally obtain:
| (8) |
The “reddening law” would read:
| (9) |
Equation (7) shows that the extinction obtained from the number-counts is a linear average over the whole area considered111111That is, the whole area that is sampled by the reference galaxies, so crowding will not affect the extinction measurement, and as such takes into account real background galaxies that we cannot see, while the color excess involves the average of the absorption in magnitudes, and only over background galaxies that we actually see. Strictly, the measured and the intrinsic will be equal only if is the same for all galaxies. But, mainly, it is possible to measure a much higher extinction from the number-counts than the extinction implied by the reddening.
References
- [] Allen, R. J., Knapen, J. H., Bohlin, R., & Stecher, T. P. 1997, ApJ, 487, 171
- [] Anderson, J., King, I. R., & Sosin, C. 1995, in “Calibrating Hubble Space Telescope Post Servicing Mission”, eds. A. Koratkar & C. Leitherer (Baltimore:STScI), p. 300
- [] Babu, G. J., & Feigelson, E. D. 1996, “Astrostatistics” (London:Chapman & Hall)
- [] Babul, A., & Ferguson, H. C. 1996, ApJ, 458, 100
- [] Berlind, A. A., Quillen, A. C., Pogge, R. W., & Sellgren, K. 1997, AJ, 114, 107
- [] Bertin, E., & Arnouts, S. 1996, A&A, 117, 393
- [] Block, D. L., Witt, A. N., Grosbøl, P., Stockton, A., & Moneti, A. 1994, A&A, 288, 383
- [] Brainerd, T. G., Smail, I. R., & Mould, J. R. 1995, MNRAS, 275, 781
- [] Burstein, D., & Heiles, C. 1982, AJ, 87, 1165
- [] Cohen, J. G., Cowie, L. L., Hogg, D. W., Songaila, A., Blandford, R., Hu, E. M., & Shopbell, P. 1996, ApJ, 471, L5
- [] Colley, W. N., Rhoads, J. E., Ostriker, J. P., & Spergel, D. N. 1996, ApJ, 473, L63
- [] Davies, J., & Burstein, D., eds. 1995, “The Opacity of Spiral Disks” (Dordrecht; Boston, Mass.:Kluwer)
- [] de Vaucouleurs, G., de Vaucouleurs, A., Corwin, Jr., H. G., Buta, R. J., Paturel, G., & Fouqué, P. 1991, “Third Reference Catalogue of Bright Galaxies” (New York:Springer)
- [] Disney, M., Davies, J., & Phillips, S. 1989, MNRAS, 239, 939
- [] Fitzpatrick, E. L. 1986, AJ, 92, 1068
- [] Fruchter, A. S., & Hook, R. N. 1997, in “Applications of Digital Image Processing XX”, ed. A. G. Tescher (Bellingham, Wash.:SPIE), p. 120
- [] Fruchter, A. S., et al. 1998, in preparation
- [] Giovanelli, R., Haynes, M. P., Salzer, J., Wegner, G., Da Costa, L., & Freudling, W. 1995, AJ, 11, 1059
- [] Griffiths et al. 1994, ApJ, 435, L19
- [] Gwyn, S. D. J., & Hartwick, F. D. A. 1996, ApJ, 468, L77
- [] Holtzman, J. A., et al. 1995, PASP, 107, 156
- [] Keel, W. E., & White, R. E., III 1997, BAAS, 191, #75.01
- [] Kylafis, N. D., & Bahcall, J. N. 1987, ApJ, 317, 637
- [] Madau, P., Ferguson, H. C., Dickinson, M. E., Giavalisco, M., Steidel, C. C., & Fruchter, A 1996, MNRAS, 283, 1388
- [] Pascarelle, S. M., Windhorst, R. A., Driver, S. P., Ostrander, E. J., & Keel, W. C. 1996a, ApJ, 456, L21
- [] Pascarelle, S. M., Windhorst, R. A., Keel, W. C., & Odewahn, S. C. 1996b, Nature, 383, 45
- [] Peletier, R. F., Valentijn, E. A., Moorwood, A. F. M., & Freudling, W. 1994, A&AS, 108, 621
- [] Ratnatunga, K. U., Griffiths, R. E., & Ostrander, E. J. 1998, in preparation
- [] Rieke, G. H., and M. J. Lebofsky 1985, ApJ, 288, 618
- [] Roche, N., Shanks, T., Metcalfe, N., & Fong, R. 1993, MNRAS, 263, 360
- [] Saha, A., Sandage, A., Labhardt, L., Tammann, G. A., Macchetto, F. D., & Panagia, N. 1997, ApJ, 466, 55
- [] Schlegel, D. J., Finkbeiner, D. P., & Davis, M. 1997, astro-ph/9710327
- [] Smail, I., Hogg, D. W., Yan, L., & Cohen, J. G. 1995, ApJ, 449, L105
- [] Trauger, J. T., Vaughan, A. H., Evans, R. W., & Moody, D. C. 1995, in “Calibrating Hubble Space Telescope Post Servicing Mission”, eds. A.Koratkar & C. Leitherer (Baltimore:STScI), p. 379
- [] Tyson, J. A. 1988 AJ 96 1
- [] Valentijn, E. 1990, Nature, 346, 153
- [] Voit, M. (ed.) 1997, “HST Data Handbook”, Version 3.0 (Baltimore:STScI), p. 26-16
- [] Villumsen, J. V, Freudling, W., & Da Costa, L. N. 1997, ApJ, 481, 578
- [] Westphal, J. A., Kristian, J., & Groth, E. J. 1994, HST proposal no. 5109
- [] White, R. E., III, & Keel, W. E. 1992, Nature, 359, 129
- [] White, R. E., III, Keel, W. E., & Conselice, C. J. 1996, astro-ph/9608113
- [] Williams, R. E., et al. 1996, AJ, 112, 1335
- [] Witt, A. N., & Gordon, K. D. 1996, ApJ, 463, 681
- [] Witt, A. N., Thronson, H. A., & Capuano, J. M. 1992, ApJ, 393, 611
- [] Zaritski, D. 1994, AJ, 108, 1619
![[Uncaptioned image]](/html/astro-ph/9806001/assets/x1.png)
![[Uncaptioned image]](/html/astro-ph/9806001/assets/x2.png)
![[Uncaptioned image]](/html/astro-ph/9806001/assets/x3.png)
![[Uncaptioned image]](/html/astro-ph/9806001/assets/x4.png)