Globular Cluster Photometry with the Hubble Space Telescope.
VII. Color Gradients and Blue Stragglers in the Central Region
of M30 (NGC 7099) from WFPC2 Observations111Based on observations with
the NASA/ESA Hubble Space Telescope, obtained at the Space Telescope Science
Institute, which is operated by the Association of Universities for Research
in Astronomy, Inc., under NASA contract NAS5-26555.
Abstract
We present F555W (), F439W (), and F336W () photometry of 9507 stars in the central of the dense, post core collapse cluster M30 (NGC 7099) derived from Hubble Space Telescope Wide Field/Planetary Camera 2 images. These data are used to study the mix of stellar populations in the central region of the cluster. Forty eight blue straggler stars are identified; they are found to be strongly concentrated towards the cluster center. The specific frequency of blue stragglers, , is in the inner region of M30 (), significantly higher than the frequency found in other clusters: – 0.15. The shape of M30’s blue straggler luminosity function resembles the prediction of the collisional formation model and is inconsistent with the binary merger model, of Bailyn & Pinsonneault (1995, ApJ, 439, 705). An unusually blue star (, ), possibly a cataclysmic variable based on its color, is found about from the crowded cluster center. Bright red giant stars () appear to be depleted by a factor of 2–3 in the inner relative to fainter giants, subgiants, and main sequence turnoff stars (95% significance). We confirm that there is a radial gradient in the color of the overall cluster light, going from at to in the central . The central depletion of the bright red giants is responsible for about half of the observed color gradient; the rest of the gradient is caused by the relative underabundance of faint red main sequence stars near the cluster center (presumably a result of mass segregation). The luminosity function of M30’s evolved stars does not match the luminosity function shape derived from standard stellar evolutionary models: the ratio of the number of bright giants to the number of turnoff stars in the cluster is 30% higher than predicted by the model ( effect), roughly independent of red giant brightness over the range to .
keywords:
globular clusters: individual (M30, NGC 7099) — blue stragglers — color-magnitude diagrams — stars: evolution — stars: luminosity function1 Introduction
The Hubble Space Telescope (HST) is ideally suited for the study of individual stars in the crowded central regions of dense Galactic globular clusters. The projected density of evolved stars alone ranges from about 0.3 arcsec-2 in the core of the well studied dense cluster M13 to arcsec-2 at the center of M15, the Galactic cluster with the highest known central surface density (Cohen et al. (1997), hereafter Paper VI). Resolving individual stars at these densities is beyond the current angular resolution limits of ground-based telescopes, but such observations are crucial in order to address several important astrophysical issues.
Globular clusters are excellent testing grounds for models of stellar evolution because the cluster members are coeval and have similar chemical composition (cf. Bergbusch & VandenBerg (1992)). Deviations from the natural process of (isolated) stellar evolution caused by stellar interactions in these environments of extreme star density can be explored by examining the radial dependence of the mix of stellar populations (cf. Piotto et al. (1988); Djorgovski et al. (1991)). Additionally, the dense cores of globular clusters are unique laboratories for studying the effects of two-body relaxation, equipartition of energy, and binaries on the dynamical evolution of dense stellar systems (cf. Hut et al. (1992); Meylan & Heggie (1997)). A visible product of stellar collisions and mergers of binaries, blue straggler stars (BSSs), are preferentially found in the central regions of most globular clusters (Ferraro et al. (1993); Bailyn & Pinsonneault (1995)).
This is the seventh in a series of papers describing HST observations of the centers of the nearest Galactic globular clusters with . The main scientific goals of this program are to measure the shape of the density profile in clusters and to understand the nature of evolved stellar populations in very dense regions by probing the variation in the mix of stellar types as a function of radius (and hence stellar density). Complementary programs targeting main sequence (MS) stars in globular clusters are being conducted independently by other groups to explore cluster dynamics (cf. Sosin (1997)) and models of stellar evolution (cf. Piotto et al. (1997)). In this paper we examine the evolved stellar populations of M30 (NGC 7099) using a set of techniques, developed in earlier papers (Guhathakurta et al. (1992); Yanny et al. 1994a ; Guhathakurta et al. (1996), hereafter referred to as Papers I, II, and V, respectively), to: (1) Build empirical point spread function (PSF) models using isolated bright stars, allowing for PSF variability across the image and using faint stars to reconstruct the saturated cores of brighter stars; (2) Iteratively fit the PSF template to the stars on the image; (3) Perform aperture photometry on each star after subtracting its neighboring stars with the best-fit PSF template; and (4) Carry out detailed and realistic image simulations to assess the effects of crowding on photometric accuracy and sample completeness.
M30 is a prototypical “post-core-collapse” globular cluster based on its rising surface brightness profile at radii . Its central surface brightness in the band is mag arcsec-2 (Djorgovski (1993)), corresponding to a projected density of arcsec-2 in post MS stars alone. The cluster has a relatively low metallicity, (Djorgovski & Piotto (1993); Zinn (1985)), a low line-of-sight reddening, (Burstein & Heiles (1982)), and is located at a distance of about 9.8 kpc (Reid (1997)). Based on this recent distance determination, the age of M30 is estimated to be about 10 Gyr (Sandquist et al. (1998)). It has long been noted that M30 displays a central bluing trend like other post-core-collapse clusters (Williams & Bahcall (1979); Chun & Freeman (1979); Cordoni & Aurière (1984); Peterson (1986); Piotto et al. (1988); Burgarella & Buat (1996)).
In this paper we use HST Wide Field/Planetary Camera 2 (WFPC2) data to investigate the origin of M30’s nuclear color gradient and to study its abundant population of BSSs; Yanny et al. (1994b, hereafter Paper IV ) used the same data set to examine the inner 20″ of M30. This paper is organized as follows: Sec. 2 contains a description of the data and reduction techniques; Sec. 3 contains results from our study of M30’s evolved stellar populations, with particular emphasis on BSSs, radial population gradients, and the stellar luminosity function (LF); Sec. 4 contains a summary of the main points of the paper.
2 Data
2.1 Observations
A set of eight WFPC2 images of the center of M30 (NGC 7099) were obtained on 1994 March 31 (see Paper IV for a discussion of the data set): s with the F336W filter, s with F439W, and s with F555W. These filters are roughly similar to the Johnson , , and bandpasses, respectively. All eight exposures were obtained at the same telescope pointing and roll angle.
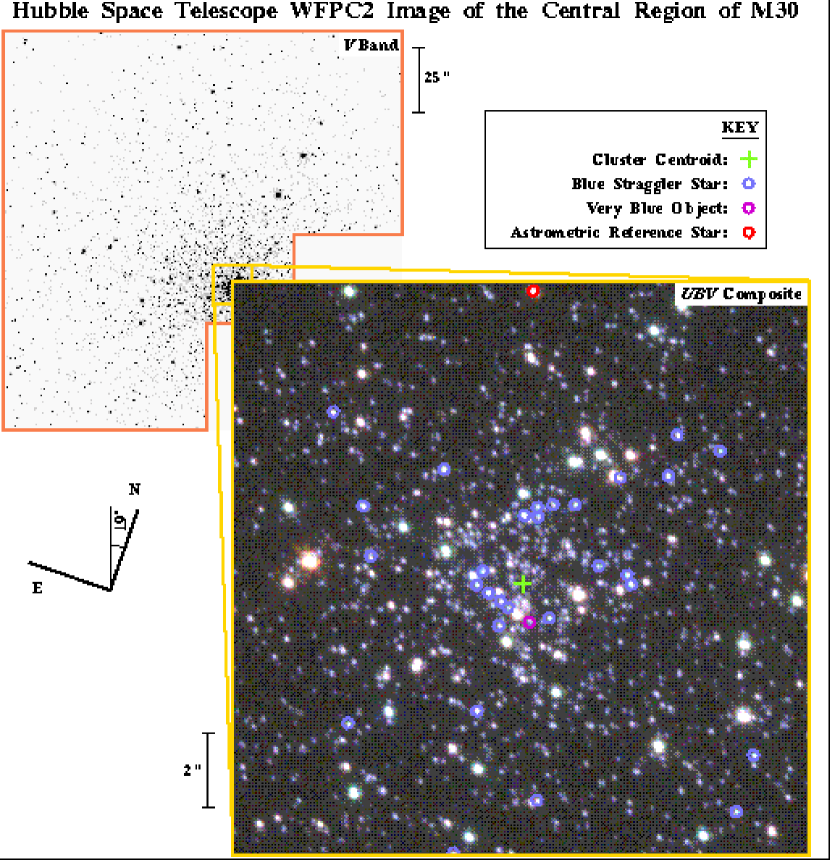
Each WFPC2 image consists of four Charge Coupled Device (CCD) frames: a Planetary Camera CCD (PC1) with a scale of pixel-1 and three Wide Field Camera (WF2–WF4) CCDs with a scale of pixel-1. The usable field of view is for PC1 and about for each WF CCD; the total image area is about 5.1 arcmin2. An image of the cluster is shown in Fig. 1 (Plate XXX). The telescope pointing was chosen so that the center of the cluster was positioned near the center of the PC1 CCD, shown in the lower right quadrant of the greyscale WFPC2 mosaic image. The WF2–WF4 images are oriented counterclockwise starting from the upper right quadrant of the mosaic. A detailed description of the instrumental parameters and in-orbit characteristics of WFPC2 is given by Burrows (1995) and by Trauger et al. (1994).
The exposure times have been chosen so that the brightest stars (, , ) in the image are not saturated by more than a factor of 4–5 in each individual exposure. In general, no more than 10 pixels are affected per star, and it is possible to recover their magnitudes and positions using information in the unsaturated wings of the PSF.
2.2 Data Processing / Stellar Photometry Technique
We have developed and tested procedures for deriving stellar photometry from HST images of dense globular clusters. The reader is referred to Papers I and II for a detailed description. Even though the procedures were originally designed for pre-repair HST data with an aberrated PSF, several of the steps are relevant for analysis of crowded star fields and we apply them here. The following steps for processing WFPC2 data are summarized below (see Guhathakurta et al. (1996)): cosmic ray removal, image coaddition, star finding, PSF building, PSF fitting/subtraction, and aperture photometry.
Standard bias and flat field calibrations have been applied to the data as part of the preprocessing pipeline at the Space Telescope Science Institute. Pixels affected by cosmic rays are identified and masked using an algorithm that compares each image to the other image(s) in that band; unmasked pixels in all images in a given band are averaged to obtain the final F336W, F439W, and F555W images.
Cross-correlating pairs of images in different bands shows that the stellar positions in the F555W and F439W band PC1 images are offset from the corresponding stellar positions in the F336W band PC1 image by 1.2 pixel () and 0.7 pixel (), respectively. For the WF2–WF4 CCDs, the offset is in the range of 0.34 – 0.59 pixel (–) between the F555W and F336W images and in the range 0.15 – 0.32 pixel (–) between the F439W and F336W images. The combined F336W, F439W, and F555W images are aligned by fractional pixel interpolation and summed to produce a deep image. Interpolation results in degradation of the PSF by an amount that varies from star to star due to the undersampling of the PC and particularly the WF CCD data; however, the interpolated image is only used to find stars (see below) and not to derive stellar photometry.
A preliminary list of stars is obtained by applying the standard peak finding algorithm find of the daophot package (Stetson (1987)) to the summed F336W+F439W+F555W image. Bright relatively isolated stars are used to build an empirical, quadratically variable daophot ii PSF template (Stetson (1992)) for each of the four bands and for each of the four CCD frames (PC1, WF2–WF4). This PSF template is fit to and subtracted from the stars on the image using daophot ii’s allstar routine. After inspecting the residual images (original minus best-fit template), the star list is edited to remove spurious objects, such as PSF artifacts around bright stars and hot pixels (the slight offset between stellar positions in F336W and F555W images facilitates the identification of fixed pattern artifacts), and to add stars fainter than the find threshold. The process of PSF building, fitting, and subtraction is iterated a few times; in each instance, the results of the previous iteration are used to remove neighbors of the bright stars used for PSF building. Finally, aperture photometry is obtained for each star, after its neighbors have been removed using the best-fit PSF template. The photometry lists in the three bandpasses are merged by positional matching. The final list of stars identified and matched in each of the three filters consists of 3114 stars from the PC1 image (0.32 arcmin2), and 2055, 1495, and 2843 stars from WF2–WF4, respectively (each WF CCD covers 1.60 arcmin2).
Tests based on bright, relatively isolated stars show that the PSF is stable across the WFPC2 field of view (see also Papers IV and V): the correction term for converting aperture magnitudes to “total” magnitudes varies by a few percent or less across each CCD image. Furthermore, this slight variation is similar in all three bands and the telescope pointing is identical for all exposures in all bands so the effect on measurement of stellar colors is negligible.
Differences in the zeropoints of the magnitude scale of the individual CCDs are determined by cross-correlating the “positions” of bright () stars in the color-magnitude diagram (CMD) between pairs of CCD frames. The tightness of the CMD features (Fig. 4), and the fact that several hundred stars are used to define the peak of the cross-correlation function, makes it possible to determine color and magnitude offsets to an accuracy of mag. The inter-CCD magnitude zeropoint offsets for WF2–WF4 with respect to P1 are [, , ] in F555W, [, , ] in F439W, and [, , ] in F336W. The zeropoint difference between the WF CCDs and PC1 results primarily from the different aperture sizes used to derive stellar photometry: vs . The zeropoint difference is largest in F336W because its PSF core is significantly broader than in F439W and F555W.
The cross-correlation technique used for inter-CCD zeropoint matching, as well as the procedure used to match the WFPC2 photometry to ground-based photometry (see below), relies on the validity of an implicit assumption: That there are no intrinsic spatial gradients in the color of the individual evolved stellar populations in M30, particularly in the and colors of faint red giant branch (RGB) stars which dominate by number the sample used for matching. Radial gradients in RGB color have never been convincingly demonstrated to exist in globular clusters; it is common to find changes in the mix of stellar types, but not in the color of a given stellar type. Moreover, it is reassuring that there is a perfectly plausible explanation for the observed inter-CCD zeropoint differences in the M30 data set.
A charge transfer efficiency problem during WFPC2 readout (Burrows 1995; Holtzman et al. 1995b ) causes objects at high row number to appear systematically fainter than if they had been at low row number. For exposures taken at C, a linear ramp correction ranging from no correction at row 1 to mag at row 800 (original CCD coordinates) works well to first order. We apply such a linear ramp correction to the stellar photometry; it results in a noticeable tightening of the horizontal branch (HB) and subgiant branch/main sequence turnoff (MSTO), the only features that are more or less horizontal in the CMD. Note that color measurements are unaffected by the charge transfer efficiency problem since the telescope pointing was identical for exposures in all three bands.
The zeropoints of the WFPC2 instrumental F336W, F439W, and F555W magnitudes are adjusted to roughly match ( mag) ground-based photometry of stars in M30 in the Johnson , , and bands (Dickens (1972)). There is not sufficient overlap between this ground-based data set (or any other published ones) and the HST data set to allow an extensive star-by-star comparison, the cluster’s central region being too crowded at arcsecond resolution. Instead, various fiducial points in the CMD—HB brightness, and the RGB color at the level of the HB and at the RGB base—and a variety of filter combinations [(B V, ) and (U B, )] are used to determine the zeropoints in all three bands. These zeropoints are in good agreement with the published WFPC2 photometric zeropoints (Burrows 1995). Following the prescription of Holtzman et al. (1995a), the zeropoint-adjusted magnitudes on the WFPC2 bandpass system, , , and , are converted to the Johnson system:
| (1) |
The and magnitude conversions are accurate, but the converted “” magnitude may be significantly different from true Johnson because of the severe red leak in the F336W bandpass (e.g., see Fig. 6) which is not adequately accounted for by quadratic terms in the color transformation equation.
2.3 Astrometry
Astrometric calibration has been carried out using the metric task (Gilmozzi et al. (1994)) within iraf’s stsdas package. This task uses HST pointing information based on the Guide Star Catalog to derive absolute astrometry, and corrects for mechanical geometric distortion and spherical aberration that vary from CCD to CCD, to place all the stars on a global coordinate system. A relatively isolated bright star, ID# 3611 in Table 3 (, , ), is adopted as the astrometric reference point:
| (2) |
The astrometric reference star (red circle in Fig. 1) is located E and N of the cluster centroid (green cross in Fig. 1).
The number-weighted centroid of evolved stars in M30, as determined in Paper IV , has coordinates of:
| (3) |
to a accuracy of . We adopt this as the cluster center in the rest of the analysis presented in this paper.
2.4 Photometric Accuracy and Completeness
Using artificial star tests and realistic simulations of HST WFPC2 images of M30 and M15 carried out in Papers IV and V, respectively, we estimate the degree of completeness and level of internal photometric accuracy in the data set analyzed in this paper. These error estimates, as well as the other error estimates discussed below, refer to the internal accuracy in the measurement of relative instrumental magnitudes; there may be additional systematic errors in the conversion to Johnson magnitudes ( mag in and , and significantly larger in due to the F336W red leak). The ratio of exposure times for M30 and M15 has been chosen to compensate for the 0.76 mag difference in their distance moduli (Djorgovski (1993)) so that the ratio of signal to (read+Poisson) noise is the same for stars of a given absolute magnitude. The surface density of post MS stars is about 10 times higher in M15 than in M30 (at comparable angular distances from the cluster center), while the shape of the LF of evolved stars is similar in the two clusters. Thus, the effect of crowding is slightly less severe in the M30 data set than in the M15 data set—i.e., the degree of completeness is higher and the photometry more accurate in M30 at a given absolute magnitude and angular distance from the cluster center.
Our best estimate for the photometric error in in the dense central of M30 is mag for bright stars () and about 0.10 – 0.15 mag for stars at the brightness level of the MSTO (). In this region of M30, effects of blending are expected to start becoming noticeable around the MSTO. The sample should be complete down to the MSTO even in the crowded central regions of the cluster. The simulations also indicate that, within , the level of completeness starts falling off for stars just below the MSTO (), dropping to roughly 50% for stars 2 mag below the MSTO. Incompleteness is expected to set in at progressively fainter magnitudes for samples at larger radii.
We carry out a consistency check of these completeness estimates by studying the observed LF of M30 stars as a function of radius. The stars detected in the full WFPC2 mosaic are divided into eight radial bins around the cluster center: (1) , (2) , (3) , (4) , (5) , (6) , (7) , and (8) . The boundaries of these radial bins are chosen so that each bin contains roughly the same number of stars with (); the data set should be complete at all radii for this bright subsample of stars so it provides a convenient means of matching the relative normalization of the LFs in the various radial bins. The shape of the LF of post MS stars is expected to be the same at all radii. This is because stars brighter than lie within a very narrow mass range (—Bergbusch & VandenBerg (1992)) so that the effects of mass segregation are negligible (cf. Pryor et al. (1986); Bolte (1989)).


The F555W-band stellar LFs are shown in Fig. 2. Note, these LFs are based on stars detected on the F555W image, without requiring that the stars also be detected in F439W or F336W; hence Johnson magnitudes are not available for all these stars. The bold line with dots shows the “most complete” combined LF based on the average of all radial bins for (to minimize Poisson error) and on the average of the two outermost annuli () for stars with (since the degree of completeness is highest in this sparse outer region). The LF in the innermost bin () is identical to the combined LF down to the MSTO, but peels away at fainter magnitudes as expected, dropping sharply beyond as a result of incompleteness. The magnitude at which incompleteness sets in appears to increase roughly monotonically with increasing annular radius in keeping with the trend seen in the simulations described above.
The F336W-band stellar LFs shown in Fig. 3 have a qualitatively similar behavior to those in the F555W band. A notable difference between the two bands is that RGB stars span a narrower range of brightness in (3.5 mag) than in (5 – 6 mag), a natural consequence of the fact that bright RGB stars tend to be redder than faint ones. Thus, the brightness contrast between faint MSTO stars and the brightest stars (at the tip of the RGB) is smaller at the shorter wavelength, so MSTO stars are slightly less affected by crowding in than in . This effect is partly offset by the fact that the signal-to-noise ratio for faint MS stars is slightly higher in than in : the longer exposure time is not enough to compensate for the lower instrumental efficiency and fainter intrinsic stellar brightness in . Another difference between the LFs in the two bands is that the slope of the MS portion of the LF is shallower in than in ; this is because faint MS stars tend to be redder than bright ones. We return to a detailed discussion of the stellar LF in Sec. 3.5.
The widths of prominent features in different CMDs (Figs. 4, 5, and 6)—the RGB at – and the MS just below the MSTO (–)—are used to estimate the overall error in stellar photometry, under the assumption that the features have zero intrinsic width. These error estimates represent averages over the entire area of the WFPC2 mosaic. For the filter combinations, , , and , the rms scatter in RGB color about empirically defined fiducial lines is 0.04, 0.02, and 0.04 mag, respectively, and the rms scatter in MS color is 0.08, 0.08, and 0.08 mag, respectively. These translate to photometric errors (in magnitudes) of , , and for the bright stars comprising the RGB, and , , and for faint MS stars.
3 Stellar Populations
Our analysis of M30’s stellar populations is based on photometry derived from the HST WFPC2 images of the central region of the cluster. Table 3 lists the relative positions, and , projected radial distance from the cluster centroid, and Johnson magnitudes and colors of the 40 brightest stars located within of M30’s center. Stellar positions are on the equinox J2000 coordinate system and are measured in arcseconds relative to the astrometric reference star, ID# 3611, whose coordinates are given in Eq. (2) in Sec. 2.3. The coordinates of the (number-weighted) cluster centroid are given in Eq. (3). The complete electronic version of Table 3 is available in the electronic edition of the Journal by link to a permanent database and via anonymous ftp (see Appendix); it contains 9940 stars from the full M30 WFPC2 data set. The stellar ID#s run sequentially through the full table in order of increasing right ascension.
![[Uncaptioned image]](/html/astro-ph/9805361/assets/x4.png)
3.1 Color-Magnitude Diagrams
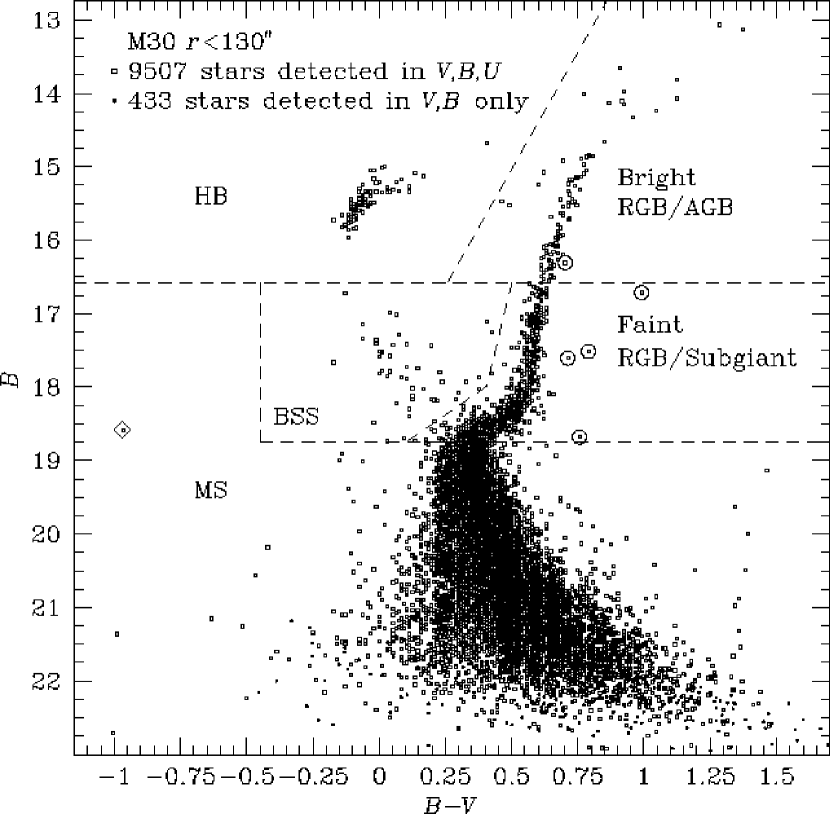
Figure 4 shows a (B V, ) CMD of all stars detected () in the 5.1 arcmin2 area of the WFPC2 mosaic image of M30. The 9507 stars matched in the , , and filters are marked as squares. An additional 433 stars that are detected and position-matched only in and are marked as dots (most are fainter than ). This CMD is used to assign a stellar type to each star: bright RGB and asymptotic giant branch (AGB) stars, faint RGB and subgiant stars, HB stars, and blue straggler stars (BSSs). The HB is entirely on the blue side of the RR Lyrae instability strip, with its -band brightness becoming fainter towards bluer colors. The bright part of M30’s RGB and AGB are relatively blue (relative to the average Galactic globular cluster), in keeping with its low metallicity: (Djorgovski (1993)). The MS is reasonably well defined up to mag below the MSTO. There is a prominent, well-populated blue straggler sequence in the diagram (Sec. 3.2). The definition of BSS is somewhat arbitrary, as is the boundary between faint and bright RGB stars. The bright vs faint RGB boundary has been drawn at , fainter than the level of the HB (the customary demarcation line), in order to ensure that the bright RGB/AGB sample is large enough for a study of radial gradients. Note, a similar CMD (based on PC1 data alone) is presented in Paper IV . Even though the -axis of Fig. 4 of Paper IV is mistakenly labeled as “”, the quantity that is plotted in that figure is B V color with an arbitrary offset.
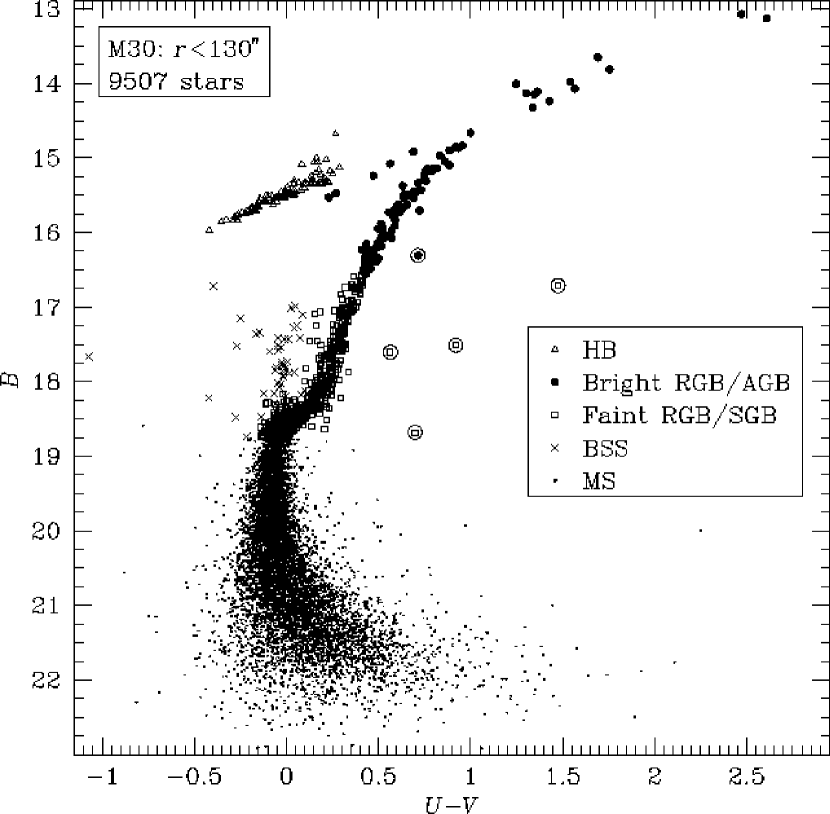
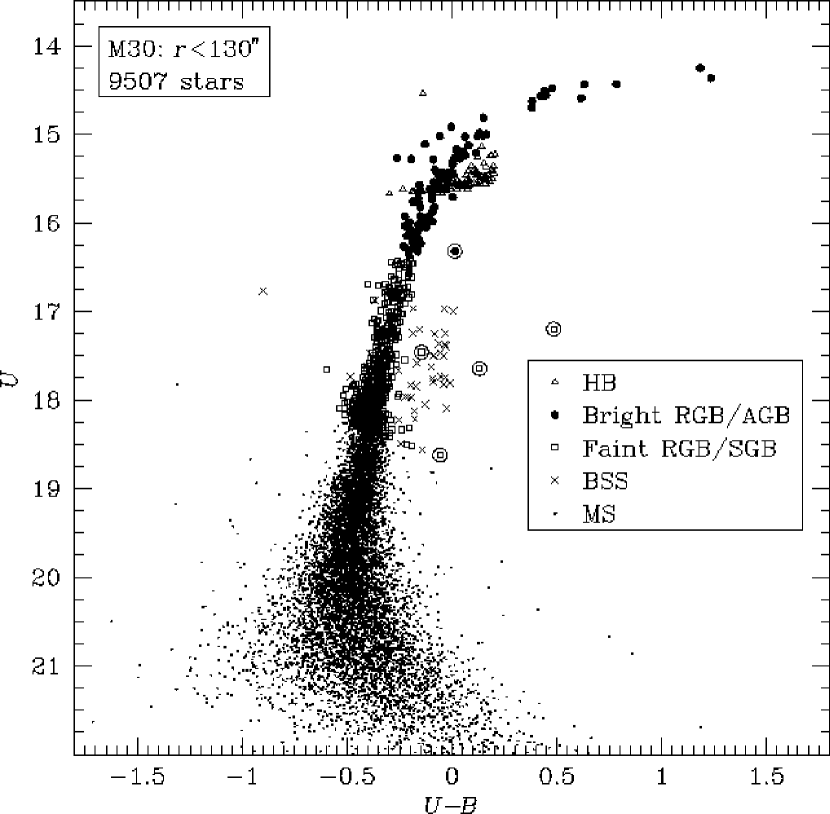
Using different symbols for different stellar types [as defined by the (B V, ) CMD], we plot the same 9507 stars in the (, ) and (U B, ) CMDs in Figs. 5 and 6, respectively. The long color baseline is sensitive to subtle differences in stellar temperature (despite the red leak in the HST F336W filter), resulting in a clear separation among the HB, bright RGB, and AGB. The MS and BSS sequence are mostly vertical in the projection making it difficult to distinguish between “true” BSSs and artifacts caused by the blending of MSTO stars. The HB stars all have about the same brightness, the bolometric correction to the magnitude being nearly independent of temperature for these hot stars, so that the HB feature is nearly horizontal in the (, ) CMD. This projection highlights the seriousness of the red leak in the F336W filter which causes the bright RGB and AGB to shift to the left so that they intersect the HB. The red leak also causes the faint RGB and MS stars to be mapped all the way across to the left (blue) side of the BSS sequence. Even with the red leak however, stars of a given type, as defined in the (, ) CMD, tend to remain grouped together in the (, ) projection.
Note the very blue star in the (B V, ) CMD: , (large diamond symbol in Fig. 4; star ID# 2931 in Table 3). This star may possibly be a cataclysmic variable star based on its location in the CMD, although we are unable to comment on its variability from our data set alone. It is located SSW of the cluster center, well outside the (formal) error circle for the cluster centroid, offset by and from the reference star (see Sec. 2.3 for details on astrometry); this unusually blue star is marked by a mauve circle in Fig. 1. The apparent proximity of the object to the cluster center makes it particularly interesting, but the extreme crowding in this region makes spectroscopic followup a difficult prospect (the star has a mag brighter RGB neighbor only away).
There are five relatively bright (–) objects in the CMDs which are significantly redder in and (by up to +1 mag) than typical RGB, subgiant, and MSTO stars of comparable apparent brightness in M30; these objects have stellar ID#s of 890, 4735, 9200, 9350, and 9508 in Table 3 and are indicated by encircled symbols in Figs. 4 – 6. One cannot rule out the possibility that these are cluster stars with abnormal spectral characteristics. However, the fact that these five objects are not concentrated towards M30’s center casts serious doubt on their cluster membership: four out of the five lie beyond , whereas only about 15% of cluster members within the WFPC2 image are expected to lie beyond this radius. No radial velocity measurements are available for these five red objects (K. Gebhardt, private communication); M30’s large negative radial velocity, km s-1 (Zaggia et al. (1992)), should make it easy in principle to distinguish field stars from cluster members. On the basis of a realistic model of the Galaxy, Ratnatunga & Bahcall (1985) predict a surface density of field star interlopers of about 3 arcmin-2 to , or a total of 15 interlopers within the area of the WFPC2 mosaic. Most of these field stars are expected to be faint: less than four field stars are expected to be brighter than and less than one star (0.37) is expected to be brighter than . The fact that even field stars tend to cluster together implies that the probability of finding five bright field stars could be higher than the Poisson estimate. If these five red objects in the the M30 WFPC2 data set are foreground MS stars of similar metallicity, there is a 3 mag spread in distance modulus (factor of 4 in distance) amongst them. These objects are even less likely to be background galaxies. Field stars are expected to outnumber field galaxies for , even at high Galactic latitude. Moreover, our PSF fitting procedure is designed to identify and eliminate extended objects (galaxies); no such objects are found in the M30 data set.
![[Uncaptioned image]](/html/astro-ph/9805361/assets/x8.png)
3.2 Blue Stragglers
3.2.1 Identification
The (, ) CMD of M30 presented in Fig. 4 shows a large collection of BSS candidates in the region between the MSTO and the extended blue tail of the HB. This sequence of BSS candidates lies roughly where the continuation of the MS would be, if it were to be extrapolated beyond (i.e., brighter and bluer than) the MSTO. These stars are, for the most part, distinct from HB and MSTO stars in all three color-magnitude projections (see Figs. 4 – 6).
Table 3.1 lists the positions, brightnesses, and colors of the 48 BSS candidates outlined by the dashed lines in Fig. 4. All positions are on the equinox J2000 coordinate system and are measured with respect to the reference star as described in Sec. 2.3. The stars in Table 3.1 are arranged in order of increasing projected distance from the cluster center. The stellar ID#s for the BSS candidates are the same as those in the complete (electronic) version of Table 3.
A “” symbol is used to mark marginal candidates in Table 3.1, those for which the BSS designation may be in some doubt. Results from earlier image simulations (Papers IV and V) indicate that blending and/or errors in the photometry of subgiant/MSTO stars can contaminate the BSS portion of the CMD. We have been very conservative in designating “marginal” BSS candidates: these include all the ones fainter than (since this region may be populated by blend artifacts), those that are close to the edge of the selection region, and outliers that are separated from the upward extrapolation of the MS track. It is possible that some fraction of the marginal BSS candidates in M30 are actually subgiant/MSTO stars that have been scattered away from their fiducial locations in the CMD due to measurement error. Contamination is likely to be most severe at the base of the BSS sequence where it meets the subgiant branch and MSTO (, ), so this region has deliberately been excluded from the BSS defining box from the outset (Fig. 4). Our BSS sample is likely to be incomplete at the faint end (near the MSTO), as the defining box is liable to exclude BSS if their luminosity . The exact balance between the competing effects of BSS sample contamination and incompleteness depends on the details of the somewhat arbitrary BSS defining criteria used. The M30 BSS population is unlikely to be contaminated by field star interlopers; less than one field star is expected in the region of the (B V, ) CMD brighter and bluer than the MSTO based on the Bahcall-Soneira model of the Galaxy (Bahcall & Soneira (1980); Ratnatunga & Bahcall 1985).
3.2.2 Specific Frequency
The specific frequency of BSSs in M30 is calculated according to the definition of Bolte et al. (1993): . Although M30’s HB stars do not all have the same brightness (Fig. 8), the HB has a well defined brightness of at the location of the RR Lyrae instability region () before dropping to fainter magnitudes at the blue end. There are 332 RGB/AGB/HB/bright subgiant stars in the arcmin2 WFPC2 mosaic image () that fulfill the criterion for the normalizing population and 48 BSSs—an overall specific frequency of ( Poisson error). This statistic is computed as a function of radius and the results are listed in Table 3.2.2. The numbers listed in Table 3.2.2 are slightly different from those quoted in Paper IV ; this is due in part to the inclusion of data from the WF CCDs and in part to a slightly revised defining criterion for BSS candidates.
Table 3. Blue straggler and subgiant/turnoff specific frequency vs radius in M30.
| 10 | 31 | 79 | 0.392 | 244 | 0.324 |
| 20 | 36 | 144 | 0.250 | 429 | 0.336 |
| 30 | 41 | 192 | 0.214 | 528 | 0.364 |
| 60 | 43 | 267 | 0.161 | 750 | 0.356 |
| 100 | 48 | 327 | 0.147 | 921 | 0.355 |
The BSS specific frequency found in the inner of M30, , is higher than the specific frequency found in other well studied (e.g., at HST resolution) globular clusters, including ones whose density is comparable to or greater than that of M30, such as M15 (cf. Sosin & King (1995); Paper VI). In fact, the overall BSS frequency in the M30 WFPC2 data set, , falls at the high end of the typical factor of 3 range seen in Galactic globular clusters.
If the marginal BSS candidates in M30 are excluded from the analysis, the remaining (secure) BSS candidates have a specific frequency of in the overall data set and in the central . These values should be treated as lower bounds to the “true” BSS frequency in M30—a fair fraction of the marginal candidates (possibly the majority) are likely to be real BSSs, and the defining box is liable to have missed faint BSSs (Sec. 3.2.1). For the purpose of comparing M30’s BSS frequency to that of other clusters, it is best to consider values based on the full set of BSS candidates (secure+marginal) because: (1) estimates of in other clusters tend to include marginal candidates, and (2) the BSS defining criteria used in this paper (Fig. 4) are similar to those used in other studies.
3.2.3 Central Concentration
The value of in M30 displays a dramatic increase towards the cluster center (see Table 3.2.2 and Sec. 3.3.1). The BSS frequency in the region of the WFPC2 mosaic image is , a factor of 4 lower than in the inner (), but in keeping with the value seen in other clusters (Paper VI). The concentration of the M30 BSSs towards the cluster center is consistent with the idea that they are more massive than individual RGB/subgiant stars (either merger remnants or members of close binary systems), and have consequently sunk deeper into the cluster potential well (King (1991)).
Restricting the M30 BSS sample to only secure candidates (i.e., those not marked by a “” in Table 3.1), the specific frequency is seen to increase by a factor of 3 from in the outer region to in the central region. The sample of secure BSS candidates, being well removed from the subgiant/MSTO region of the CMD, is uncontaminated by blends. This is firm proof that M30’s BSSs are indeed physically concentrated towards the cluster center; the observed concentration is not an artifact of increased photometric scatter/blending in the crowded central region of the cluster. In fact, the data in Tables 3.1 and 3.2.2 suggest that the majority of even the marginal candidates in M30 are faint (but real) BSSs which are centrally concentrated in a similar manner to their brighter (and hence more secure) counterparts.
We investigate whether the high BSS fraction in M30’s inner region is produced by anomalies in the normalizing population of RGB/AGB/HB/bright subgiant stars () by comparing the radial distribution of this normalizing population to that of faint subgiant/turnoff (SGTO) stars in the cluster. The SGTO class is defined by the criterion: , where . The fraction, , is consistent with being constant throughout the central of M30 (Table 3.2.2); the apparent 5%–10% decrease in in the inner compared to the global value is not statistically significant ( effect), and this has a negligible effect on the measurement of . Furthermore, a study of the LF of M30’s evolved stellar population shows that the abundance of RGB/AGB stars relative to fainter stars (faint subgiant, MSTO, and MS stars) is not anomalously low; rather, their abundance is a little higher than normal (see Sec. 3.5).
3.2.4 Blue Straggler Luminosity Function

Theoretical studies of the formation of BSSs indicate that the BSS LF may be a good discriminant between different formation scenarios (Bailyn & Pinsonneault (1995)). For example, stellar collisions produce a tail of very luminous BSSs while mergers of primordial binaries do not. Bailyn & Pinsonneault adopt a top heavy input mass function for stellar collisions since these are important in the dense central regions of clusters where massive stars are expected to be concentrated as a result of mass segregation; input masses for the primoridal binary merger case are likely to be drawn from a more normal (e.g., Salpeter (1955); ) mass function. The authors also consider two extreme options for the compositional structure of a newborn BSS that ought to bracket the realistic range of possibilities—they dub these ‘collisional’ chemistry, which corresponds to complete mixing yielding a chemically homogenous product, and ‘binary merger’ chemistry, which corresponds to no mixing.
Figure 7 shows the observed BSS LF in M30 (bold dots with Poisson error bars) compared to various Bailyn & Pinsonneault model BSS LFs for metal poor stars: or . The BSS luminosities are estimated from their brightnesses, with a mag correction to the observed to account for red leak and an additional mag differential bolometric correction. We expect our sample of M30 BSSs to be incomplete for or (indicated by vertical dot-dashed line in Fig. 7); this region is too close to the MSTO and our BSS selection boundary has been designed to avoid contamination from MSTO and subgiant stars. The model LFs and the M30 data are normalized to unity over the “complete” range, .
The shape of the LF of BSSs in M30 bears a general resemblance to the shape of the collisional model LFs (). The peak in the M30 LF at and the suggestion of a tail to higher BSS luminosities are not reproduced in the primordial binary merger model LF: An input mass function binary merger model is shown in Fig. 7; in fact, all merger models with have a qualitatively similar shape to the case (Bailyn & Pinsonneault (1995)). The intermediate luminosity peak in M30’s BSS LF is also apparent from the (, ) CMD in Fig. 4: note the concentration of BSSs and the hint of a “gap” between the BSS sequence and MSTO. While BSSs are more abundant in M30’s central region than in any of the other clusters studied to date, the total number of stragglers found in the WFPC2 image of M30 is too small to draw any firm conclusions about the shape of their LF. It is fair to say though that the data are strongly suggestive of a collisional origin for the BSSs.
3.3 Population Gradients
In order to study radial variations in the mix of M30’s stellar populations, the stars detected in the full WFPC2 mosaic are divided into eight annuli around the cluster center, as in Sec. 2.4: (1) , (2) , (3) , (4) , (5) , (6) , (7) , and (8) . The limiting radii of the eight radial bins have been chosen so that each bin contains approximately the same number of stars with , a limiting magnitude for which the samples at all radii are expected to be complete.
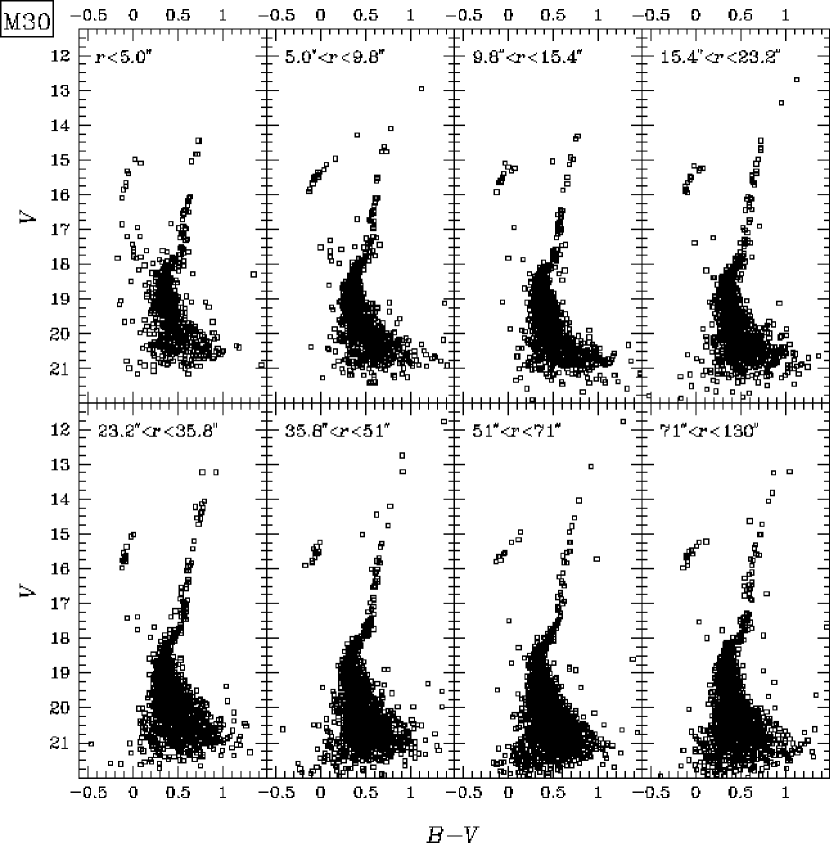
3.3.1 Comparing the Radial Distribution of Various Stellar Types
In this section, we compare the radial density distributions of the various types of evolved stars found in M30’s central region. Figure 8 is a composite of the (, ) CMDs in each of the eight radial bins. The morphology of the stellar distribution in this CMD is qualitatively similar to that in the (, ) CMD (Fig. 4), except that both the RGB and HB are slightly more extended and vertical than in the latter CMD. There are no striking differences in the mix of stellar types from one annulus to another, aside from the obvious excess of BSSs in the inner bins (see also Sec. 3.2.3 and Table 3.2.2). There is an indication that the central regions are deficient in bright RGB/AGB stars (); the innermost bin also appears to be slightly deficient in HB stars (the degree and significance of these effects are quantified below). The scatter due to photometric error decreases, and the degree of completeness for stars fainter than about increases, as one moves from the dense central region to the less crowded cluster outskirts.
Table 4. Relative radial distribution of evolved stellar populations in M30.
| Radial Bins333 (1) , (2) , (3) , (4) , (5) , (6) , (7) , (8) . | |||||||||
| Stellar Subsample | (1) | (2) | (3) | (4) | (5) | (6) | (7) | (8) | |
| Post MSTO stars () | 160 | 159 | 155 | 159 | 157 | 157 | 153 | 160 | |
| Bright stars () | 36 | 43 | 40 | 43 | 47 | 40 | 36 | 47 | |
| All stars () | 645 | 915 | 939 | 1099 | 1278 | 1449 | 1647 | 1535 | |
| Faint RGB/Subgiants | 93 | 86 | 87 | 85 | 87 | 104 | 96 | 85 | |
| Bright RGB/AGB | 5 | 8 | 9 | 16 | 16 | 13 | 15 | 16 | |
| HB | 8 | 16 | 13 | 12 | 13 | 11 | 9 | 16 | |
| BSS | 21 | 10 | 3 | 3 | 5 | 0 | 3 | 3 | |
Table 3.3.1 lists the number of stars of each type in the eight radial bins. The division of stars into various stellar types is defined by the dashed lines in Fig. 4. The total number of stars in each radial bin increases towards larger radii due to the increased probability of detecting faint MS stars () in the relatively sparse outer parts. Faint RGB stars and subgiants make up the bulk of the complete reference sample used to define the limiting radii, so it is not surprising that their numbers are roughly constant across the bins. There is a depletion of bright RGB/AGB stars in the inner bin compared to the average of all bins. The inner depletion is slightly more significant () relative to the average of the outer four bins () rather than the overall average; the overall average is biased low due to the RGB depletion in the center. The bright RGB sample size is too small to tell whether the central deficiency is stronger for the brightest giants (those with or ) than for the full set of bright RGB stars ( as defined in Sec. 3.1); the effect is less significant for the subset than for the full set, but this is due to the increased Poisson error associated with the brighter subset. The slight apparent depletion of HB stars in the central 5″ compared to the overall average is not statistically significant ( effect).


Figure 9 shows the cumulative radial distributions of different types of stars in the core of M30 over the full area of the WFPC2 mosaic (). Figure 10 shows the cumulative radial distribution for the inner region of the cluster. A two-sided Kolmogorov-Smirnov (KS) test is used to measure the probability that a given pair of stellar types is drawn from the same underlying radial distribution function. We use the faint RGB sample as the comparison population for KS tests as this phase of stellar evolution is relatively uncomplicated and well understood. Faint RGB, bright RGB/AGB, and HB stars are expected to have the same radial distribution because: (1) stars evolving “normally” should proceed from faint RGB/subgiant to bright RGB/AGB to HB without a significant change in mass, and (2) even if the masses of these different stellar types were slightly different because of mass loss during the bright RGB phase, mass segregation proceeds on a dynamical timescale which is longer than the evolutionary timescale in these phases.
The KS probability that the BSSs are drawn from the same radial distribution as the faint RGB/subgiant population is less than . The cumulative radial distribution plots show that the BSSs are strongly centrally concentrated with respect to all the other stellar types, and that this trend is strong even within the inner of the cluster (Figs. 9 and 10), in keeping with the specific frequency vs radius calculation in Sec. 3.2.3 and Table 3.2.2. The bright RGB/AGB and faint RGB/subgiant populations have different radial distributions, with only a 5.4% KS probability of being drawn from the same distribution. In contrast, the radial distributions of the HB and faint RGB/subgiant stars are consistent with each other.
Previous studies of M30 have noted that its central region is deficient in bright RGB stars relative to its outer region (cf. Piotto et al. (1988)). The cause of the bright RGB depletion in M30 and other post-core-collapse clusters remains something of a mystery. Djorgovski et al. (1991) examine a variety of physical mechanisms—tidal interactions, stellar collisions, Roche lobe overflow of an evolving red giant in a tight binary system, etc.—but find that none of these provides a convincing explanation of the observations. The general consensus appears to be that binaries play some role in causing the central depletion of bright RGB stars; this has motivated several detailed, but as yet inconclusive, theoretical investigations of the effect of binaries on post MS evolution (cf. Taam & Lin (1992); D’Antona et al. (1995)).
3.3.2 Which Stellar Populations are Responsible for the Radial Color Gradient Near M30’s Center?
In order to study the radial color gradient in the integrated starlight of the cluster, we construct mosaic images from the WFPC2 data in the F439W () and F555W () bands (greyscale image in Fig. 1) using the metric task in iraf/stsdas which corrects for distortion/aberration in each CCD image and inter-CCD rotations and translations. Standard aperture photometry routines (with sky subtraction) are used to measure the integrated flux in each band in each of the eight radial bins defined in Sec. 2.4. The background “sky” level is estimated from relatively sparse areas of the mosaic image. Sky counts make up as much as 22% of the total counts in the outermost radial bin () of the F439W image; the fractional contribution of sky counts is lower in the F555W band, and decreases sharply at smaller radii in both bands. The integrated cluster fluxes are converted to - and -band surface brightnesses using the photometric calibration parameters (zeropoint and color transformation) described in Sec. 2.2. The “effective” radius of each bin is taken to be the median radial distance from the cluster center of all evolved stars in that bin. This is more representative than the simple average or area-weighted average of the limiting radii of the bin; the distinction is especially important for the innermost bin which covers the largest dynamic range in radius, and for the outermost bin whose outer edge is defined by the outline of the WFPC2 mosaic image and this causes the actual number of stars detected to be a strongly decreasing function of radius.

Figure 11 shows the integrated color of M30 as a function of radius (bold line with dots in both panels). Our measurements are in good agreement with previous measurements of the color gradient of the overall cluster light (Piotto et al. (1988); Burgarella & Buat (1996)) and may be summarized as: mag/dex with a color of at a radius of .
We next investigate which of M30’s stellar types is/are responsible for the observed color gradient. If the color gradient were caused by a single population of stars, the gradient would disappear when light from that population in each band is redistributed “uniformly” throughout the cluster. We use the radial distribution of the integrated stellar flux to define what is meant by “uniform” redistribution. Before summing the fluxes in the two bands, the relative flux normalization is chosen such that faint RGB stars make an equal contribution in and ; these stars have the same color as the mean color of the integrated cluster starlight over the area of the WFPC2 image: . For each population (BSS, HB, bright RGB/AGB, faint RGB) in turn, we subtract the actual flux of that population in every radial bin, and then redistribute the total amount of flux removed in a uniform and identical fashion in both bands. The step of adding the light back in is critical as it dilutes any remaining color gradient by the appropriate amount, thereby allowing us to quantify the contribution of a given stellar type.
The effect of redistributing the light of a single evolved stellar population on the overall color gradient is shown by the various curves in the upper panel of Fig. 11. It is clear that bright RGB/AGB stars affect the color gradient more than any other evolved stellar type, but account for only about a third of the observed gradient, or only mag/dex. The observed lack of smoothness in M30’s integrated profile is a reflection of the stochastic nature of the bright RGB/AGB flux component: a relatively small number of stars contributes a significant fraction of the total light. Redistribution of the light of bright RGB/AGB stars results in a considerably smoother color gradient (short dashed line in upper panel of Fig. 11). The population of blue HB stars, long a popular suspect for the central bluing trend, do not affect the the overall color gradient of the cluster light very much: mag/dex. Another popular suspect, the BSSs only affect the color by 0.02 mag in the innermost bin.
Although quite numerous near the center, the BSS sample is not a significant contributor to the overall gradient. A simple calculation verifies this: bright RGB stars are about 3 times as numerous as BSSs in the center of M30 (see in Sec. 3.2.2); they have mean colors of and , a difference of mag; the typical BSS is about 2 mag fainter than a bright RGB star (the ratio of their fluxes is %); bright RGB stars contribute about 50% of the total cluster light (see Sec. 3.4); the fractional BSS portion of the integrated stellar flux in the central bin is %; thus, the concentration of BSSs in the innermost bin is expected to affect the overall color by only mag.
The lower panel of Fig. 11 shows that a smooth color gradient of mag/dex remains when the flux from all evolved stars is redistributed. This remaining color gradient must be due to the unevolved stars (with ) in M30. We estimate the combined flux of all cluster MS stars—both resolved stars with as well as those that are fainter than the detection threshold—by subtracting the contribution of all evolved stars from the total cluster flux in each bin. By redistributing the MS light uniformly, we verify that this population does indeed account for approximately half of the overall color gradient observed (dashed line in the lower panel of Fig. 11). The contribution of MS stars to M30’s radial color gradient is best explained in terms of mass segregation (Pryor et al. (1986); Bolte (1989)). There is direct evidence that the fractional flux of MS stars increases outwards across the eight radial bins (see Sec. 3.4 below). Moreover, the mean color of the MS light is expected to become redder with increasing radius because of an increasing fraction of lower MS stars whose colors are redder than the cluster’s mean color of 0.65. These faint red stars are mostly unresolved in the WFPC2 images; the resolved MS stars tend to be the brighter ones just below the MSTO and these have bluer colors (Fig. 4).
Djorgovski & Piotto (1993) suggested that M30’s color gradient is caused by depletion of giants in center of the cluster, while Burgarella & Buat (1996) concluded that the color gradient cannot be explained by the evolved and resolved stellar populations alone. We find that bright RGB/AGB stars are responsible for only about a third of the overall color gradient and that about half of the gradient is caused by stars below the MSTO. There is a 5% chance that the central depletion of bright RGB stars, and the associated color gradient of mag/dex, is a statistical fluke (Sec. 3.3.1). The contribution of HB stars to the gradient is more likely to be a result of Poisson fluctuations. The color gradient due to the mass segregation of MS stars, about half the overall gradient, is highly significant in a statistical sense.
3.4 The Contribution of Various Stellar Types to the Integrated Starlight

Figure 12 shows the surface brightness as a function of radius for various stellar populations as well as for the total cluster light (bold line with dots). Bright RGB/AGB (defined by for this study) and HB stars taken together account for most of the light of evolved stars, especially beyond . The central depletion of bright RGB/AGB stars relative to faint RGB stars is apparent: the integrated bright RGB/AGB/HB flux is 4 times that of the faint RGB flux in the outer parts, whereas their fluxes are comparable in the innermost bin. The MS component (total flux minus integrated flux of all evolved stars) is about a third of the total flux in the inner two bins and increases to about half the total flux in the outermost bin, likely a result of mass segregation. The “true” degree of segregation of the MS component is slightly larger than this observed fractional increase, since the effect is diluted by the central depletion of bright RGB/AGB stars. For example, the ratio of integrated MS flux to faint RGB flux increases from 1.5–2 in the inner part () to about 4–5 beyond .
The surface brightness profile of M30’s integrated starlight displays significant curvature in a log-log plot (Fig. 12). The slope interior to is about , where is the power law index of the projected density profile: . The faint RGB component’s brightness profile slope in this same inner region is ; this measure is unaffected by the central depletion of bright RGB stars and is in good agreement with the number-weighted estimate of M30’s density profile (Paper IV ). The profile slope for the total light as well as for each stellar type steepens to about beyond , the asymptotic power law slope of a King profile for (King (1962)).
3.5 Luminosity Function
The observed distribution of red giant luminosities in a globular cluster, while relatively easy to measure, can serve as a direct and powerful diagnostic of the rate of fuel consumption as a function of the evolutionary stage of the star from the beginning of the post-main-sequence phase (development of hydrogen burning shell) to the tip of the RGB phase (helium flash). The luminosity of an RGB star is expected to be determined principally by the mass of its helium core (Refsdal & Weigart (1970)). Detailed stellar evolutionary models do indeed confirm that the gross shape of the LF of red giants (those significantly brighter than the subgiant branch) is largely independent of the metallicity and age of the cluster (Bergbusch & VandenBerg (1992)).

Figure 13 compares the observed M30 -band stellar LF to model isochrones computed by Bergbusch & VandenBerg (1992) with abundances of , [O/Fe], and . The adopted composition is consistent with abundance estimates for the cluster (cf. Zinn & West (1984); Carretta & Gratton (1997); Sandquist et al. (1998)). An apparent distance modulus of , based on fitting subdwarfs with Hipparcos distance measurements to the cluster MS (Reid (1997)) and line-of-sight reddening of (Zinn (1980); Burstein & Heiles (1982); Richer et al. (1988)), is adopted. Most AGB stars (all but the reddest ones) and all HB stars are excluded in computing M30’s LF since such stars are absent from the Bergbusch & VandenBerg model; the remaining AGB stars make a negligible perturbation on the LF, as do BSSs (% effect for the bins around to +3). No completeness correction has been applied; incompleteness is unimportant across most of the brightness range shown in Fig. 13 (), as the stars fainter than the MSTO (solid dots) are drawn only from the outer two annuli () where crowding is not too severe. The relatively rare bright stars comprising the portion of the LF are counted over the full WFPC2 image (); the bright and faint parts of the LF are matched to each other using counts of all stars with ().
The Bergbusch & VandenBerg model LFs shown in Fig. 13 are normalized to match the data over the range (). The 10 Gyr and 8 Gyr isochrones provide acceptable fits to M30’s MS stars in the range (incompleteness sets in for or ) for initial mass function slopes in the range to , where is defined by the usual relation: . The portion of the LF with corresponds to a very narrow range in stellar mass ( for a 10 Gyr isochrone) so that the shape of this portion of the model LF is almost independent of the mass function slope . Based on studies extending further down the MS beyond (Bolte (1994); Sandquist et al. (1998)), a mass function slope of is quite reasonable for the – region of the cluster from which the faint stars in Fig. 13 are drawn. While the isochrones are normalized to the MS portion of M30’s LF, the 10 Gyr isochrone also fits the subgiant portion well. The MSTO luminosity for the 8 Gyr isochrone is noticeably brighter than in M30, and this is manifested as an excess in the predicted number of subgiants across the range .
The number of RGB stars with () found in M30 is 220, 30% higher than predicted by the appropriately normalized model LFs (170). The deficit is significant at the level. The effect is independent of RGB luminosity for . Earlier ground-based studies have noted a similar mismatch between observation and standard stellar evolutionary models in the region of M30 (Bolte (1989); Sandquist et al. (1998)). The “RGB excess” phenomenon is not unique to M30—the metal poor clusters M5 (Sandquist et al. (1996)) and M13 (Paper VI) display an RGB excess relative to theoretical models, but unlike the case of M30, the excess in these two clusters is restricted only to giants brighter than the RGB bump or HB level ().
One possible way of resolving the discrepancy between M30’s observed RGB LF and theoretical LFs is by invoking the effect of internal core rotation in stellar models (Larson et al. (1995); VandenBerg et al. (1998)). This tends to decrease the rate of RGB evolution (by expanding the core and lowering the shell temperature) and to thus increase the number of giants in any luminosity bin at a given instant. Core rotation models have only been constructed, however, for giants fainter than ; thus, these models do not directly address the RGB excesses observed in M5 and M13. A more comprehensive solution based on “deep mixing” has recently been explored by Langer et al. (1998). Deep mixing has already been invoked to explain: (1) chemical abundance anomalies in some bright cluster giants in terms of processing of envelope material in the hotter energy generating shell (cf. Kraft (1994)); and (2) anomalies in the HB color (second parameter problem) and brightness in terms of introduction of helium rich material into the envelope (Sweigart (1997)). Langer et al. propose that the “extra” fuel mixed into the hydrogen burning shell might also account for the overabundance of RGB stars seen in certain clusters.
The observed excess of red giants relative to the standard model is not an artifact resulting from incompleteness in the faint star counts. As discussed above, the shape of the MS LF for is a good match to model LFs, so any incompleteness in the star counts would have to be independent of apparent magnitude over this range (). Our image simulations indicate that the sample is complete down to over the – region from which this part of the LF is constructed (Sec. 2.4). Moreover, incompleteness tends to be a strong function of apparent magnitude; this is clearly seen in the crowded inner region () of M30 where incompleteness sets in at brighter magnitudes (open circles in Fig. 13; see also Fig. 2).
The conclusion about M30’s RGB excess is essentially independent of the adopted cluster distance modulus and choice of isochrone age (Fig. 13). For any reasonable value of , can be chosen so that the model LF (Bergbusch & VandenBerg (1992)) fits the MS and subgiant “bump” portions of M30’s LF, but the model underpredicts the number of RGB stars. Even if the assigned value of is too large (too small) for a given distance modulus, the result is an apparent excess (deficiency) in M30’s subgiant population relative to the model, provided the model LF is normalized to the MS portion of M30’s LF; the degree of M30’s RGB excess though is unaffected by such a mismatch between and . In spite of recent improvements in the measurement of subdwarf parallaxes with Hipparcos, the distance modulus of M30 remains uncertain at the level of mag, corresponding to an uncertainty in the cluster age of Gyr (Reid (1997); Gratton et al. (1997); Pont et al. (1998); Sandquist et al. (1998)). The distance scale we have adopted, (Reid (1997)) happens to be at the high end of this range, so that the corresponding best-fit age, Gyr, is lower than in other studies.
4 Conclusions
-
1.
Hubble Space Telescope Wide Field/Planetary Camera 2 images of the dense globular cluster M30 (NGC 7099) in the F555W, F439W, and F336W filters have been analyzed. Accurate stellar positions and photometry in the (Johnson) bands are presented for 9507 stars (and photometry for an additional 433 stars) within a projected distance of 130″ from the cluster center. Color-magnitude diagrams based on the bands are presented showing clearly distinguished sequences of stellar types: red giant branch, (blue) horizontal branch, subgiant branch, blue straggler sequence, main sequence turnoff, and main sequence. Typical photometric errors for main sequence stars (– 20) range from mag for the central 10″ of M30 to mag in the rest of the cluster. Incompleteness sets in a little fainter than the main sequence turnoff () for but the sample is complete to progressively fainter magnitudes at larger radii ( for ).
-
2.
An unusual star is found SSW of the cluster center. Its very blue color (, ) indicates that it might possibly be a cataclysmic variable.
-
3.
Forty-eight blue straggler candidates are identified in the cluster on the basis of a (, ) color-magnitude diagram; the BSS classification for some of these is tentative. The specific frequency of BSS in M30, , is in the inner 10″ and over the full WFPC2 image (). The central BSS specific frequency in M30 is the highest measured for any globular cluster to date. The BSSs are strongly centrally concentrated relative to other evolved stars ( significance). The observed M30 BSS luminosity function is compared to theoretical predictions: although the number of BSS is too small to draw definite conclusions, the collisional formation model seems to be a better match to the data than the primordial binary merger model.
-
4.
The abundance of bright red giant branch stars and asymptotic giant branch stars with (relative to fainter RGB stars and subgiants) appear to be a factor of 2–3 lower in the central 15″ of M30 compared to further out in the cluster (2–2.5 effect). Horizontal branch stars, the evolutionary descendants of bright RGB stars, show no significant central depletion relative to the distribution of faint RGB stars and subgiants.
-
5.
The color of the integrated cluster light in M30 varies from 0.82 around to 0.45 within , a radial color gradient of mag/dex. The central deficiency of bright red giant/asymptotic giant branch stars is responsible for about a third of the color gradient; all evolved stellar populations taken together (RGB, AGB, HB, BSS, subgiants) are responsible for about half of the overall color gradient. Mass segregation of faint red main sequence stars results in a smooth color gradient of about 0.15 mag/dex, corresponding to half the observed gradient.
-
6.
The -band surface brightness profile of the integrated starlight in M30 has a power law slope of in the inner 10″, and the slope is for the light of faint RGB stars alone; the latter is identical to the number-weighted measure of the projected density profile slope found in Paper IV . The difference between the central slopes of the overall vs faint RGB light is a result of the central depletion of bright RGB stars. The integrated surface brightness profile slope steepens to for . Main sequence stars contribute nearly 40%, bright RGB/AGB/HB stars with contribute 30%, and faint RGB stars contribute about 30% of the overall cluster brightness in the central of M30; the corresponding fractions are 50%, 40%, and 10% at larger radii ().
-
7.
The stellar luminosity function in the inner of M30 shows an anomalously high abundance of red giants (relative to subgiant, main sequence turnoff, and main sequence stars), as has been previously noted further out in the cluster. Giants with in M30 are overabundant by 30% (3.8 significance) relative to the prediction of suitably normalized standard stellar evolution models.
Acknowledgements.
We would like to thank Mike Bolte, Karl Gebhardt, Josh Grindlay, Marc Pinsonneault, and Eric Sandquist for useful suggestions. This project was supported in part by an Alfred P. Sloan Foundation fellowship (PG), in part by a National Science Foundation Graduate Fellowship (ZTW), and in part by NASA through Grant No. NAG5-1618 from the Space Telescope Science Institute, which is operated by the Association of Universities for Research in Astronomy, Inc., under NASA Contract No. NAS5-26555.Appendix: Table of Stellar Photometry and Positions
The complete version of Table 3 contains (Johnson) -, -, -band photometry for 9507 stars with in the central 5.1 arcmin2 of M30 () covered by the HST WFPC2 image, and and for an additional 433 stars that were not matched in the band; a subset containing the 40 brightest stars within of M30’s center is presented in the paper. A computer-readable version of the complete table is available in the electronic edition of the Journal by link to a permanent database. It may also be obtained via anonymous ftp as follows:
-
ftp eku.sns.ias.edu (login as: anonymous)
-
cd pub/GLOBULAR_CLUSTERS/m30-ppr7
-
get m30fulltab1.txt
or by contacting P.G..
Details of the photometric procedure, a description of the astrometric convention, and estimates of the completeness and photometric accuracy may be found in Sec. 2.2, 2.3, and 2.4, respectively. We recommend that the astrometry in Table 3 be matched empirically against other data sets to correct for possible systematic errors in the scale, translation, and rotation of the coordinate system we have adopted.
References
- Bahcall & Soneira (1980) Bahcall, J. N., & Soneira, R. M. 1980, ApJS, 44, 73.
- Bailyn & Pinsonneault (1995) Bailyn, C., & Pinsonneault, M. 1995, ApJ, 439, 705.
- Bergbusch & VandenBerg (1992) Bergbusch P., & VandenBerg, D. A. 1992, ApJS, 81, 163.
- Bolte (1989) Bolte, M. 1989, ApJ, 341, 168.
- Bolte (1994) Bolte, M., 1994, ApJ, 431, 223.
- Bolte et al. (1993) Bolte, M., Hesser, J. E., & Stetson, P. B. 1993, ApJ, 408, L89.
- Burgarella & Buat (1996) Burgarella, D., & Buat, V. 1996, A&A, 313, 129.
- Burrows (1995) Burrows, C. J. (Ed.) 1995, Wide Field and Planetary Camera 2 Instrument Handbook, Version 3.0, Space Telescope Science Institute Publication.
- Burstein & Heiles (1982) Burstein, D., & Heiles, C. 1982, AJ, 87, 1165.
- Carretta & Gratton (1997) Carretta, E., & Gratton, R. G. 1997, A&AS, 121, 95, astro-ph/9607078.
- Chun & Freeman (1979) Chun, M. S., & Freeman, K. C. 1979, ApJ, 227, 93.
- Cohen et al. (1997) Cohen, R. L., Guhathakurta, P., Yanny, B., Schneider, D. P., & Bahcall, J. N. 1997, AJ, 113, 669 (Paper VI), astro-ph/9611151.
- Cordoni & Aurière (1984) Cordoni, J.-P., & Aurière, M. 1984, A&AS, 58, 559.
- D’Antona et al. (1995) D’Antona, F., Vietri, M., & Pesce, E. 1995, MNRAS, 272, 730.
- Dickens (1972) Dickens, R. J. 1972, MNRAS, 157, 299.
- Djorgovski (1993) Djorgovski, S. G. 1993 in Structure and Dynamics of Globular Clusters, ed. S. G. Djorgovski & G. Meylan (San Francisco: ASP Conf. Series, No. 50), 373.
- Djorgovski & Piotto (1993) Djorgovski, S. G., & Piotto, G. 1993, in Structure and Dynamics of Globular Clusters, ed. S. G. Djorgovski & G. Meylan (San Francisco: ASP Conf. Series, No. 50), 203.
- Djorgovski et al. (1991) Djorgovski, S. G., Piotto, G.. Phinney, E. S., & Chernoff, D. F. 1991, ApJ, 372, L41.
- Ferraro et al. (1993) Ferraro, F. R., Fusi Pecci, F., Cacciari, C., Corsi, C., Buonanno, R., Fahlman, G. G., & Richer, H. B. 1993, AJ, 106, 2324.
- Gilmozzi et al. (1994) Gilmozzi, R., Ewald, S. P., & Kinney, E. K. 1994, The Geometric Distortion Correction for the WFPC Cameras, WFPC2 Instrument Science Report 95-02.
- Gratton et al. (1997) Gratton, R. G., Fusi Pecci, F., Carretta, E., Clementini, G., Corsi, C. E., & Lattanzi, M. 1997, ApJ, 491, 749.
- Guhathakurta et al. (1992) Guhathakurta, P., Yanny, B., Schneider, D. P., & Bahcall, J. N. 1992, AJ, 104, 1790 (Paper I).
- Guhathakurta et al. (1996) Guhathakurta, P., Yanny, B., Schneider, D. P., & Bahcall, J. N. 1996, AJ, 111, 267 (Paper V), astro-ph/9512015.
- Holtzman et al. (1995a) Holtzman, J. A., Burrows, C. J., Casertano, S., Hester, J. J., Trauger, J. T., Watson, A. M., & Worthey, G. 1995b, PASP, 107, 1065.
- (25) Holtzman, J. A., Hester, J. J., Casertano, S., Trauger, J. T., Watson, A. M., Ballester, G. E., Burrows, C. J., Clarke, J. T., Crisp, D., Evans, R. W., Gallagher, J. S., III, Griffiths, R. E., Hoessel, J. G., Matthews, L. D., Mould, J. R., Scowen, P. A., Stapelfeldt, K. R., & Westphal, J. A. 1995a, PASP, 107, 156.
- Hut et al. (1992) Hut, P., McMillan, S. L. W., Goodman, J. J., Mateo, M., Phinney, E. S., Pryor, C., Richer, H. B., Verbunt, F., & Weinberg, M. D. 1992, PASP, 104, 981.
- King (1962) King, I. R. 1962, AJ, 67, 471.
- King (1991) King, I. R. 1991, in The First Year of HST Observations, ed. A. L. Kinney & J. C. Blades (Space Telescope Science Institute Publication), 6.
- Kraft (1994) Kraft, R. P. 1994, PASP, 106, 553.
- Langer et al. (1998) Langer, G. E., Bolte, M., & Sandquist, E. L. 1998, ApJ, in preparation.
- Larson et al. (1995) Larson, A. M., VandenBerg, D. A., & De Propris, R. 1995, BAAS, 27, 1431.
- Meylan & Heggie (1997) Meylan, G., & Heggie, D. C. 1997, Astron. Astrophys. Rev., 8, 1, astro-ph/9610076.
- Peterson (1986) Peterson, C. J. 1986, PASP, 98, 192
- Piotto et al. (1997) Piotto, G., Cool A. M., & King, I. R. 1997, AJ, 113, 1345, astro-ph/9701153.
- Piotto et al. (1988) Piotto, G., King, I. R., & Djorgovski, S. 1988, AJ, 96, 1918.
- Pont et al. (1998) Pont, F., Mayor, M., Turon, C., & VandenBerg, D. A. 1998, A&A, 329, 87.
- Pryor et al. (1986) Pryor, C., Smith, G. H., & McClure, R. D. 1986, AJ, 347, 251.
- Ratnatunga & Bahcall (1985) Ratnatunga, K. U., & Bahcall, J. N. 1985, ApJS, 59, 63.
- Refsdal & Weigart (1970) Refsdal, S., & Weigart, A. 1970, A&A, 6, 426.
- Reid (1997) Reid, I. N. 1997, AJ, 114, 161.
- Richer et al. (1988) Richer, H. B., Fahlman, G. G., & VandenBerg, D. A. 1988, ApJ, 329, 187.
- Salpeter (1955) Salpeter, E. E. 1955, ApJ, 121, 161.
- Sandquist et al. (1998) Sandquist, E. L., Bolte, M., Langer, G. E., & Hesser, J. E. 1998, ApJ, in preparation.
- Sandquist et al. (1996) Sandquist, E. L., Bolte, M., Stetson, P. B., & Hesser, J. E. 1996, ApJ, 470, 910.
- Sosin (1997) Sosin, C. 1997, AJ, 114, 1517, astro-ph/9707251.
- Sosin & King (1995) Sosin, C., & King, I. R. 1995, AJ, 109, 639, astro-ph/9701030.
- Stetson (1992) Stetson, P. B. 1992, in Astronomical Data Analysis Software, ed. D. M. Worrall, C. Biemesderfer, & J. Barnes (San Francisco: ASP Conf. Series, No. 25), 297.
- Stetson (1987) Stetson, P. B. 1987, PASP, 99, 191.
- Sweigart (1997) Sweigart, A. V. 1997, ApJ, 474, L23.
- Taam & Lin (1992) Taam, R. E., & Lin, D. N. C. 1992, ApJ, 390, 440.
- Trauger et al. (1994) Trauger, J. T., Ballester, G. E., Burrows, C. J., Casertano, S., Clarke, J. T., Crisp, D., Evans, R. W., Gallagher, J. S., III, Griffiths, R. E., Hester, J. J., Hoessel, J. G., Holtzman, J. A., Krist, J. E., Mould, J. R., Scowen, P. A., Stapelfeldt, K. R., Watson, A. M., & Westphal, J. A. 1994 ApJ, 435, L3.
- VandenBerg et al. (1998) VandenBerg, D. A., Larson, A. M., & De Propris, R. 1998, PASP, 110, 98.
- Williams & Bahcall (1979) Williams, T., & Bahcall, J. N. 1979, AJ, 232, 754.
- (54) Yanny, B., Guhathakurta, P., Bahcall, J. N., & Schneider, D. P. 1994a, AJ, 107, 1745 (Paper II).
- (55) Yanny, B., Guhathakurta, P., Schneider, D. P., & Bahcall, J. N. 1994b, ApJ, 435, L59 (Paper IV).
- Zaggia et al. (1992) Zaggia, S. R., Capaccioli, M., Piotto, G., & Stiavelli, M. 1992, A&A, 258, 302.
- Zinn (1980) Zinn, R. 1980, ApJS, 42, 19.
- Zinn (1985) Zinn, R. 1985, ApJ, 293, 424.
- Zinn & West (1984) Zinn, R., & West, M. J. 1984, ApJS, 55, 45.