email: diana@carina.astro.helsinki.fi 22institutetext: School of Physics, University of Sydney, NSW 2006, Australia 33institutetext: School of Physics, Australian Defence Force Academy, Canberra, ACT 2600, Australia
MOST Radio Monitoring of GX 3394
Abstract
The Molonglo Observatory Synthesis Telescope (MOST) has been monitoring the candidate Galactic black hole binary system GX 339$-$4 at 843 MHz since 1994 April. We present the results of this program up to 1997 February and show a possible correlation between radio and X-ray light curves.
Key Words.:
binaries; stars:individual:GX 33941 Introduction
The low mass X-ray binary GX 3394 was discovered by the OSO-7 satellite in 1973 (Markert et al. (1973)). It has been classified as a black hole candidate primarily because of the similarity of its X-ray emission to that of the canonical black hole system Cyg X-1 (bimodal X-ray states: high/soft and low/hard) and because of rapid variability in its X-ray and optical emission (e.g., Makishima et al. (1986); Miyamoto et al. (1992); Nowak (1995)).
GX 3394 exhibits four distinct X-ray states, three of which were initially identified by Markert et al. (1973): high, low and off. The high state is characterized by an extremely soft spectrum ( = 1–2 keV) accompanied by a hard power-law tail, the low state is described by a single power-law hard spectrum, and the off state is in fact a very weak hard state (Motch et al. (1985)). Recently an intermediate state between the low and the high states has been reported (Mendez & van der Klis (1997)).
The optical counterpart was identified as an 18 mag star (Doxsey et al. (1979); Cowley et al. (1991)) which was found to be highly variable, with ranging from 15.4 to 20. Photometric data revealed a 14.8 hour modulation which has been attributed to the orbital period (Callanan et al. (1992)). Emission from the accretion disk has dominated the spectra making it difficult to obtain a definitive estimate for the mass of the compact object (Cowley et al. (1987)). Distance estimates vary from 1.3 kpc (Predehl et al. (1991)) to 4 kpc (Makishima et al. (1986)).
Simultaneous optical and X-ray observations have shown quasi-periodic oscillations (QPOs) at mean periods of 10 s and 20 s (Motch et al. (1983)) in the X-ray low state (see Tanaka & Lewin (1995) and references therein). The relationship between optical and X-ray fluxes is not well understood. For example, in 1981 Motch et al. (1983) found anticorrelation between the 1–13 keV X-ray and optical fluxes, but correlation between the 13–20 keV X-ray and optical.
The discovery of a variable radio counterpart (Sood & Campbell-Wilson (1994)) initiated the monitoring program at 843 MHz undertaken with the Molonglo Observatory Synthesis Telescope (MOST) which is the subject of this paper. Fender et al. (1997) observed GX 3394 at high resolution in 1996 July with the Australia Telescope Compact Array (ATCA) at a wavelength of 3.5 cm and reported the detection of a jet-like extension to the west of the source. Subsequent observations in 1997 February failed to confirm this extension (Corbel et al. (1997)). Both Fender et al. (1997) and Corbel et al. (1997) report a flat or inverted radio spectrum.
| Sequence | Date | Nsamp | TJD | S843 | |
|---|---|---|---|---|---|
| number | (mid-obs.) | (mJy) | |||
| 1659483∗ | 94/04/25 | 1796 | 49498.123 | 9.81 | 0.70 |
| 1659484 | 94/06/01 | 898 | 49504.976 | 6.04 | 0.99 |
| 1659481 | 94/06/02 | 690 | 49506.003 | 7.87 | 0.97 |
| 1659482 | 94/06/03 | 1795 | 49507.097 | 6.93 | 0.75 |
| 1659485 | 94/10/04 | 1019 | 49629.867 | 7.08 | 1.36 |
| 1659486 | 94/10/17 | 1101 | 49642.821 | 6.24 | 1.19 |
| 16594810 | 95/04/30 | 1101 | 49837.281 | 2.0a | — |
| 16594811∗ | 95/06/02 | 1151 | 49871.099 | 5.26 | 0.66 |
| 16594815 | 95/08/25 | 1796 | 49954.983 | 4.22 | 0.68 |
| 16594813 | 95/10/14 | 981 | 50004.734 | 3.11 | 0.65 |
| 16594816 | 96/03/15 | 1796 | 50158.313 | 3.21 | 0.72 |
| 16594819∗ | 96/03/31 | 1796 | 50174.269 | 2.22 | 0.67 |
| 16594820∗ | 96/04/06 | 1796 | 50180.253 | 2.98 | 0.65 |
| 16594821 | 96/04/19 | 1796 | 50193.217 | 2.47 | 0.71 |
| 16594822 | 96/04/30 | 898 | 50204.187 | 2.0a | — |
| 16594823 | 96/05/08 | 1796 | 50212.166 | 2.00 | 0.70 |
| 16594824 | 96/05/17 | 1796 | 50221.141 | 2.47 | 0.65 |
| 16594825∗ | 96/05/20 | 1795 | 50224.133 | 2.31 | 0.60 |
| 16594826 | 96/05/24 | 1796 | 50228.122 | 2.28 | 0.66 |
| 16594827 | 96/06/07 | 1617 | 50242.108 | 1.9a | — |
| 16594828 | 96/06/13 | 1796 | 50248.067 | 1.9a | — |
| 16594829 | 96/06/23 | 1791 | 50258.040 | 1.76 | 0.59 |
| 16594830∗ | 96/07/13 | 1791 | 50277.985 | 6.47 | 0.58 |
| 16594831 | 96/07/28 | 1796 | 50292.944 | 6.70 | 0.68 |
| 16594832∗ | 96/08/06 | 1796 | 50301.920 | 6.02 | 0.56 |
| 16594833 | 96/08/24 | 1619 | 50319.896 | 3.46 | 0.66 |
| 16594834∗ | 96/09/15 | 1796 | 50341.810 | 3.47 | 0.65 |
| 16594836∗ | 97/02/04 | 1795 | 50483.423 | 7.04 | 0.66 |
| 16594837∗ | 97/02/11 | 1794 | 50490.404 | 6.25 | 0.65 |
| 16594838∗ | 97/02/18 | 1795 | 50497.385 | 6.14 | 0.71 |
-
a
3 upper limit.
-
∗
Co-added to form image in Fig. 1.
2 Observations and Data Reduction
The field of GX 3394 was imaged by MOST at 843 MHz at irregular intervals from 1994 April to 1997 February. The journal of observations is given in Table 1. In order to maximise sensitivity we observed in non-multiplexed mode (Robertson (1991)), giving a field size of 23′31′ and a synthesized beam of 43″()57″() at the declination of GX 3394. Most observations were full 12-hour syntheses (1796 24-s data samples) but several shorter integrations were found to be acceptable for estimating flux densities. Editing of the raw data was necessary to remove terrestrial interference. For completeness we list the final number of data samples (Nsamp) in Table 1.
A CLEANed and self-calibrated image was formed from each synthesis observation using standard procedures (Cram & Ye (1995)). Position and flux density calibration was based on short scans of a number of strong unresolved sources before and after each synthesis observation of GX 3394. Experience has shown that this procedure is correct to 1′′ in position and 5% rms in flux density (Hunstead (1991)).
The AIPS task imfit was used to fit a gaussian to each image at the known position of GX 3394. In a few cases where imfit failed to converge (sequence numbers 16594810, 16594813, 16594822, 16594823, 16594828, 16594829) because of a marginal detection, we used the task tvstat to measure the flux density. By integrating over two concentric regions centred on GX 3394 we were able to correct for non-zero or sloping backgrounds.

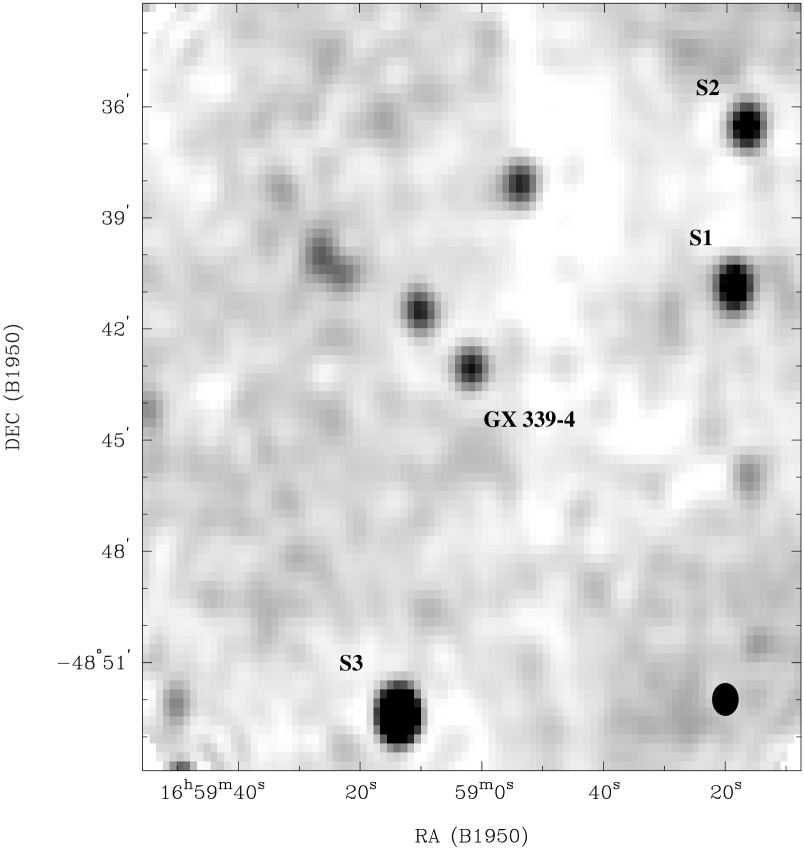
In order to minimise systematic errors we then refined the flux calibration by using imfit to measure peak flux densities for three reference sources S1, S2 and S3 (Fig. 1) in the field of GX 3394. All three were found to be unresolved, and to show the same trends with epoch, so we adopted the summed flux density for scaling the flux density of GX 3394, on the assumption that the MOST calibration was correct on average over the monitoring period. The rms scatter of the correction factors was 5.2%, consistent with expectation.
The rms noise level in the vicinity of GX 3394 was estimated from the statistics of regions 500 pixels to the south and west of GX 3394. We have adopted the mean rms noise level (in mJy/beam) as the flux density error for each epoch, and for setting a limit for the non-detections.
The final corrected flux densities and adopted errors are tabulated in Table 1, while Table 2 gives the imfit positions and flux densities of the three reference sources. The truncated Julian date (TJD) is defined here as and specified at mid-observation. Note the fall in rms noise between 1994 and 1995, resulting from the installation of new pre-amplifiers as part of the hardware upgrade of MOST.
Figure 1 shows a deep image of the field of GX 3394 obtained by co-adding selected images from the full dataset (see Table 1). The background noise level of 0.3 mJy/beam rms includes contributions from weak sources, low level Galactic emission and telescope artifacts. There is no evidence for any prominent extended radio emission which might be associated with GX 3394, in contrast to a similar montage of the field around GRO J1655$-$40, comprising images taken before, during and after the weak May-June 1996 outburst (Hunstead et al. (1997)).
| (B1950.0) | (B1950.0) | ||
|---|---|---|---|
| (h m s s ) | ( ° ′ ″ ″) | (mJy) | |
| S1 | 16 58 18.62 0.14 | 48 40 50.6 0.9 | 9.1 0.3 |
| S2 | 16 58 16.64 0.18 | 48 36 30.6 1.3 | 8.0 0.4 |
| S3 | 16 59 13.64 0.09 | 48 52 26.5 0.6 | 28.5 0.6 |
3 Comparison with X-rays
A relationship between hard X-ray and radio behaviour has been established, though not well understood, for the two well-known superluminal radio-jet X-ray binaries GRS 1915+105 and GRO J165540, and between soft (1–6 keV) X-ray and radio emission for Cyg X-3, also known to exhibit milliarcsecond radio jets (Spencer et al. (1986)). In GRO J165540, the radio outbursts appeared to follow flaring episodes in the hard (20–400 keV) X-ray emission with a delay that varied from a few days to two weeks (Harmon et al. 1995). On the other hand, GRS 1915+105 exhibits correlated hard (20–100 keV) X-ray and radio emission (Foster et al. (1996)), with a clear but complex association between the soft (2–10 keV) X-ray and radio (15 GHz) emission (Pooley & Fender (1997)). Watanabe et al. (1994) report that radio outbursts from Cyg X-3 occur only when it is in the X-ray high state, i.e. the mean soft X-ray flux is greater than usual. McCollough et al. (1997) show that during the quiescent radio state, the hard X-ray (20–100 keV) flux of Cyg X-3 anticorrelates with the radio (15 GHz) flux, whereas during radio flaring states the fluxes are sometimes correlated. In addition, a clear correlation between soft X-ray and 15 GHz radio emission has recently been revealed, e.g. Fender et al. (1998). Therefore, while there are obvious connections between radio and X-ray emission from black-hole candidates, no uniform pattern of behaviour has so far emerged.
Figure 2 shows the final calibrated MOST light curve, together with the RXTE/ASM111http://space.mit.edu/XTE/ and BATSE222http://cossc.gsfc.nasa.gov/cossc/batse/hilev/GX339_4/ (C. Robinson, priv. comm.) light curves. For clarity the X-ray light curves have been resampled into 4-day bins for XTE and 6-day bins for BATSE, using the IDL command rebin. Contrary to previous results (e.g., Sood et al. (1997) and references therein), we find a possible positive correlation between the X-ray and radio emission.

Figure 3 is an overlaid plot of the radio and soft X-ray light curves covering the best sampled overlap region (1996 May–Sep). Unfortunately, there was no radio coverage during the rapid rise in the soft X-ray flux (beginning TJD 50270), so we cannot pinpoint the exact time of the increase in the radio flux density. However, it is interesting to note that the radio light curve tracks the X-ray curve quite closely, both before the small flaring episode and during the maximum and decline.
Figure 4 shows flux–flux plots of the MOST and X-ray light curves spanning the time interval from 1996 March to 1997 February. The X-ray datasets were averaged or interpolated to the mean epochs of the MOST observations, and a simple linear fit was applied. The resulting goodness-of-fit (15 d.o.f.) was 0.41 for the MOST/RXTE fit and 0.99 for MOST/BATSE. The Spearman rank correlation () was computed for the two radio–X-ray datasets using IDL’s r_correlate. For the MOST and RXTE data, is 0.82 and the two-sided significance of the deviation from zero is . The corresponding values for the MOST and BATSE data are 0.82 and 4.9. These results indicate that radio correlates well with both hard and soft X-ray intensities over a time interval of nearly 1 year. In addition, given the limitations of the radio sampling, there appears to be no evidence for a radio–X-ray time delay for the event near TJD 50290. On the other hand, it is obvious that the first four MOST points (TJD 49500) do not correlate with BATSE so there are clearly other factors affecting the radio output at that time. One possibility is we are witnessing the decay of a much bigger radio event that may have been associated with an earlier BATSE outburst at TJD 49400.

The fact that the ATCA 3.5 cm observation (Fender et al. (1997)), at TJD 50276.79, was made just after the rapid rise in RXTE flux (Fig. 3) encourages speculation as to the possible origin of the reported radio ‘jet’. On the one hand it may be a real feature linked directly to the X-ray and radio increase, while on the other it may be an artifact introduced by phase errors in the telescope or changes in source flux density. The latter effect has indeed been seen in a MOST observation obtained on 1997 July 22 in which an apparent elongation of the image was clearly due to a variation in the flux density of GX 3394 within the 12-hour integration period.
During the 1998 January high state transition observed by RXTE, beginning at TJD 50820, both the MOST and BATSE fluxes fell to zero (R. Fender, priv. comm.). This is very similar to the behaviour observed in Cyg X-1, where transitions to the X-ray high (soft) state are accompanied by a corresponding decrease in the radio flux density (Tananbaum et al. (1972); Braes & Miley (1976)), presumably related to changes in the state of the accretion disk. Furthermore, in the low state the X-ray and radio fluxes of Cyg X-1 are roughly correlated (Pooley et al. 1998, in prep.), as they appear to be in GX 3394.
Acknowledgements.
We thank Barbara Piestrzynski for assistance with the MOST data reduction, Craig Robinson for kindly providing pre-release BATSE data, and Rob Fender for valuable discussions during the drafting of the paper. MOST is operated by the University of Sydney and funded by grants from the Australian Research Council. DH was funded by a grant from the Vilho, Yrjö & Kalle Väisälä Rahasto, and thanks the Astrophysics Department of the University of Sydney for financial assistance and hospitality during her visit.References
- Braes & Miley (1976) Braes L.L.E., Miley G.K., 1976, Nat 264, 731
- Callanan et al. (1992) Callanan P.J., Charles P.A., Honey W.B., Thorstensen J.R., 1992, MNRAS 259, 395
- Corbel et al. (1997) Corbel S., Fender R.P., Durouchoux P., et al., 1997, in Proc. 4th Compton Symposium, eds. C.D. Dermer, M.S. Strickman, and J.D. Kurfess, New York:AIP, p. 937
- Cowley et al. (1987) Cowley A., Crampton D., Hutchings J.B., 1987, AJ 93, 195
- Cowley et al. (1991) Cowley A.P., Schmidtke P.C., Crampton D., Hutchings J.B., Bolte M., 1991, ApJ 373, 228
- Cram & Ye (1995) Cram L., Ye T., 1995, Aust. J. Phys. 48, 113
- Doxsey et al. (1979) Doxsey R., Bradt H., Johnston M., et al., 1979, ApJ 228, L67
- Fender et al. (1997) Fender R.P., Spencer R.E., Newell S.J., Tzioumis A.K., 1997, MNRAS 286, L29
- Fender et al. (1998) Fender R.P., Hanson M.M., Pooley G.G., 1998, MNRAS, submitted
- Foster et al. (1996) Foster R.S., Waltman E.B., Tavani M., et al., 1996, ApJ 467, L81
- Harmon et al. (1995) Harmon B.A., Wilson C.A., Zhang S.N., et al., 1995, Nat 374, 703
- Hunstead (1991) Hunstead R.W., 1991, Aust. J. Phys. 44, 743
- Hunstead et al. (1997) Hunstead R.W., Wu K., Campbell-Wilson, D., 1997, in Accretion Phenomena and Related Outflows, IAU Colloq. 163, eds. D.T. Wickramasinghe, L. Ferrario & G. Bicknell, ASP Conf. Ser. 121, 63.
- Makishima et al. (1986) Makishima K., Maejima Y., Mitsuda K., et al., 1986, ApJ 308, 635
- Markert et al. (1973) Markert T.H., Canizares C.R., Clark G.W., et al., 1973, ApJ 184, L67
- McCollough et al. (1997) McCollough M.L., Robinson C.R., Zhang S.N., et al., 1997, in Proc. 4th Compton Symposium, eds. C.D. Dermer, M.S. Strickman & J.D. Kurfess, New York:AIP, p. 813
- Mendez & van der Klis (1997) Mendez M., van der Klis M., 1997, ApJ 479, 926
- Miyamoto et al. (1992) Miyamoto S., Kitamoto S., Iga S., Negoro H., Terada K., 1992, ApJ 391, L21
- Motch et al. (1983) Motch C., Ricketts M.J., Page C.G., Ilovaisky S., Chevalier C., 1983, A&A 119, 171
- Motch et al. (1985) Motch C., Ilovaisky S., Chevalier C., Angebault P., 1985, Space Sci. Rev. 40, 219
- Nowak (1995) Nowak M.A., 1995, PASP 107, 1207
- Pooley & Fender (1997) Pooley G.G., Fender R.P., 1997, MNRAS 292, 925
- Predehl et al. (1991) Predehl P., Braeuninger H., Burkert W., Schmitt, J.H.M.M., 1991, A&A 246, L40
- Robertson (1991) Robertson J.G., 1991, Aust. J. Phys. 44, 729
- Sood & Campbell-Wilson (1994) Sood R., Campbell-Wilson D., 1994, IAU Circ. 6006
- Sood et al. (1997) Sood R., Durouchoux P., Campbell-Wilson D., Vilhu O., Wallyn P., 1997, in Proc. 2nd INTEGRAL Workshop, The Transparent Universe, eds. C. Winkler, T. Courvoisier & P. Durouchoux, ESA-SP382, p. 201
- Spencer et al. (1986) Spencer R., Swinney R.W., Johnston K.J., Hjellming R.M., 1986, ApJ 309, 694
- Tanaka & Lewin (1995) Tanaka Y., Lewin W.H.G., 1995, in X-Ray Binaries, eds. W.H.G. Lewin et al., CUP, p. 126
- Tananbaum et al. (1972) Tananbaum H., Gursky H., Kellogg E., Giacconi R., Jones C., 1972, ApJ 177, L5
- Watanabe et al. (1994) Watanabe H., Kitamoto S., Miyamoto S., et al., 1994, ApJ 433, 350