The Sloan Digital Sky Survey
Abstract
The Sloan Digital Sky Survey is an ambitious, multi-institutional project to create a huge digital imaging and spectroscopic data bank of 25% of the celestial sphere, approximately 10,000 deg2 centred on the north galactic polar cap. The photometric atlas will be in 5 specially-chosen colours, covering the ster of the Survey area to a limiting magnitude of 23.1, on pixels, resulting in a 1 Tpixel map. This data base will be automatically analysed to catalogue the photometric and astrometric properties of stellar images, galaxies, and colour-selected QSO candidates; the galaxy data will in addition include detailed morphological data. The photometric data are used to autonomously and homogeneously select objects for the spectroscopic survey, which will include spectra of galaxies, QSOs, and unusual stars. Although the project was originally motivated by the desire to study Large Scale Structure, we anticipate that these data will impact virtually every field of astronomy, from Earth-crossing asteroids to QSOs at . In particular, the TByte multi-colour, precision calibrated imaging archive should be a world resource for many decades of the next century.
1 Introduction
The Sloan Digital Sky Survey (SDSS) is arguably the most ambitious digital data base of the celestial sphere yet undertaken. It employs a special purpose 2.5m telescope, an unusually large camera, and a pair of multi-fibre spectrographs, located on Apache Point, New Mexico. Construction of all hardware and most of the software is now complete, and observations of numerous primary and secondary standard stars to underlie the specialised photometric system are underway. First light on the unique mosaic camera, the most complex astronomical imaging instrument yet constructed, occurred in May 1998. After a commissioning period of 6–12 months, we hope to be obtaining ‘survey-quality’ data, and it should require 5–6 years thereafter to complete the entire effort.
The title of the Survey commemorates the generous financial support of the Alfred P. Sloan Foundation, a philanthropic foundation located in New York. To date considerable additional financial support has been provided by the U. S. Department of Energy, the Japanese Participation Group, the member universities, the U. S. Naval Observatory, and the U.S. National Science Foundation.
Participants in the construction and data-taking phases of the SDSS are from a dozen institutions listed in the cover page footnote. The umbrella organisation to execute this project is the Astrophysical Research Consortium (ARC), a non-profit corporation of 7 U. S. educational institutions incorporated in 1984 to construct and operate astronomical facilities for its members. ARC also operates a 3.5m general purpose telescope on the same site at Apache Point. Although not all ARC member institutions participate in both SDSS and the 3.5m projects, the synergy of the two telescopes is clear, as the 3.5m can spectroscopically reach essentially every object imaged by SDSS, while the SDSS spectra cover only the brightest tip of the SDSS imaging archive.
Some excellent and only slightly dated review articles on SDSS have been presented by Gunn & Knapp (1993), Gunn & Weinberg (1995), and Fukugita (1998), and a summary suitable for the general public may be found in Knapp (1997). Here I will concentrate on an overview of the concepts of the Survey and the unique contributions which we believe it will make to astronomy in general and Large Scale Structure (LSS) in particular. However a recurring theme of this paper will be that LSS is only a small fraction of the total scientific import of SDSS.
2 Concept and Approach
2.1 Scientific Goals
As noted above, the SDSS is actually two surveys, one photometric and the other spectroscopic. Although objects for the spectroscopic survey are autonomously and homogeneously selected from the photometric data, both of these data bases serve multiple purposes. The imaging data base may broadly be said to serve four functions:
automated, homogeneous, and quantifiable target selection and astrometry for the spectroscopic survey, based on colour and morphology of images that meet pre-selected criteria for a multitude of different scientific projects
photometric redshifts, accurate to .05, will be available for galaxies, by virtue of the carefully selected 5 colour bands of the Survey
a discovery catalogue of QSO candidates, virtually unbiased by redshift, and with high purity; % of these objects should prove to be actual QSOs when verified spectroscopically, although we intend to obtain spectra of ‘only’ of them
and, at least in my personal view, most important of all,
a permanent, public, well-calibrated archive of stellar objects and galaxies, including 5-colour photometric, astrometric, and morphological data for each entry
The spectroscopic database is likewise multifunctional, including:
homogeneous galaxy spectra from an exceptionally-well characterised sample, for LSS as well as other studies
homogeneous QSO spectra, which should span (if there are any objects at !) with minimal bias in
unusual stellar objects, selected autonomously for spectroscopy due to their abnormal position in 5-colour space with respect to the normal stellar locus
The imaging and spectroscopic observations are interleaved during the 5 year survey; at least in principle spectroscopy can occur in the next lunar cycle following the imaging of the target field. This protocol takes best advantage of changing sky and Moon conditions, especially given the disparate exposure times for imaging vs. spectroscopy, and significantly shortens the total duration of the Survey. It does however place severe demands on the complex software pipeline that acquires the data, performs image recognition, classification, astrometry, and precision, calibrated photometry, followed by target selection for a myriad of different scientific projects. This large system must work not only reliably but rapidly on a huge volume of data, if the insatiable demand for new spectroscopic targets, sometimes as many as 6,000 per night, is to be continually satisfied on only a few weeks of lead time.
2.2 Hardware
The hardware to complete the Survey is as unique as the scientific goals. The alt-az telescope is a special purpose, wide-field instrument, of 2.5m aperture, designed and optimised specifically for this task, although much of its heritage may be traced back to the ARC 3.5m. Both instruments are located on Apache Point, New Mexico, a 2,780m peak located 2 km from Sunspot, New Mexico, the site of the National Solar Observatory. Although the telescope is of conventional Cassegrain design, the 1.1m secondary mirror yields an unusual field of view at the f/5 focus where both imaging and spectroscopy are conducted; the plate scale there is arcsec-1. The large focal plane is nearly a Mercator projection of the sky, and the optics deliver excellent images from over this very large field. The telescope, primary, and secondary optics were fabricated by L&F Industries, University of Arizona Optical Sciences Center, and Steward Observatory Mirror Laboratory, respectively, under contract to the University of Washington.
The enclosure design by M3 Engineering is also unconventional, in that to minimise both equilibration times with the environment and building-induced seeing degradation, the small building which covers the telescope during the daytime and in inclement weather is retracted on rails during observations, leaving the telescope entirely exposed during data acquisition. The telescope is then protected from wind-shake by a baffle which cocoons it, and corotates but does not touch the instrument. This fast (f/2.2 at primary) telescope is quite small and thus stiff in any case. A second dedicated telescope of 0.5m aperture, used for exhaustive absolute photometric calibration each night, is located nearby.
The heart of the hardware, and perhaps its most technically ambitious component, is the photometric camera (Gunn et al. 1998). Despite recent and rapid advances in the technology of charge-coupled devices, it is a daunting task to cover the physically very large focal plane (650 mm) with detectors; yet only with the large field can one hope to cover the deg2 desired for the Survey in a reasonable time interval. The camera thus contains 30 CCDs each of 24 pixels, yielding a respectable scale on the sky of pixel-1. At our desired limiting magnitudes and high galactic latitudes of the Survey region (chosen in part to avoid large uncertainties of extinction corrections), source confusion is thus not a major problem. The CCDs, tilted to best map out the large focal plane, are housed in six separate and almost contiguous dewars, each containing five chips, one for each of the five colour bands of the Survey. In normal Survey operations, imaging data are acquired via TDI (Time Delay and Integrate) mode, with charge continually clocked down the chips and read out at the same rate that the sky drifts past the focal plane. The effective integration time on any given point on the celestial sphere is 55 sec, which yields reasonably faint limiting magnitudes (e.g., ) with a 2.5m telescope and these highly efficient detectors. An alternative ‘staring’ mode to obtain images would entail very substantial inefficiencies due to the dead times while the 108 pixels in the focal plane are read out. The camera also includes on its perimeter 22 additional pixel CCDs of lesser sensitivity, to observe transits of brighter stars without saturation, and thus provides excellent astrometric solutions for the fainter data. This remarkable instrument was designed and constructed at the Princeton University Observatory, with the CCDs supplied by Scientific Imaging Technologies. In the wavelength regions where it is possible to use thinned, back-side illuminated chips with the most favourable coatings (3 of the 5 bands), the quantum efficiency of these excellent detectors is 80%.
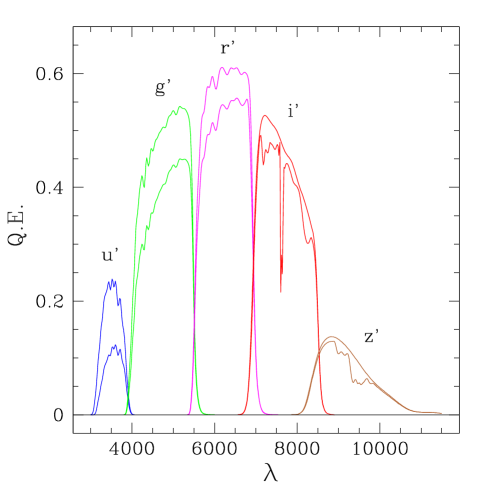
The SDSS photometric system (Fukugita et al. 1996), comprised of five largely disjoint bands centred from 3500–9500 Å, although derived from the Gunn-Thuan system, is also distinct to this project. The Survey bandpasses are shown in figure 1, and are derived from a number of constraints and compromises. The rationale to establish a new and unique photometric system should be compelling, and we believe that this is indeed the case. The SDSS bands provide wide total coverage almost from the UV-atmospheric cutoff to the near-IR silicon cutoff, are nearly uniformly logarithmically spaced in wavelength, effectively exclude the 5577 nightsky emission, and are well-suited to surprisingly accurate determination of photometric galaxy redshifts for a large range of . The band fits nicely between the atmospheric cutoff and the Balmer jump, the and bands are reasonable matches to the and plates of the new Palomar Observatory Sky Survey, and ends just shortward of the bright OH nightsky emission. The band is well-suited for discovery of objects beyond the current distance record of 5, as continuum absorption shortward of Ly then suppresses images in other of the filters, and the very strong observed Ly emission typical of high- QSOs is concentrated in just one band. Considerable early work, both theoretical (Newberg & Yanny 1997, Lenz et al. 1998) and observational (Richards et al. 1997, Newberg et al. 1997, Krisciunas et al. 1998) has already been invested in delineating the normal stellar locus, as well as the positions of a variety of interesting objects, in this photometric system, as this information is essential for efficient, autonomous selection of large numbers of unresolved images for many of the Survey’s spectroscopic programs, as well as for transformation of SDSS magnitudes to other systems.
It was clear from the inception of the project that an ambitious multi-fibre spectrograph would be needed to reach the goal of homogeneous galaxy spectra and QSOs. To the desired limiting magnitude for our LSS galaxy survey, 18.2, each 7 deg2 field contains 400–500 galaxies, and thus our design has allowed for 640 fibres per field. It should be recalled that the SDSS is not a general purpose telescope or observatory, and the spectrograph is designed for one repeated, homogeneous purpose with the very highest efficiency. Thus a basic philosophical decision was made not to employ robotic positioning of fibres, as has been popular with many recent multiobject spectrometers. We have instead opted for reasons of simplicity and reliability for what might perhaps be viewed as a step backwards in technology, namely a metal plate custom-drilled for each field by a numerically-controlled milling machine. The hole positions are derived from astrometric solutions of the SDSS imaging data, to position and retain 640 fibre optic cables. The fibres subtend on the sky, and may be spaced by as little as before mechanical interference becomes a problem. Overlapping plates will be required to achieve the desired homogeneity of the sample. The plates and fibres are packaged and positioned by a rigid cartridge assembly which will be plugged by hand in the daytime prior to observing each night; 9 identical assemblies insure that there are ample targets to fill even a long, clear winter night, given 45 minutes for a typical exposure and 15 minutes to change cartridges. At the risk of stating the obvious, such a night yields 6,000 spectra! Bookkeeping of the correspondence of a given fibre to a given hole in the aperture plate is automated, by illuminating the fibres from the spectrograph slit end, and observing the resulting pattern on the plate.
This design approach has the downside of requiring procurement of a very large number of high quality fibres, hopefully of homogeneous properties and uniformly high throughput. We have indeed succeeded at this formidable requirement, having received and tested more than 6,000 fibres with a mean throughput of 92%. The system also includes dedicated fibres for guiding and sky monitoring. The fibre system has been discussed in detail by Owen et al. (1998).
The spectrographs themselves consist of two identical modules, each receiving the light from 320 of the fibres. The fibres are spaced by at the slit entrance, slightly more than twice their diameter on the sky, so bleeding and scattered light between adjacent fibres should be very minimal. The spectra cover the 3900–9100 Å range with resolution 1800, or km s-1, comparable to the velocity dispersion of a typical galaxy observed. Each spectrograph in turn has two channels, with the red and blue light split by a dichroic optic onto pairs of 2048 CCDs with pixels, identical to the chips in the mosaic camera; the CCD electronics for the spectrographs are also identical. These instruments, designed and built at Johns Hopkins and Princeton, are very simple, with virtually no moving parts, and with a grism as the dispersing element should provide excellent throughput, %.
2.3 Data Handling and Software
Even a casual reader can appreciate that the large number of pixels in the mosaic camera imply that the final SDSS data base must be very large, but some specific values are instructive. The camera produces 8 MB sec-1 of data, which will total nearly 12 TB by the end of the deg2 survey. As the spectra are one-dimensional, that volume of raw data is ‘small,’ about 400 GB. The data are recorded on multiple tape drives, and sent each day from the Observatory by express air courier to Fermilab for routine processing and photometric calibration, using a large software package written primarily at Princeton University and Fermilab. An ‘operational’ data base is used for automated target selection for the spectroscopic programmes, while a compressed, fully calibrated ‘science data base,’ whose architecture was developed at Johns Hopkins, will be the focus of most of the analysis, both by the SDSS team and also the general astronomical community. For example, almost all of the original information is retrievable from a set of ‘atlas images,’ small regions of sky around every well-detected object (as well as interesting objects catalogued at other wavelengths but undetected in SDSS), which total about 700 GB. While the raw data directly off of the CCDs will also be stored indefinitely, and in several locations, we envisage that the atlas images, together with a merged pixel map of the entire Survey area, will serve the vast majority of scientific investigations. Given the rapid and continuing decrease in price for mass disk storage, it seems plausible that by the time the Survey is complete, most large observatories and astronomy departments will opt to keep this version of the data online at all times.
Many astronomers do not routinely work with data volumes of this size. One rapidly appreciates that even the simplest operations (‘select every object in this portion of sky with these colours and that morphology’) are not practical, at least not with current and foreseeable desktop hardware, unless great care is devoted not just to the query algorithms, but to the structure of the data base. We will use a hierarchically-structured, object-oriented data base architecture, with Objectivity, a commercial software environment, as the basic underlying engine.
All SDSS data will be entirely public, on a schedule limited chiefly by the human resources needed to process and calibrate this very large volume of information.
3 Survey Strategy
Even the seemingly straightforward task of selecting the deg2 survey region is in fact subtle. A region centred precisely on the North Galactic Pole and confined to does not best minimise galactic foreground extinction – a very serious issue even at low extinction levels for any magnitude-limited extragalactic survey – nor provide an optimal range of telescope zenith distances given our Observatory’s latitude of . We have instead chosen a somewhat oblique region that spans E/W and N/S, centred at . This region is displayed in figure 2, and has also been chosen by the FIRST team for their 1400 MHz comprehensive radio survey made with the VLA in the B configuration (Becker et al. 1995). Thus the entire SDSS volume will also have 1 mJy () radio coverage with accuracy positions for point sources.

An original scientific motivation for SDSS was of course an intensive study of Large Scale Structure, and the sample of galaxies will indeed dominate the spectroscopic portion of the project, requiring 400–500 fibres of the 640 total on each plate. This large spectroscopic data bank will reach 18.2, with and . We stress however that it is not simply the size of this sample that is of interest, but rather the excellent level at which it is characterised. We will know the morphology of each galaxy, and limiting areal magnitudes in five colours to a few hundredths accuracy, in a strictly homogeneous system. As selection bias is the bane of extragalactic astronomy, this virtue of the SDSS sample cannot be overstated.
An ideal goal would be to probe the power spectrum on scales to 500 Mpc, yielding elegant overlap with COBE data, as well as anticipated second-generation microwave background surveys. In practice, the effects of small and irregular foreground extinction may be severe, causing spurious signals for scales of 250 Mpc or more. We will thus use the spectra of hot halo stars in each field, together with galaxy counts and H I/IR data, to estimate the extinction in as many independent ways as possible. We may or may not reach this 500 Mpc goal, but are confident that it will be difficult to do better by any other technique. The combination of results from large surveys such as SDSS and 2dF (Colless 1998) with upcoming microwave background measurements from MAP and Planck will be particularly exciting, with prospects for remarkably precise and reasonably model-independent determinations of and (e.g., Eisenstein et al. 1998, Gawiser & Silk 1998).
About 100 fibres per spectroscopic plate will be devoted to a large QSO survey. Candidates for spectroscopy are, like the galaxies, selected autonomously from the SDSS photometric data, although in this case primarily colours rather than morphology are employed. Simulations and some limited actual data (Richards et al. 1997) indicate that the 5 SDSS photometric bands are highly efficient at identifying QSO candidates at all redshifts; only a relatively narrow band at , where the QSO locus passes through the normal stellar locus, is problematic. Furthermore, the spectroscopic integration times are optimised for galaxies, but clearly will yield useful results considerably fainter for QSOs, where all the light falls in the fibre, and strong emission lines permit easy redshift determination. We thus expect SDSS to yield spectra of (essentially all previously uncatalogued) QSOs, to a limit of . This sample is larger than the sum of all QSOs currently known from all sources. Aside from the considerable value to QSO physics of such a homogeneous spectroscopic sample, with precision colours and astrometry as well, we can anticipate absorption line systems in the data bank. While our spectral resolution is less than ideal for such work, these data do provide an additional probe of LSS quite separate from the galaxy sample. Finally, large systematic searches such as SDSS are surely the best way to identify the brightest members of any sample, in this case useful for later absorption line studies at large telescopes and from space.
Colour selection from the SDSS imaging data will provide additional QSO candidates to over the ster survey region. While we have insufficient fibres to observe each, this will be a finding list of high purity (%) for future work, and also contain some extremely high- objects. Uncertain but reasonable extrapolations (Schneider 1998) imply that SDSS may find objects at .
There will typically be several dozen fibres per spectroscopic plate remaining after the LSS galaxy and QSO spectroscopic surveys receive their allocation, even after additional fibres are used for various overheads such as sky background, guiding, photometricity monitoring, etc. These excess fibres will be used for a wide variety of scientific programs in stellar and extragalactic astronomy, probably limited chiefly by the imagination of our team. The majority of them will be allocated autonomously via colour and morphological selection from the imaging data base. (Although the capability does exist to manually specify an individual target for spectroscopic observation, SDSS is hardly a good venue for such work; one might just as easily walk 20 metres down the road and use the ARC 3.5m general purpose telescope.) We will for example take spectra of as many as possible of objects that lie far off the 5-colour locus of normal stars, but for some reason have not been selected for the QSO survey, as well as objects which coincide with FIRST radio and ROSAT All Sky Survey X-ray positions. We thus expect to discover numerous unusual stars in the halo, ranging from distant carbon stars and RR Lyrae’s (invaluable as halo dynamic probes) to cataclysmic variables and other degenerate binaries, extremely metal poor stars, planetary nebulae, dwarf carbon stars, hot white dwarfs, etc. etc.
In the autumn months the Survey region is not accessible at our observing site, but a reasonable amount of high galactic sky near the south polar cap is available. There is little virtue to repeating the primary Survey protocol during this time, as the total Survey volume is not then rapidly increased. Instead we plan to perform a separate deep imaging program which we refer to as the ‘Southern Survey’ (not however to be confused with the southern hemisphere). Over the 5 years of the main survey, we will repeatedly image a 225 deg2 stripe in this region, on approximately 45 separate visits. The sum of these data will go mag fainter than the main Survey, e.g. to , as well as probe yet another new portion of discovery space, namely the nature of time variability of the faint high latitude sky on a timescale of month. These data also provide an empirical determination of the completeness of many aspects of the main Survey. Various special-purpose spectroscopic programmes may also be performed here.
4 Scientific Strengths of the SDSS
In a project that performs such a comprehensive survey, together with a large and disparate number of targeted investigations, ranging from Earth-crossing asteroids to QSOs, it is most certainly a matter of personal taste to rank order, or even briefly but completely enumerate, the scientific strengths of the programme. Nonetheless it seems an appropriate summary to at least attempt to do so. Therefore I list here a strictly personal view, in inverse order (from least to most important), what I view as the scientific strengths of SDSS.
Large data base: The five-year Survey will produce galaxy spectra, QSO spectra, QSO images, galaxy images with photometric ’s, and stars with 5-colour photometry.
Homogeneity of the data: The Survey yields galaxies and QSOs in the identical spectrograph with very high signal-to-noise; additionally galaxies and stellar images are catalogued with 5-colour, very well-standardised photometry and excellent astrometric accuracy.
Exceptionally well-characterised samples: Each of the galaxies selected for the LSS survey has quantitative morphological data, and extremely accurate, 5-colour photometry. At the risk of stating something very well-known to all LSS pundits, LSS conclusions are known to depend on colour and morphology! Numerous recent authors e.g., Loveday et al. 1995, Hermit et al. 1996, Guzzo et al. 1997) stress that one’s knowledge of the precise composition of the galaxy sample will heavily influence one’s conclusions. Even such prosaic issues as slightly inaccurate removal of minor, patchy amounts of foreground extinction can play havoc with a magnitude-limited sample. Similar considerations apply to QSOs; in SDSS they are selected from 5-colour space, with only one narrow deadband near . Of course, the impact of galaxy morphology on LSS is not just an annoying selection effect, but something interesting to study in its own right; it yields important inferences on the bias of galaxies relative to dark matter, and therefore on galaxy formation.
Science not related to LSS: For stellar population studies, we have galaxy spectra with the identical spectrograph, with detailed morphology and 5-colour photometry available for each object. Large numbers of previously-unrecognised clusters of galaxies, low surface brightness galaxies, and gravitational lenses will be identified. The Survey produces unusual stellar spectra; there are implications not just for stellar astronomy, but for galactic structure, high-latitude extinction, etc. Numerous () asteroids will be found and characterised photometrically, including not just main belt objects, but also Near Earth Objects, Centaurs, Kuiper Belt objects, and long period comets.
Discovery potential: Many spectroscopic fibres are available in each field, unrelated to the LSS or QSO surveys, for objects of odd colour and/or morphology, FIRST radio sources, ROSAT All Sky Survey X-ray sources, etc. The filter system is especially well-optimised for QSOs.
Archival value of the imaging data bank: The 5-colour, pixel, extremely well-calibrated imaging archive of the entire northern sky at will be a community resource for decades. This ambitious but we believe correct statement seems the most appropriate with which to conclude this review.
References
- [1]
- [2] Becker, R. H., White, R. L., & Helfand, D. J. 1995 The FIRST survey: faint images of the radio sky at twenty centimeters. Astrophys. J. 450, 559-577.
- [3]
- [4] Colless, M. 1998 First results from the 2dF galaxy redshift survey. Phil. Trans. R. Soc. Lond. A, in press (this volume).
- [5]
- [6] Eisenstein, D. J., Hu, W. & Tegmark, M. 1998 Cosmic Complementarity: and from combining CMB experiments and redshift surveys, Astrophys. J. Lett. 504, in press.
- [7]
- [8] Fukugita, M., Ichikawa, T., Gunn, J. E., Doi, M. Shimasaku, K. & Schneider, D. P. 1996 The Sloan Digital Sky Survey photometric system. Astr. J. 111, 1748–56.
- [9]
- [10] Fukugita, M. 1998 The Sloan Digital Sky Survey. In Proc. 23rd General Assembly of the IAU, Highlights of Astr. 11, in press.
- [11]
- [12] Gawiser, E. & Silk, J. 1998 Extracting Primordial Density Fluctuations. Science 280, 1405–1411.
- [13]
- [14] Gunn, J. E. & Knapp, G. R. 1993 The Sloan Digital Sky Survey. In Sky Surveys: Protostars to Protogalaxies, (ed. B. T. Soifer), pp. 267–279. San Francisco: Astr. Soc. Pac.
- [15]
- [16] Gunn, J. E. & Weinberg, D. H. 1995 The Sloan Digital Sky Survey. In Wide field Spectroscopy and the Distant Universe (ed. S. J. Maddox & A. Aragón-Salamanca), pp. 3–14. Singapore: World Scientific.
- [17]
- [18] Gunn, J. E., et al. 1998 The Sloan Digital Sky Survey photometric camera. Astr. J. in press.
- [19]
- [20] Guzzo, L., Strauss, M. A., Fisher, K. B., Giovanelli, R. & Haynes, M. P. 1997 Redshift-space distortions and the real-space clustering of different galaxy types. Astrophys. J. 489, 37–48.
- [21]
- [22] Hermit, S., Santiago, B. X., Lahav, O., Strauss, M. A., Davis, M., Dressler, A. & Huchra, J. P. 1996 The two-point correlation function and morphological segregation in the Optical Redshift Survey. Mon. Not R. Astr. Soc. 283, 709-720.
- [23]
- [24] Knapp, G. R. 1997 Mining the heavens: the Sloan Digital Sky Survey. Sky & Tel. 94, 41–48.
- [25]
- [26] Krisciunas, K., Margon, B., & Szkody, P. 1998 The recognition of unusual objects in the Sloan Digital Sky Survey color system. Publ. Astr. Soc. Pac. 110, in press.
- [27]
- [28] Lenz, D. D., Newberg, H. J., Rosner, R., Richards, G. T. & Stoughton, C. 1998 Photometric separation of stellar properties using SDSS filters. Astrophys. J. Suppl. 119, in press.
- [29]
- [30] Loveday, J., Maddox, S. J., Efstathiou, G. & Peterson, B. A. 1995 The Stromlo-APM redshift survey. II. Variation of galaxy clustering with morphology and luminosity. Astrophys. J. 442, 457-468.
- [31]
- [32] Newberg, H. J. & Yanny, B. 1997 Three-dimensional parameterization of the stellar locus with application to QSO color selection. Astrophys. J. Suppl. 113, 89-104.
- [33]
- [34] Owen, R. E., Buffaloe, M. J., Leger, R. F., Mannery, E. J., Siegmund, W. A., Hull, C. L. & Waddell, P. 1998 Status of the fiber feed for the Sloan Digital Sky Survey. In Fiber Optics in Astronomy III (ed. S. Arribas, E. Mediavilla & F. Watson). San Francisco: Astr. Soc. Pac., in press.
- [35]
- [36] Richards, G. T., Yanny, B., Annis, J., Newberg, H. J. M., McKay, T. A., York, D. G. & Xiaohui-Fan 1997 Quasar photometry with the SDSS Monitor Telescope. Publ. Astr. Soc. Pac. 109, 39-46.
- [37]
- [38] Schneider, D. P. 1998 Next Generation Space Telescope observations of high-redshift quasars. In Science with the Next Generation Space Telescope (ed. E. P. Smith & A. Koratkar), pp. 106–115. San Francisco: Astr. Soc. Pac.
- [39]