Hierarchical Star Formation from the Time-Space Distribution of Star Clusters in the Large Magellanic Cloud
Abstract
The average age difference between pairs of star clusters in the Large Magellanic Clouds increases with their separation as the power. This suggests that star formation is hierarchical in space and time. Small regions form stars quickly and large regions, which often contain the small regions, form stars over a longer period. A similar result found previously for Cepheid variables is statistically less certain than the cluster result.
keywords:
open clusters and associations: general — Magellanic Clouds — stars: formation — turbulence1 Introduction
A previous study of the positions and ages of Cepheid variables in the Large Magellanic Cloud (Elmegreen & Efremov 1996) found that Cepheids closer to each other were also more likely to have the same age, as if star formation proceeds in small regions faster than in large regions. Because Cepheids are relatively old ( Myr in the LMC sample, with most around 100 Myr) and could have drifted slightly from their point of origin, and because Cepheid ages are rather uncertain, we repeat this LMC study here using star clusters. The Bica et al. (1996) catalog of clusters in the LMC contains 590 members with accurate positions and UBV colors, and these colors have been converted to age by Girardi et al. (1995). Thus we can use the Bica et al. clusters to study the hierarchical properties of star formation in the LMC.
2 Cluster age difference versus separation
We consider all pairs of clusters in the LMC for clusters within certain age ranges, and determine the average age difference among these clusters as a function of their separation for regular intervals of separation. Separation is defined to be the deprojected distance between the two clusters, considering zero depth to the LMC and an inclination of 33∘ (Luk & Rohlfs 1992). For the age difference, the absolute value is used to avoid negative numbers.
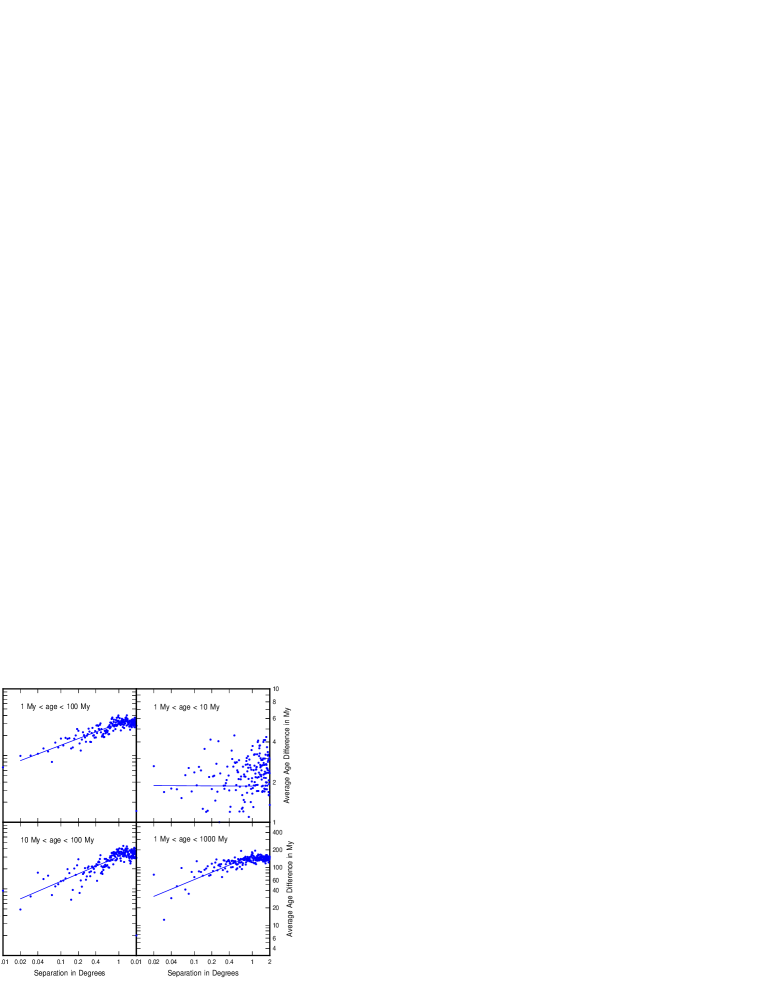
The results are shown in Figure 1. Four age intervals are considered: 1 to 100 Myr, 1 to 10 Myr, 10 to 100 Myr, and 1 to 1000 Myr. The average age difference between pairs of clusters increases systematically with their spatial separation. The number of clusters within these age intervals is 337, 93, 244, and 526, respectively.
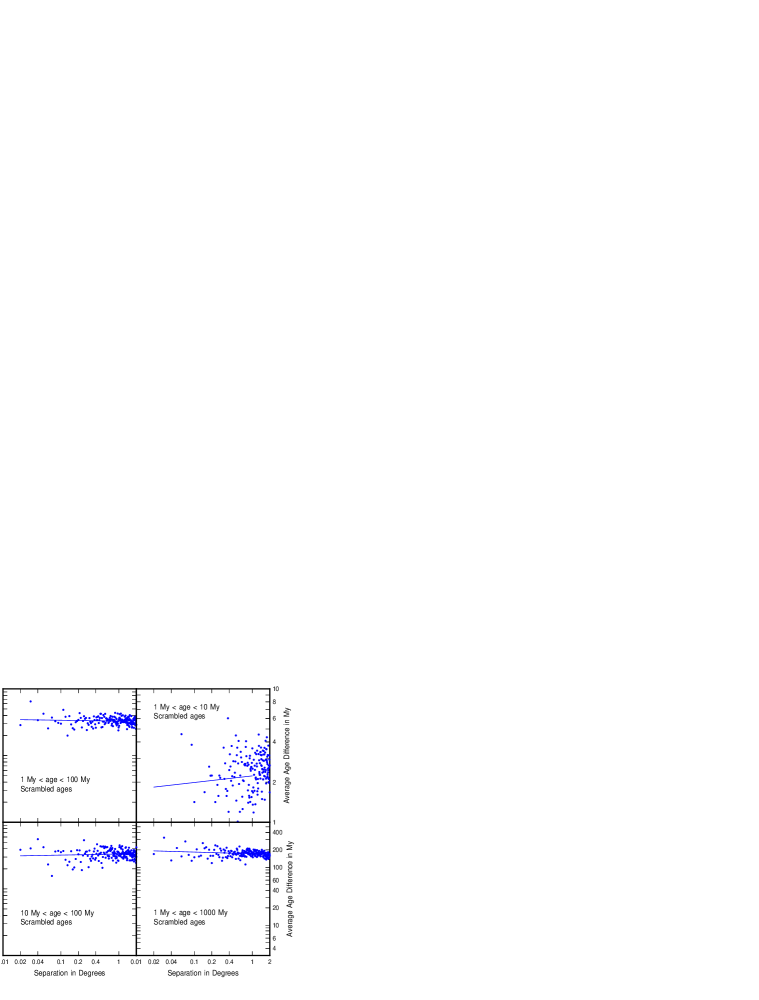
Figure 2 shows a similar study using the same 590 cluster positions, but now with ages that are mixed up randomly in order to check purely statistical effects (these are not purely random ages, but the real cluster ages that are reassigned randomly to different clusters). The correlations disappear for this random sample, i.e., the average age difference is the same regardless of separation.
Figure 3 gives the results of 100 random trials using the real cluster positions and randomly mixed ages for ages in the ranges 1-100 Myr (top) and 10-100 Myr (bottom). Each point on the left gives the least-squares fit to the slope of the correlation (evaluated in the separation interval from 0.01 to 1 degree), and each point on the right gives the correlation coefficient measuring the goodness of fit (1=perfect fit). The dashed lines represent the slopes and correlation coefficients for the real data, where the clusters have their real ages, as shown in Figure 1.
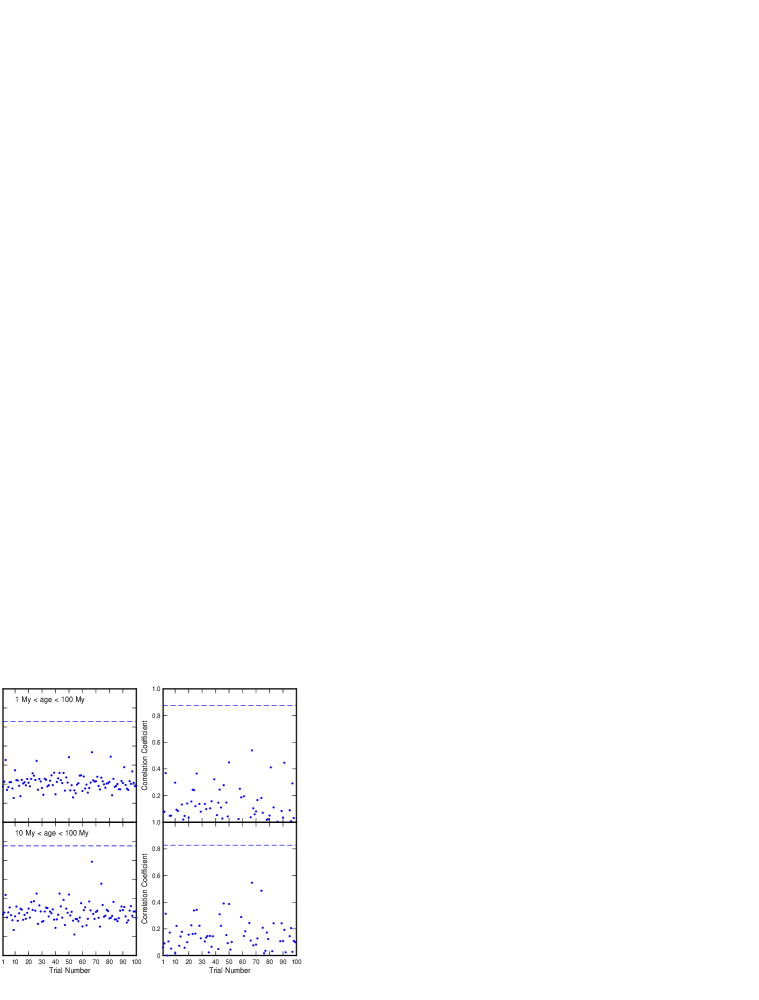
Figure 3 indicates that the slopes of the correlations for the real data in the 1-100 Myr and 10-100 Myr age intervals differ from random noise in a statistically significant way. The slope is much higher than the slopes in the random samples, and the correlation coefficient for the real data is good.
The least-squares fits in the degree separation range for the significant relations shown in figure 1 are:
| (1) |
| (2) |
| (3) |
The correlation coefficients for these three fits are 0.88, 0.83, and 0.82, respectively; the numbers of cluster pairs are 5509, 2849, and 10614. The 1-10 Myr data has too few clusters (470 pairs) to be statistically significant (correlation coefficient: ).
We conclude from these figures that clusters in the LMC form in a hierarchical sequence in which the duration of star formation in a region scales with the power of the region size over scales ranging from at least 15 pc (0.02∘) to 780 pc (1∘) at a distance of 45 kpc (Berdnikov, Vozyakova, & Dambis 1996; Efremov 1997; Efremov, Schilbach, & Zinnecker 1997; Fernley et al. 1998). For the 1-100 Myr age range in this degree separation range, this correlation is
| (4) |
3 Age difference versus separation for Cepheid variables
A similar analysis is now applied to Cepheids in the LMC, as in Elmegreen & Efremov (1996), but now we use an age calibration that is consistent with the ages of the clusters. The ages of Cepheids come from their periods, because both the period and the age of a Cepheid correlate with stellar mass. The original period-age relation came from Efremov (1978) and did not consider overshooting in the stellar evolution models. The ages of the clusters used in the previous section do consider overshooting, so we have to recalibrate the period-age relation using the Girardi et al. (1995) cluster age data.
Table 1 gives the designations, UBV data, and ages of select clusters in the LMC, and the names and periods of Cepheid variables that appear to be associated with these clusters. The UBV data are from Bica et al. (1996), and the ages come from the S values as determined in Girardi et al. (1995). The sources of the data on the cluster-Cepheid associations are indicated by the references. These are the most certain associations in the LMC. Many other Cepheids are reasonably close to clusters too (Efremov 1978, 1989), but their memberships or ages were not judged to be as certain. Sometimes it was difficult to select unambiguous associations in the rich fields, as was the case for the NGC 1850 binary cluster and a half dozen Cepheids close to it.
We have not included the Cepheids with small amplitudes and sinusoidal curves (subtype Cs), which are either the first-overtone pulsators or those at the first crossing of the instability strip (Efremov 1968). Their periods do not correspond to ages in the same way as for the common Cepheids.
Most of the Cepheids in the table are well inside cluster cores, whereas those with references to Efremov (1978) are within 2 - 3 radii of cores. The latter is presumably the case for the Alcock et al. (1995) data as well.
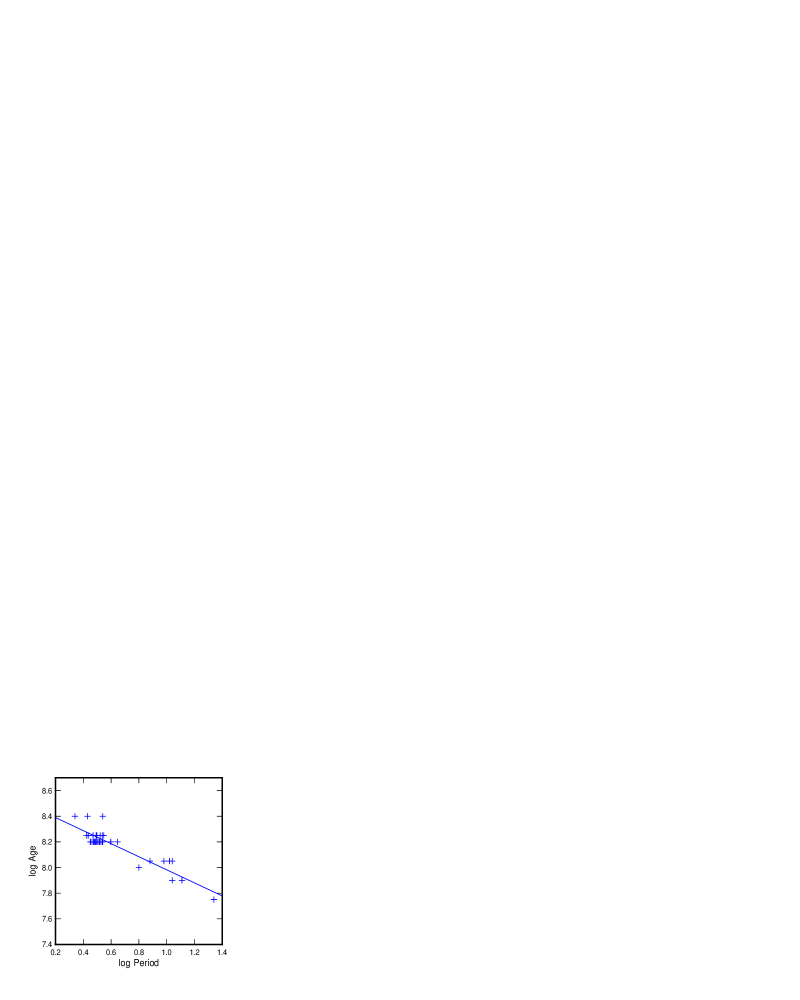
The data in table 1 gives the new period - age relation shown in figure 4. The correlation is
| (5) |
for in years and in days. The correlation coefficient is 0.90. The result for paper 1 was , which gives shorter ages by a factor of .
The age differences between all pairs of Cepheids in the Artyukhina et al. (1995) catalog with ages less than 100 Myr were determined for intervals of deprojected separation equal to 0.01 degree, and the average age differences for each interval were found. Figure 5 shows the average age difference versus separation for these Cepheids. The figure suggests there is no significant correlation between and in the Cepheid data, but the statistical uncertainty is large (out of 1200 Cepheids in the Artyukhina et al. catalog, there are only 167 younger than 100 Myr, and among these, there are only 1357 pairs with separations less than 1∘).
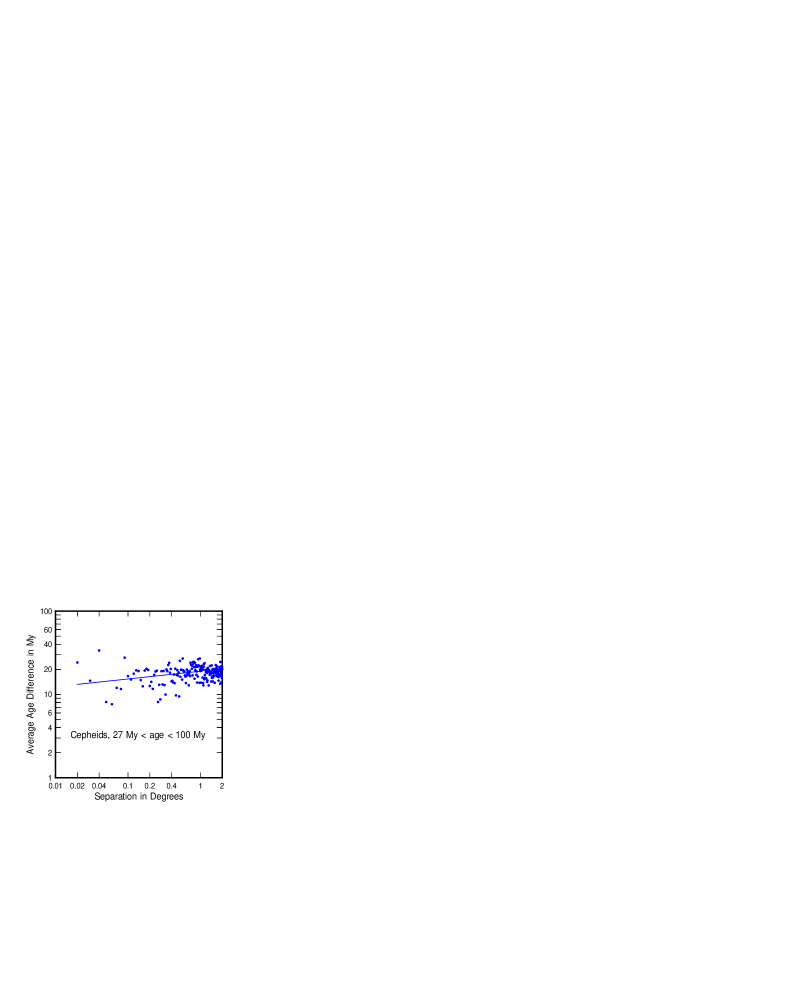
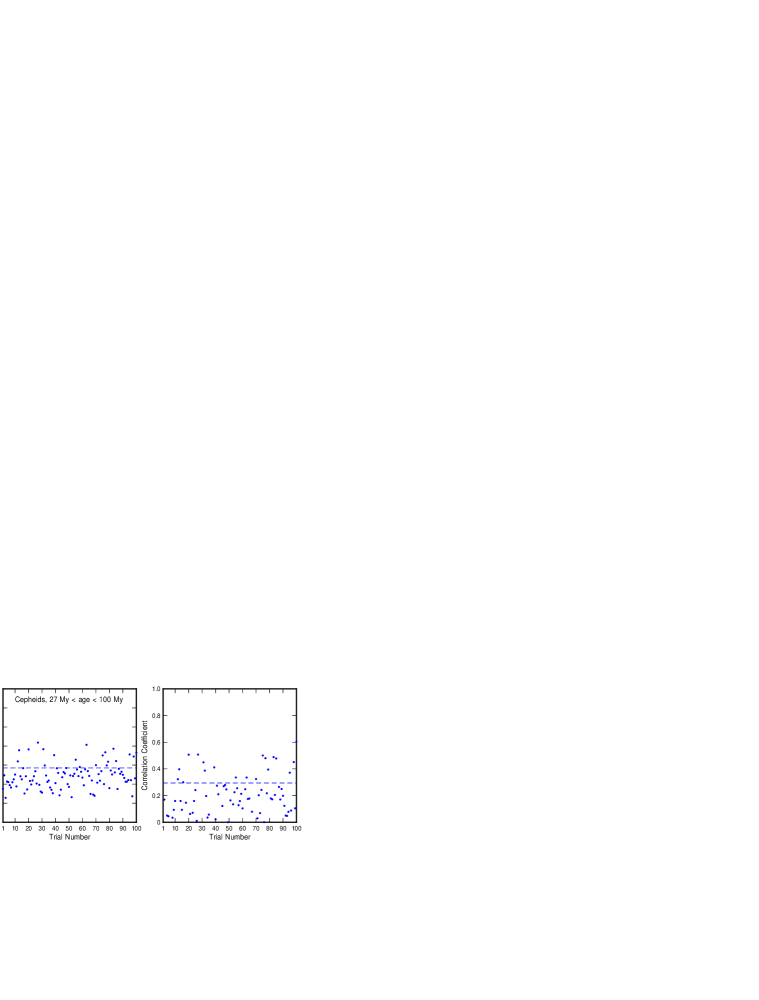
Figure 6 shows 100 random trials for the Cepheids, using the observed Cepheid positions with randomly scrambled ages, as for the clusters. The slopes of the relations are shown on the left and the correlation coefficients are shown on the right. The dashed lines are the measured slope and correlation coefficient, using the real Cepheid data. Evidently, the observed relation for Cepheids is consistent with noise. If there is a relation for these stars at birth, as appears to be the case for clusters, then this relation is apparently destroyed or obscured by the time the stars become Cepheids.
Possible reasons for the elimination of an initial relation include random stellar motions and inaccuracies in the Cepheid period-age relation. The correlations shown here are better for clusters, perhaps because clusters have smaller space velocities than individual stars, so they drift less from their points of origin than Cepheids. Smaller space velocities for clusters might be reasonable if clusters, born in cloud cores, start with the centroid velocities of the star-forming clouds, while individual stars, dispersed in associations, start with these centroid velocities plus the dispersal speeds.
4 Discussion
The positions and ages of clusters in the LMC suggest that there is a correlation between the duration of star formation in a region and the size of the region. This correlation may be the result of star formation inside cloud complexes that always live for several turbulent crossing times.
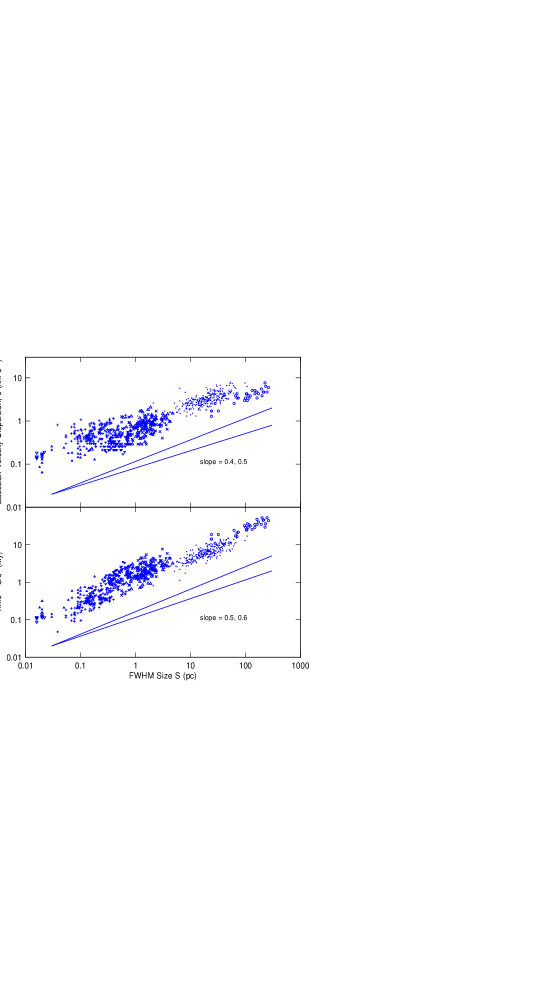
The turbulent crossing time in a region of star formation may be estimated from the size-linewidth relation for the clouds that form stars. A compilation of the size-linewidth relations for molecular clouds in the Milky Way is shown in figure 7. The size is the FWHM of clouds and clumps in various surveys, and the linewidth is the Gaussian dispersion. The average relation for all the surveys is
| (6) |
The ratio of to is shown on the bottom of the figure. Half of this ratio gives the turbulent crossing time,
| (7) |
Because of the size-linewidth relation, the turbulent crossing time increases with cloud size approximately as the square root. This slope is comparable to, although slightly larger than, the relation for clusters, suggesting that the LMC cluster relation results in part from turbulence. For separations of 10 pc and 100 pc, the average age difference between clusters in the LMC is 3.2, and 2.1 times the crossing time of galactic molecular clouds on the same scale. This suggests that star formation always proceeds with a time scale of crossing times in the progenitor cloud.
The size-linewidth relation for clouds in the LMC is not well known, but a recent study suggests that the linewidths in the L48 clumps are slightly larger for the clump size than the linewidths in galactic GMCs (Kutner et al. 1998). This could be a region of unusually high pressure and not normal for star formation in the LMC, but if this result is representative, then would be slightly lower than for Galactic clouds, and the ratio of the star formation time to the crossing time slightly larger than .
The relation for clusters is not the result of OB association expansion or stellar drift at a fixed initial velocity because then the slope of the correlation would be 1 instead of . It has to result from stellar or gas kinematics with velocity dispersions that scale with a fractional power of the size of the region.
There are several important implications for star formation of the cluster relation:
1. On all scales over which the correlation exists, small regions come and go while large regions continue to form stars. This implies there might be some recycling of small-scale star-forming material during the lifetime of the larger region. Then metal enrichment from supernovae can be greater in the most active clouds, and more variable from cloud to cloud than previously thought (Elmegreen 1998), and total cloud ages can be longer than previously determined from cloud disruption times following only one epoch of star formation (Leisawitz et al. 1989).
2. Larger star-forming regions have both larger velocity dispersions and larger average ages than smaller regions. This trend is similar to that found for OB subgroups and whole OB associations and may contribute to the impression that OB subgroups expand into OB associations. There may not be this much expansion, however. Instead, there could be a difference in the sizes and velocity dispersions of the two types of regions from birth. OB subgroups are born small and they may stay moderately small during the formation time of the other subgroups. All of the subgroups together define the association, which is a composite of clumpy subparts.
3. The largest regions of star formation in giant spiral galaxies, regions like Gould’s Belt and other Star Complexes measuring 300 pc to 1 kpc, take so long to form (30 Myr) that they are not particularly bright on average. They are also not unified in appearance by a single bright HII region or concentration of O stars, because the general population of O stars that formed there has already aged off the main sequence. Instead, they are visible primarily as concentrations of Cepheid variables and other supergiant stars, which is how they were originally discovered (Efremov 1979, 1989). Most of the O stars are visible only in smaller concentrations, which appear as multiple cores inside the star complexes. Thus the largest regions of star formation in giant spiral galaxies are often overlooked, especially in H or UV studies.
This situation changes in smaller galaxies, where the star formation length and time scales are generally shorter than in large galaxies (Elmegreen et al. 1996). In small galaxies, the largest regions of star formation can form so quickly that there are still many OB stars, and then they appear very bright, like 30 Dor (see review in Elmegreen & Efremov 1998).
4. Regions of star formation that are defined by HII regions in H images of other galaxies tend to be concentrations of O-type stars, and therefore have ages of around 10 million years. These regions are the classical OB associations. Because of the correlation, they have a characteristic size that corresponds to their age. For a measured characteristic size of OB associations equal to pc (Lucke & Hodge 1970; Efremov, Ivanov, & Nikolov 1987), equation 4 confirms that their duration of star formation is Myr. The identification of these regions is entirely based on the presence of O-stars and bright emission nebulae, and is therefore only a selection of one particular scale out of a continuum of scales for the star-formation process. This was implicitly the case in Efremov et al. (1987) and Battinelli et al. (1996), where stars in M31 were selected to be brightest in U or B to detect the O-associations. However, OB associations are not representative of the star formation process in general; they are only one level in a continuous hierarchy of self-similar processes that extends from parsec to kiloparsec scales (Elmegreen & Efremov 1996, 1998).
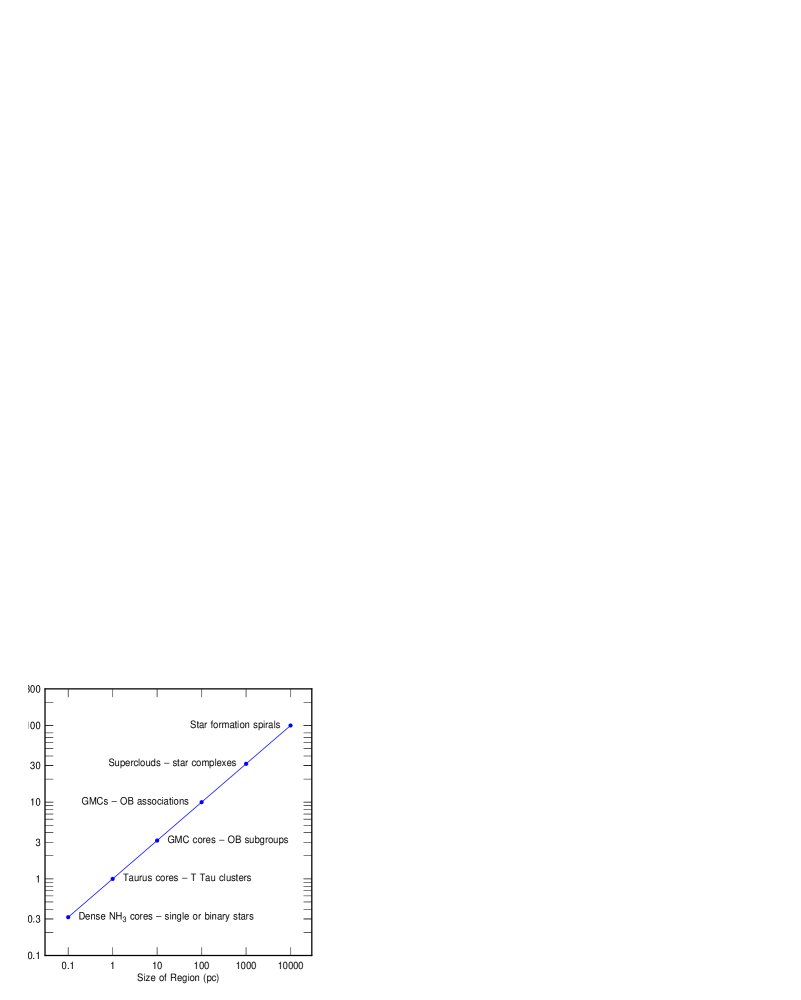
Figure 8 shows a schematic diagram of the sizes and durations of star formation in regions that are commonly discussed. The relation here is based on the square root approximation to the power in the size-linewidth relation (cf. Eq. 6) and not on the slightly shallower power-law dependence for clusters written in equation (4). The square root dependence gives a more sensible result over the whole range of star-forming scales. The figure considers small clumps in which individual stars form on year time scales, T-Tauri stellar associations, OB subgroups and associations, and star complexes, in which stars typically form on 1, 3, 10 and 30 Myr time scales, respectively. The figure also includes spiral arm segments (not density waves) that may extend for kpc. The ages of spiral arm segments come from the pitch angles () and the rate of shear in the galaxy. We discussed previously how such star-forming spiral arms, which are clearly distinct from density waves by their short lengths and lack of dustlanes, are a natural extension of the star formation process to scales larger than the disk thickness (Elmegreen & Efremov 1996).
5. Star formation may be intimately connected with turbulence because of the similarity between the relation and the relation for molecular clouds. If true, then turbulence would contribute to the rate of star formation in a region. The formation of cloud structure by turbulent processes is well recognized (e.g., Langer et al. 1995; Falgarone & Phillips 1996).
5 Acknowledgements
Comments by the referee on statistical effects in the Cepheid data are greatly appreciated. Yu.E. was partially supported by the RFBR grant 97-02-17358.
References
- [1] Alcock C. et al. 1995, AJ, 109, 1653
- [2] Artyukhina, N.M., et al. 1995, The General Catalogue of Variable Stars, Volume V, ed. N.N. Samus, Moscow: Kosmoinform, p. 2-75
- [3] Battinelli, P., Efremov, Yu.N.& Magnier, E. 1996, A&A, 314, 51
- [4] Bertelli, G., Bressan, A., Chiosi, C., Mateo, M., & Wood, P.R. 1993, ApJ, 412, 160
- [5] Bica E., Claria, J.J., Dottori, H., Santos, J.F.C., & Piatti, A.E. 1996, ApJS, 102, 57
- [6] Blaauw, A. 1964, ARA&A, 2, 213
- [7] Dame, T., Elmegreen, B.G., Cohen, R., & Thaddeus, P. 1986, ApJ, 305, 892
- [8] Efremov, Yu.N. 1964, Perem. Zvezdy (Var. Stars), 15, 242
- [9] Efremov, Yu.N. 1968, Perem. Zvezdy (Var. Stars), 16, 365
- [10] Efremov, Yu.N. 1978, Russian AJ, 55, 272
- [11] Efremov, Yu.N. 1979, Sov. Astron. Letters, 5, 12
- [12] Efremov, Yu.N. 1985, Sov. Astron. Letters, 11, 69
- [13] Efremov, Yu.N. 1989, Star Formation Origins in the Galaxies, (in Russian), Moscow
- [14] Efremov, Yu.N. 1997a, Astr. Letters, 23, 579
- [15] Efremov, Yu.N. 1997b, Astr. Rep., 74, 325
- [16] Efremov, Yu.N. & Pavlovskaya, E.D. 1982, Sov. Astr. Lett., 8, 4
- [17] Efremov, Yu.N., Ivanov, G.R., & Nikolov, N.S. 1987, A&SS, 135, 119
- [18] Efremov, Yu.N., Schilbach, E., & Zinnecker, H. 1998, AN, 318, 335
- [19] Elmegreen, B.G. 1997, in Starburst Activity in Galaxies, ed. J. Franco, R. Terlevich, & A. Serrano, Revista Mexicana de Astronomia and Astrofisica (Serie Conferencias), Vol. 6, 165
- [20] Elmegreen, B.G. 1998, in Abundance Profiles: Diagnostic Tools for Galaxy History,” ed. D. Friedli, M.G. Edmunds, C. Robert, & L. Drissen, ASP Conference Series, 1998, in press.
- [21] Elmegreen, B.G., & Efremov, Yu. N. 1996, ApJ, 466, 802
- [22] Elmegreen, B.G., & Efremov, Yu. N. 1997, ApJ, 480, 235
- [23] Elmegreen, B.G., & Efremov, Yu. N. 1998, in The Orion Complex Revisited, ed. M.J. McCaughrean & A. Burhert, ASP Conference Series, in press
- [24] Elmegreen, B.G, Elmegreen, D.M., Salzer, J., & Mann, H. 1996, ApJ, 467, 579
- [25] Falgarone, E., Puget, J.L., & Pérault, M. 1992, A&A, 257, 715
- [26] Falgarone, E. & Phillips, T.G. 1996, ApJ, 472, 191
- [27] Gascoigne S.C.B., Hearnshaws J.B. 1971, Proc. ASA, 1, 208
- [28] Girardi, L., Chiosi, C., Bertelli, G., & Bressan, A. 1995, A&A, 298, 87
- [29] Kutner, M.L., Rubio, M., Chiar, J., Booth, R.S., Boulanger, F., de Graauw, Th., Garay, G., Israel, F.P., Johansson, L.E.B., Lequeux, J., Nyman, L.-A. 1998, in preparation
- [30] Langer, W.D., Velusamy, T., Kuiper, T.B.H., Levin, S., Olsen, E., & Migenes, V. 1995, ApJ, 453, 293
- [31] Leisawitz, D., Bash, F., & Thaddeus, P. 1989, ApJS, 70, 731
- [32] Lemme, C., Walmsley, C.M., Wilson, T.L., & Muders, D. 1995, A&A, 302, 509
- [33] Loren, R.B. 1989, ApJ, 338, 902
- [34] Lucke, P.B. & Hodge, P. 1970, AJ, 75, 171
- [35] Luks, Th., & Rohfls, K. 1992, A&A, 263, 41
- [36] Mateo M. 1992, PASP, 104, 824
- [37] Robertson J.W. 1974, AApSS, 15, 261
- [38] Solomon, P.M., Rivolo, A.R., Barrett, J., & Yahil, A. 1987, ApJ, 319, 730
- [39] Stutzki, J., & Güsten, R. 1990, ApJ, 356, 513
- [40] Welch D.L., M.Mateo, Cote P., Fischer, P. and Madore, B. 1991, AJ, 101, 490
- [41] Williams, J.P., de Geus, E.J., & Blitz, L. 1994, ApJ, 428, 693
| cluster | V | U-B | B-V | S | Cepheid | (days) | ref. | |
| NGC 1755 | 9.85 | -0.20 | 0.16 | 24 | 8.00 | - | 0.80 | Mateo 1992 |
| NGC 1756 | 12.24 | 0.09 | 0.40 | 30 | 8.40 | - | 0.34 | Alcock et al 1995 |
| - | 0.43 | |||||||
| - | 0.54 | |||||||
| NGC 1866 | 9.73 | -0.02 | 0.25 | 28 | 8.25 | HV 12197 | 0.497 | Welch et al. 1991 |
| 12198 | 0.547 | |||||||
| 12199 | 0.422 | |||||||
| 12200 | 0.435 | |||||||
| 12202 | 0.492 | |||||||
| 12203 | 0.470 | |||||||
| 12204 | 0.536 | |||||||
| V4 | 0.521 | |||||||
| NGC 2010 | 11.72 | -0.07 | 0.24 | 27 | 8.20 | HV 2599 | 0.455 | Gascoigne & Hearnshaws 1971 |
| var3 | 0.54 | |||||||
| NGC 2031 | 10.83 | -0.07 | 0.26 | 27 | 8.20 | 1 | 0.487 | Bertelli et al. 1993 |
| 2 | 0.646 | |||||||
| 3 | 0.598 | |||||||
| 4 | 0.535 | |||||||
| 5 | 0.521 | |||||||
| 6 | 0.481 | |||||||
| 7 | 0.496 | |||||||
| 8 | 0.515 | |||||||
| 9 | 0.470 | |||||||
| 10 | 0.521 | |||||||
| 11 | 0.450 | |||||||
| 13 | 0.505 | |||||||
| 14 | 0.473 | |||||||
| NGC 2136 | 10.54 | -0.13 | 0.28 | 25 | 8.05 | HV 2868 | 0.88 | Robertson 1974, Efremov 1978 |
| 2870 | 0.98 | |||||||
| 12230 | 1.02 | |||||||
| B21 | 1.04 | |||||||
| NGC 2214 | 10.93 | -0.27 | 0.11 | 23 | 7.90 | B1 | 1.04 | Robertson 1974 |
| SL 106 | 11.28 | -0.33 | 0.15 | 21 | 7.75 | HV2245 | 1.34 | Efremov 1978 |
| SL 234 | 12.44 | -0.36 | -0.03 | 23 | 7.90 | HV2321 | 1.11 | Efremov 1978 |